Learning the Ichimoku Cloud
Introduction
Still growing amongst the Western and European traders, the Ichimoku Cloud (or Ichimoku Kinko Hyo = One Glance Balance Cloud Chart) was originally developed pre-WWII by a man named Goichi Hosada. Because of the war, his research was halted and then later finished in 1968 whereby he published a 1,000 page, 4 volume body of work releasing the Ichimoku Cloud to the world under the pen-name Ichimoku Sanjin.
Originally built for the Japanese stock markets, the Ichimoku cloud indicator has made its way out of the land of the Eastern sun and into the trading world at large, being applied and used widely in the Commodities, Futures, Options and Forex markets. Part of the Ichimoku Cloud trading system’s success is its ability to find trends and reversals well before they begin.
The Indicator
The Ichimoku Cloud has several components which give it a lot of versatility and uses. The most unique aspect of the indicator is its ‘Kumo’ or cloud which offers a unique perspective of support and resistance. Most western methods look at support and resistance in a linear fashion or as straight lines in the sand (e.g. Fibonacci, Pivots, Channel Lines, Trend Lines). However the Kumo or cloud is an ever evolving object which was designed to represent support and resistance based upon price action. Generally, when you are in a strong upward trend, the support is strong as the price levels below have been accepted. The same goes for a strong downtrend and having more layers of resistance. Below are two examples of up and downtrends – showing how the Kumo was quite thick in nature.
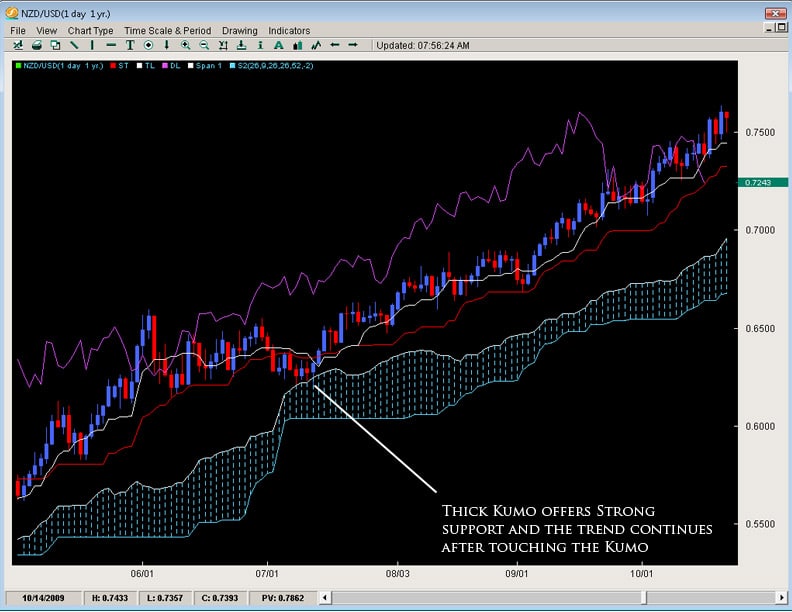
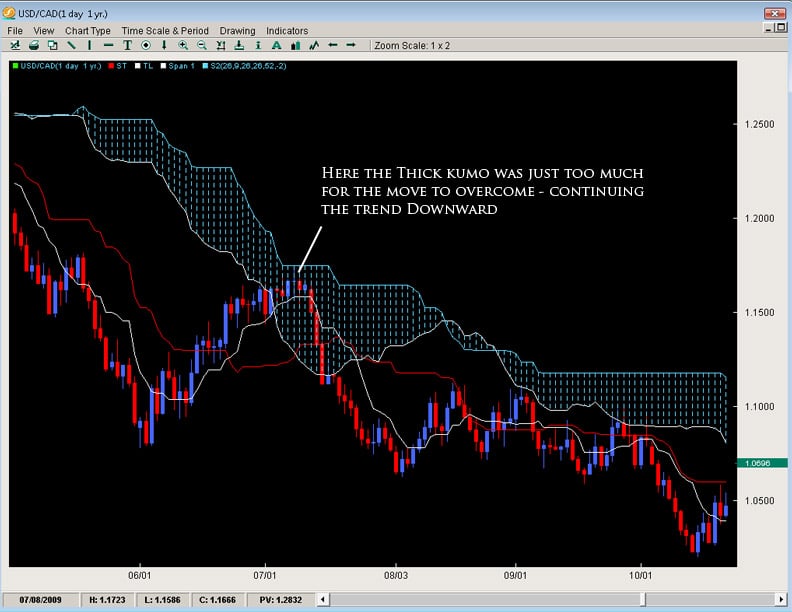
The most important way to look at the Kumo is as support and resistance – meaning if it is thick, then the support/resistance (depending upon where price is in relationship to the cloud) is strong. If price is above the Kumo, we are in a general uptrend or would want to look for more buying opportunities. If price is below the cloud, it is below resistance (the Kumo) and we want to be searching for more shorts than longs. The longer price stays below/above the cloud, the stronger the trend we are in and the more support/resistance the Kumo will offer.
Kumo Composition
There are two main lines of the Kumo which are referred to as Senkou Span A and Senkou Span B. For the purposes of efficiency, we will refer to them as Span A and Span B. The space or value in between these two lines is what forms the Kumo.
Span A is formed by taking the Tenkan Line and adding it to the Kijun Line (white and red lines respectively from chart above), then dividing that value by 2 and plotting it 26 periods ahead. The formula is;
(Tenkan Line + Kijun Line) / 2 placed 26 periods ahead
Span B is formed by taking the highest high (over the last 52 periods), adding to it the lowest low (over the last 52 periods), dividing that by 2 and plotting that 26 time periods ahead. The formula is;
(Highest High + Lowest Low for the last 52 periods) / 2 and plotted 26 time periods ahead.
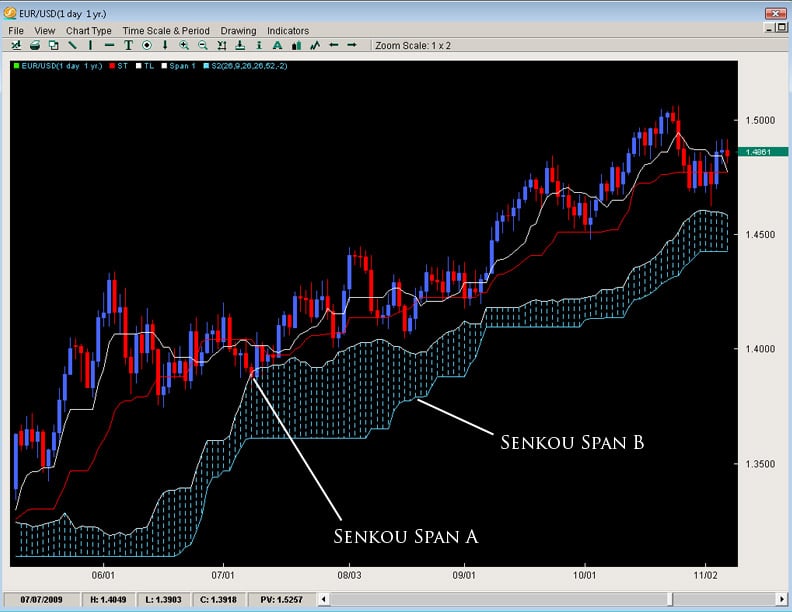
We will talk about some important points regarding the construction of the Kumo later.
Other Ichimoku Components
(Tenkan, Kijun and Chikou Span Lines)
The Tenkan Line or Tenkan Sen (Sen means line in Japanese) is known as the conversion line or turning line is similar to a 9SMA but actually is quite different. Remember a SMA (simple moving average) will smooth out all the data and make it equal but the Tenkan Line will take the highest high and lowest low over the last 9 periods. The explanation for this is Hosada felt price action and its extremes were more important than smoothing any data because price action represented where buyers/sellers entered and directed the market, thus being more important than averaging or smoothing the data out. As you can see by the chart below, the Tenkan Line is quite different than a 9SMA. Because the TL (Tenkan Line) uses price instead of an averaging or the closing prices, it mirrors price better and is more representative of it. You can see this when the TL flattens in small portions to move with price and its moments of ranging.
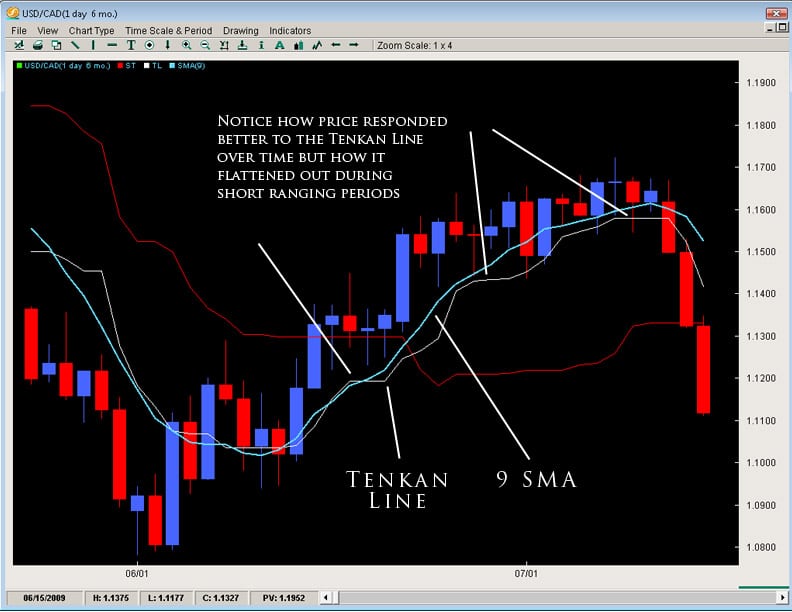
Akin to all moving averages, the angle of the Tenkan line is very important as the sharper the angle, the stronger the trend while the flatter the Tenkan, the flatter or lesser the momentum of the move is. However, it is important to not use the Tenkan line as a gauge of the trend but more so the momentum of the move. However, it can act as the first line of defense in a trend and a breaking of it in the opposite direction of the move can often be a sign of the defenses weakening.
The Kijun Line (or Kijun Sen) is known as the datum line, standard line or trend line designed to indicate the overall trend for the instrument or pair. The formula behind it is the same as the Tenkan line using price action and the highest high + lowest low with the only change being in the periods as it does it over the last 26 periods.
Why 26 periods? The answer to that is a matter of history. When the Ichimoku cloud was first created, the Japanese markets were open 6 days a week on Saturdays. If the markets are open 6 days a week, this generally results in 26 trading days for the month – hence 26 periods for the Kijun. In essence, what it was meant to be was a measure of the highest high + lowest low for the last month of price action. If the Kijun has been climbing – it means price has been gaining ground for the last month. If it is flat, then it will be the midpoint of the range of price for the last month of price action (or representative of the price equilibrium).
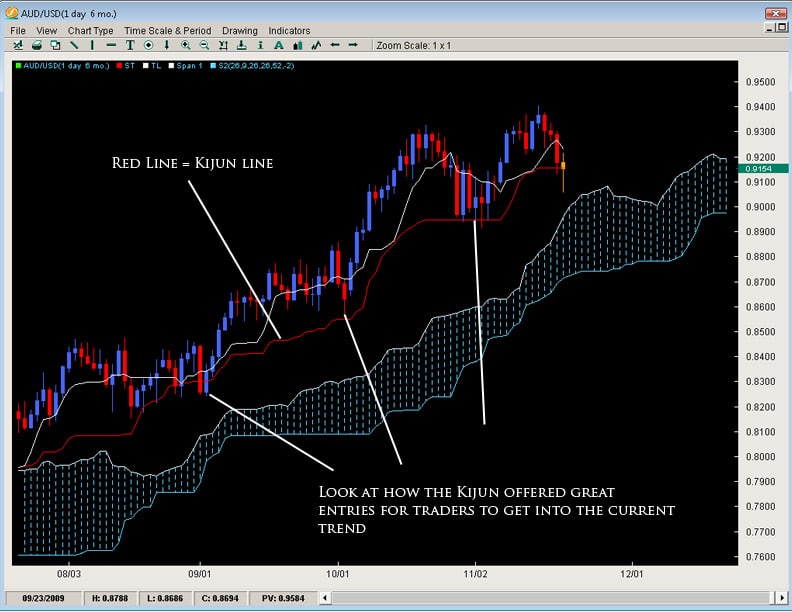
Also like the Tenkan Line, the angle of the Kijun is reflective of the overall trend in place. Price breaking the Kijun after being in an up/down trend often has serious consequences for that trend and can many times lead to a reversal of sorts. Ultimately because it uses a longer period to measure price action, its a more stable method for determining the direction of the trend than the Tenkan Line. Because of price to respect this line during a strong trend, it can potentially be used as a stop loss for traders already in the correct direction of the trend. Hence, when price breaks or closes below it by a significant amount, the trend is often over.
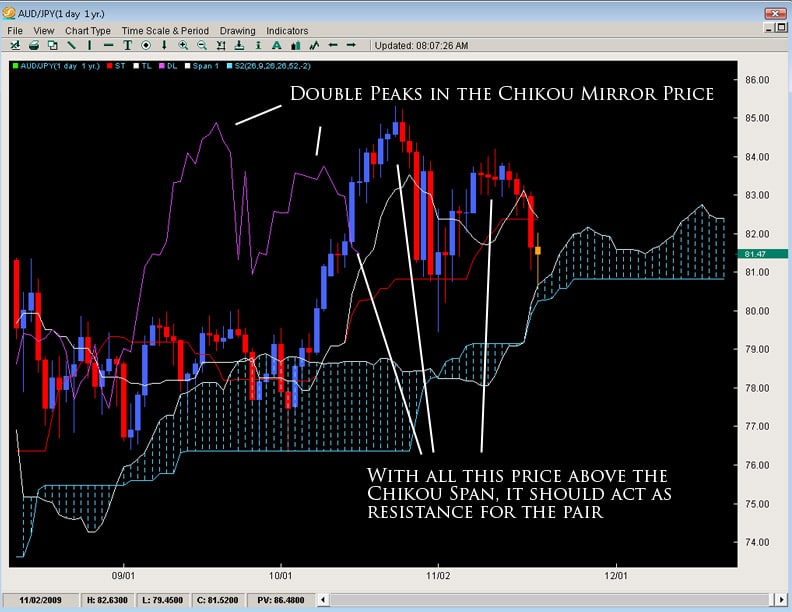
The Chikou Span or lagging line is created by taking the current closing price for the instrument and shifted 26 time periods back, hence why it is a lagging line. This is a strange concept and not something usually seen in technical indicators which makes the Ichimoku Cloud even more unique. The purpose is simply to gain perspective in regards to how the current price action is in relationship to previous price action.
The main application for giving perspective to the trader is how does the Chikou Span relate to price 26 periods ago. If the Chikou Span is lower than price 26 periods ago, then there is resistance for the current upmove or pressure which could force price down into a bearish move. However if the Chikou Span is above price from 26 periods ago, then it would mean there is little or no resistance ahead since price is in the process of making new highs and there is no recent price above it – thus paving the way for a strong trend.
Applications for the Tenkan and Kijun
The most common usage of the Tenkan and Kijun are the ‘cross’ or what we call the TKx (Tenkan-Kijun Cross). Similar to how a MACD uses a cross of its two lines, the Ichimoku Cloud does the same. It is interesting to note that the Ichimoku cloud uses the same periods as the MACD, however it was created over a decade earlier.
One of the main signals for Ichimoku cloud traders, the TKx can often indicate when a trend is about to begin by forming a cross (upward cross = possible upward trend while downward cross = possible down trend). A generic upward cross can be used as a bullish signal (or exit for people already short) and a generic downward cross can be used as a generic bearish signal (and vice versa for current bulls). However, notice we used the term ‘generic’ meaning there is more to the cross.
Hosada was able to give a further definition to the cross based upon its position to the Kumo or cloud. If the cross was below the Kumo, then it was considered a ‘weak’ signal since the cross was below the Kumo or below resistance. A medium signal was when a cross happened inside the Kumo as it was occurring within the field of support/resistance. A strong signal was when the bullish cross happened above the Kumo as it was happening after clearing resistance. The opposite is true for bearish signals whereby a weak signal is a cross above the Kumo, while a medium signal is inside the Kumo and a strong signal below the Kumo. One important reminder to all this is to make sure you reference the Chikou Span to see how current price is in relationship to previous price action.
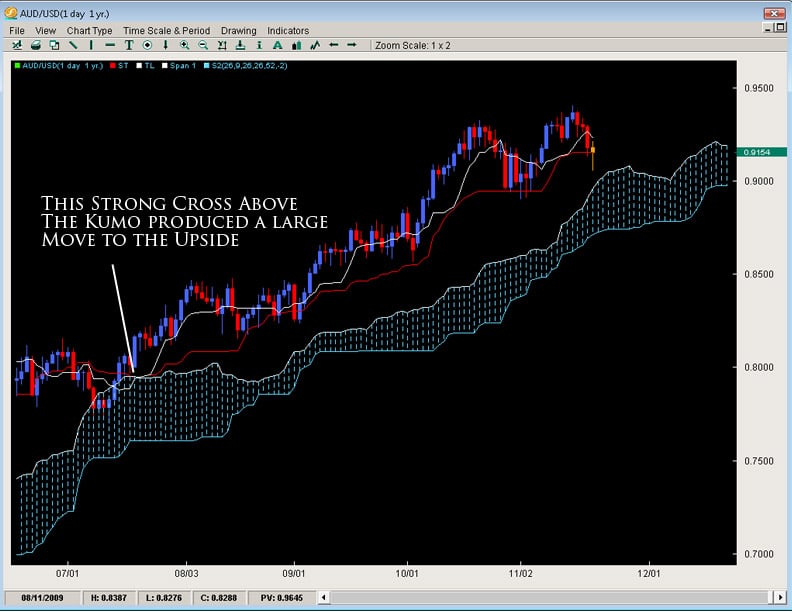
The nature of the cross usually indicates the overall strength or potential for the move but it should be noted strong trends have developed from weak crosses. It is always also important you reference the construction of the Kumo when trading the typical TKx signals.
Some Important Final Notes on the Kumo
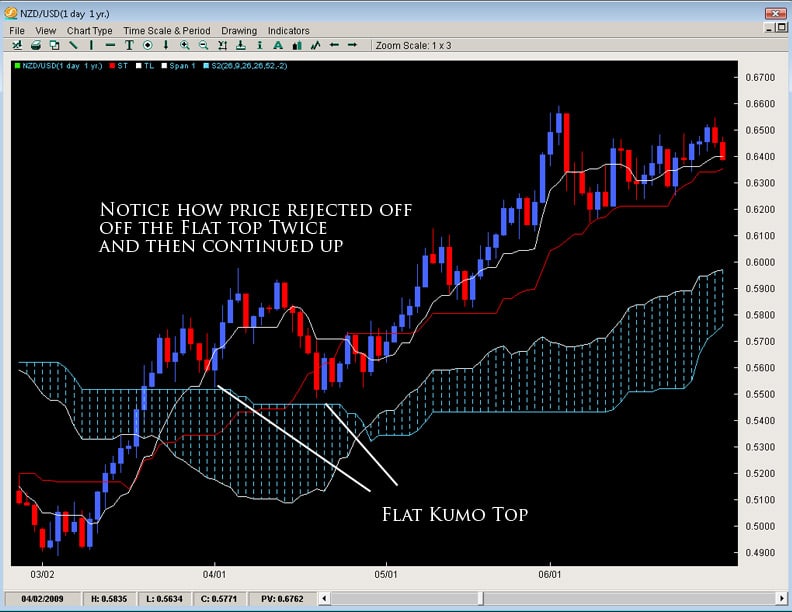
As we talked about before, the Kumo is designed to represent support and resistance but it has a host of implications in doing such. To review, the thicker the Kumo, the stronger the support/resistance it will offer. Price will often reject off of the Kumo only to resume the current trend as depicted below by a few examples.
What this also means is if the Kumo is exceptionally thin, in a ranging market it likely means the range will continue as their is neither enough support or resistance to hold a single direction for the pair. What it also means is if we are in a current trend and price is approaching a thin Kumo, the chances increase for a trend reversal since the support/resistance offered by the Kumo is not significant. This is why Kumo analysis is important as it can often lead to reversals and inform us in the future of pending trend changes.
Also, there is a common formation in the Kumo called the ‘flat top or bottom’. This refers to when the Span B becomes flat. Remember the Span B is composed of the last 52 candles absolute highest high and lowest low – thus referring to price action over the last 52 periods. If Span B is flat, the only way it can do that is if price has not extended to make any new significant highs or lows. This means we are in a range and the tendency of a range is to move towards equilibrium or towards the center of the range – also known as the value area for price. The end result is during a ranging environment, the Span B is the virtual 50% fibonacci retracement level for that range and is the ever changing 50% fib level for a trending environment, dividing the last 52 candles into two halves, the upper and lower half.
What does this mean for traders? If price is inside the Kumo, it will have a tendency to gravitate towards the flat top/bottom. If price is above it, the tendency of price will be to gravitate towards the flat top/bottom, often using it as a springboard for a rejection off of it.
Lastly, one of the most important things about the Kumo is what happens when price breaks it. If we have been in a strong trend for sometime and price then breaks the Kumo, it usually represents a trend change and the likelihood of a large move about to begin in the direction of the break as you can see by the examples below.
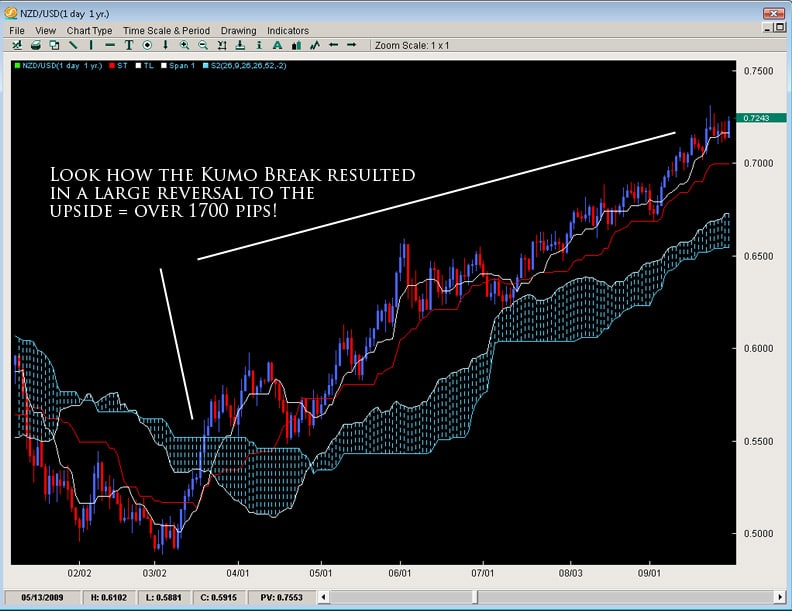
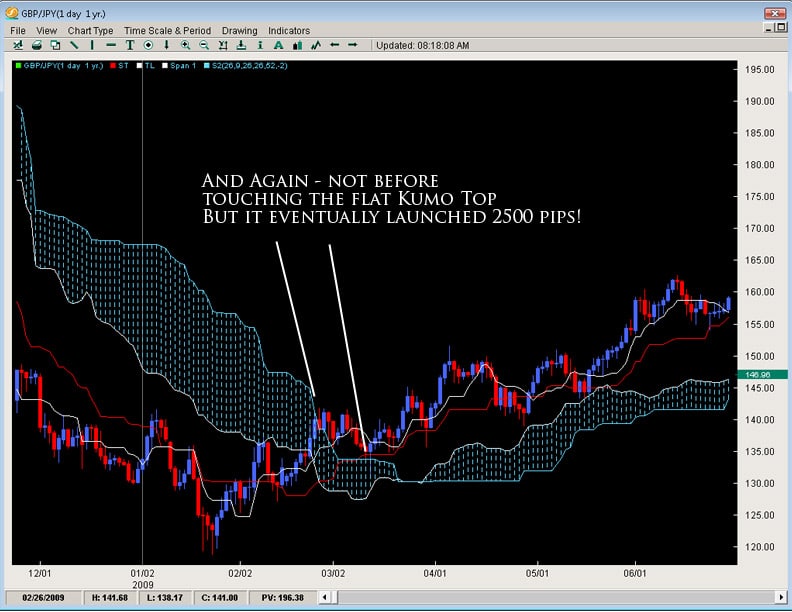
It is because the Kumo is always changing shape that it can represent a much better perspective of support and resistance. It is essentially based upon price action and changing shape based upon previous price moves. This makes it a little more sensitive and representational to price unlike static forms of support and resistance (fibonacci retracement levels, pivots, trend lines, etc) which do not move at all once they are in place. It is its unique construction which allows the Kumo to be both Static and Dynamic in giving support/resistance levels to the trader.
In Closing
This is just the beginning of the Ichimoku Cloud and designed to give the trader an introduction to the key elements around such a fascinating indicator and method for trading the markets. The Ichimoku Cloud has the ability to detect trends, reversals, support/resistance levels, trend strength/weakness and momentum for a pair. It is due to its ability to be used in multiple environments, along with its unique perspective upon price and support/resistance levels that Institutional and retail traders have gravitated towards using this method.

Hi Chris
Great reading material. Have to read it a couple of time to register in the brain. Only then the course video is clear.
thanks
prem
Chris..thanx for this post..I have been following you on your ichi studies for years..I do use it on all my charts now..and have a pretty good understanding of it from using it for so long now..I do miss your webinars that are specifically ichimoku..It seems that you are moving away from it..into algo’s and price action..and I dont hear much about the book I wsa so looking foward too..I would love to join your advanced class, but cant at this time afford it..living in So.Calif and having watched my career fall apart (Residential Const. Superitendant) is taking its toll on my bank acct. But hoping some day I might be able to afford you..You have helped me over the years more than you could imagine..and I thank you for that..I hope everything is good with you…Ed.
Hello Ed,
Thanks for the kind words on the Ichimoku material.
I am not actually moving away from it and still use it. But after teaching the webinar for 3yrs, I wanted to mix it up a little bit
and price action is a critical component to the structure and design of the ichimoku cloud.
Once i finish the price action book, ill be then going to work straight on the ichimoku book so its still on my top priority list.
Sorry to hear about your work – I had a nephew who had the same type of work and has been out of it for a while with the decline in the real estate
market.
Hope things turn around for you and that you can join the ichimoku class some day soon.
Kind Regards
Chris
Some people use Free Stock Charts and the ichimoku indicator and some use think or swim. These two show two entirely different charts due to the fact that TOS uses the off market info in its mix whereas FSC’s doesn’t. Which do you think is the best to use for short trades? The chart with NO pre/post info included or the one that does?
Thanks
Hello Mike,
I find that more data is better for the charting so if you have off market data, then this will create a more continuous data series and thus a smoother ichimoku
which doesn’t jump around market open.
Hope this helps
Kind Regards
Chris
I watched your Ichimoku webinar on Big Mike’s and I remember you saying that the choice of the number 26 didn’t have anything to do with the Japanese work week. Your description above restates the commonly held belief that it is based on the Japanese work week. Can you clarify please?
Hello Oliver,
Good question. When I wrote this article back in 2007, I didn’t have access to the original or more recent works on it – let alone translated.
But after getting to see these translations, my view has been changed and corrected.
The number 26 came about from his 4.5yrs of research into eastern/western numbers theory. Lets just hope I don’t run into any new translation 🙂
Hope this answers your questions.
Kind Regards,
Chris
Thanks for the reply Chris. My one big problem with studying Ichimoku charts is that the source material isn’t available to me. I’m a big believer of going to the source. I see a lot of traders that are willing to take someone’s interpretation of a method rather than interpret it themselves. Gann is a good example of this – there seems to be many different ideas of how to trade Gann based on various interpretations of the source material (its gibberish to me). Its the same way I feel about Cliff’s Notes versus reading a book. I’m amazed no one has translated Hosoda’s work or at least Sasaki’s Ichimoku Kinko Studies given its popularity in Japan.
This isn’t to say I don’t believe in mentorship to accelerate learning – I do – but I think a student needs to do a lot of his own work. To use a baseball analogy – you might be a great hitter and can help me with my swing – I might even become a great hitter but I’m never going to swing the bat the same way you do and be successful.
You never know, you could end up being a better hitter than me. Why put limitations on yourself?
Often times students surpass their mentors and teachers. That is the real goal of a mentor – to take their students to the next level.
With Gann, I know some fantastic Gann traders! Unbelievably good Gann traders. Sure, maybe Nietzche was right that any translation will never be like the original, but that doesn’t mean people cannot learn it well and trade it well.
As for Ichimoku, the reason why it hasn’t been translated is because the Hosada family has a translation and intellectual property hold on it in Japan and strong legal protection on it.
Luckily I have the original text along with the most recent texts as well and am working with them daily.
If you want to go to the source, unless the family sells any remaining texts (unlikely), or they decide to translate it themselves, your options are limited.
Good luck with your own study. When you’re ready – I’ll be here.
Kind Regards,
Chris
Translated in italian on my blog:
http://www.kikkichimoku.com/blog/2012/7/10/didattica-leggere-le-nuvole-ichimoku.html
hello Chris where can I find the ichimoku indicator? thx!
Hello, Chris, I am nearly clicking on the order for the Ichimoku Course but I realised that my Switzerland broker has six daily candles per week as it is based on the GMT, not NY time. I HOPE it will not prevent me from trading with the Ichimoku Cloud, or will it?
Thank you! Pavel
Hello Pavel,
No issues with the 6 candles based on GMT, that is not an issue as you can trade it with GMT or NY as well.
Hope this helps and look forward to working with you.
Kind Regards,
Chris
hi Chris if youre using mt 4 how can u trade your 3min technique?
Hello Dev,
MT4 has workarounds for this which is discussed in the course. It is a pretty simply solution. I also think MT5 has solved this as well.
Kind Regards,
Chris Capre
Do you conduct a course that deals with Itchimoku exclusively?
Hello Chandra,
Yes, we have a course that is solely focused on Ichimoku which you can find via the link below:
Advanced Ichimoku Course
You can visit the page, and then email me with any questions via the Contact Page
Kind Regards,
Chris Capre
If the trailor is so informative, how brilliant and mindblowing will be the movie.
JUST EXCELLENT.
your article on ichimoku is very informative.request you to also include the indian stock market for your weekly views specially the nifty which is the main tradeable index.
Hello Navin,
Glad you liked the article.
RE: Nifty
Lamentably I don’t have access to this instrument, so cannot do charts/analysis on it.
But may be looking to add it in the future as I like the price action there.
Kind Regards,
Chris Capre
Excellent for the beginners and the case studies are very helpful to understand the kumo.
That is a good article but can not find it on member area 🙁 hope add into member area
Hey Chris,
I really like your teaching style of making things that are as complex as the Ichimoku cloud context trading easy to understand thus making the reader so confident and motivated to actually learn more and master the whole thing.
I have a question.
In the paragraph that’s just above the subtitle “Some Important Final Notes on the Kumo,” you’ve written “…but it should be noted strong trends have developed from weak crosses.”
I’d appreciate if you could explain what exactly you mean by a weak cross. I’d be really grateful if you could back it up through an example.
By the way, the reason why I don’t fully understand how strong trends could develop from weak crosses is because I’m not able to relate that idea to the screenshot where you clearly illustrated and stated how the strong cross above the Kumo produced a large move to the upside.
In advance thank you endlessly for your kind assistance with helping me understand the aforementioned matter.
Best regards,
Bruno
Hi Chris,
You’ve written “If the cross was below the Kumo, then it was considered a ‘weak’ signal since the cross was below the Kumo or below resistance.”
I have a few questions related to the above statement:
1) Are you talking about the bullish cross?
2) Are you referring to the market condition of an uptrend or a downtrend?
3) If I assumed that you’re here talking about an uptrend, could I then freely intepret a ‘weak’ signal as a ‘weak bullish cross’?
4) Based on the above assumption of the existance of an overall ongoing uptrend, could I say that, if the bullish cross happened above the Kumo that’s above the resistance area, we’d be then talking about a ‘strong’ signal or a ‘strong bullish cross’ that indicates a further development of even a stronger or more impulsive uptrend?
5) Could I say that, if the TKx bearish cross happened below the Kumo as a support area in an ongoing downtrend, we’d be then talking about a ‘strong’ signal or a ‘strong bearish cross’ that indicates a much stronger or more impulsive downtrend move since the price has just broken the Kumo or the key support area?
In advance many thanks for your answers that mean the world to me, because I’m really interested to fully grasp the whole subject of the Ichimoku cloud context trading.
Best regards,
Bruno