Pin Bar Trading: How You Can Use it to Find Likely Turning Points
Today I am going to discuss Pin Bar trading, which can give some insight into a potential price action reversal, entering traps, and getting into trends.
In this article, I will specifically talk about how you can use it for aiding your key support and resistance levels to find likely turning points.
I’ll also talk about what a pin bar is communicating from a price action and order flow perspective, and how to trade them.
The term was originally penned by Martin Pring calling it the Pin Bar, which stood for ‘pinocchio bar‘ or a bar that is telling a lie.
Why?
Martin had noticed that these types of bars come up in strong trending moves, but what they do is initially create a break of the highs or lows for the move, but then break back into the range of the prior candle.
This break of the highs or lows is the ‘telling a lie‘ part of it, trying to get short term traders in on the break.
When the candle breaks back into the range, they are then trapped and if the price action continues to break in the opposite direction of the trend, then those traders who are trapped have to exit their longs/shorts, thus helping fuel the reversal.
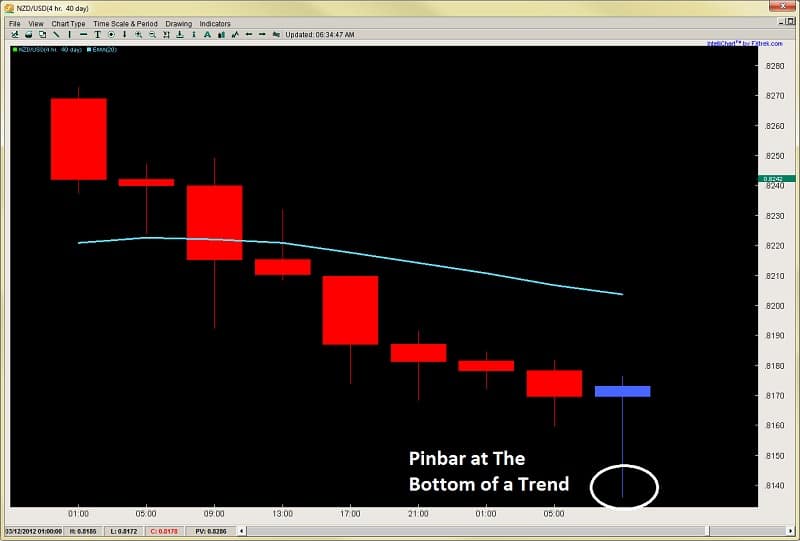
But lets take a look at a general pin bar in the image below.
Looking at the image above, the blue bar at the bottom is a pin bar, which generally should open inside the body (and/or wick) of the prior bar.
The pin bar itself should form a new low in a downtrend, or a new high in an uptrend.
This is what creates the ‘trap‘ for the traders that entered short on the break below the lows. With the bar closing up, the new shorts are now trapped and if price climbs enough, they will have to exit for a loss which will help fuel a price rise and the reversal.
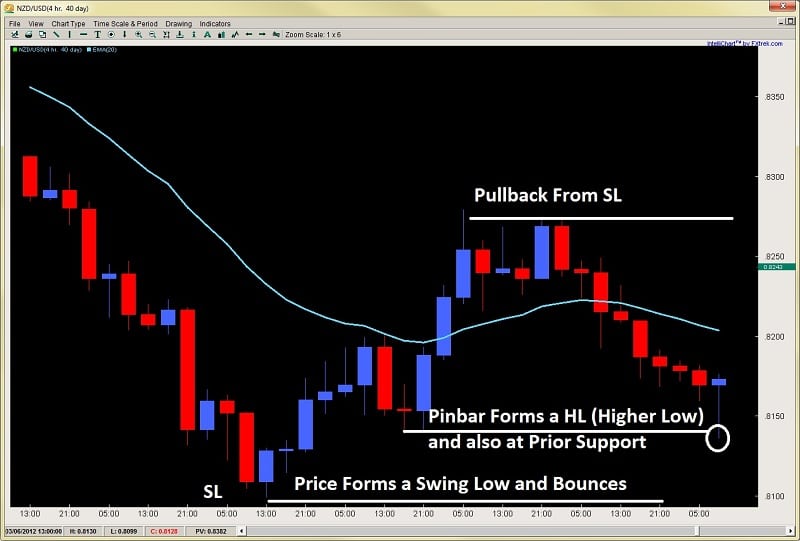
Now lets take a look out a little further at this pin bar in the context of the price action around it with the chart below.
Now that we see the larger picture here, price was selling and then formed a SL at .8100. Price then bounced to .8275 where it ran into resistance and created a pullback from the SL.
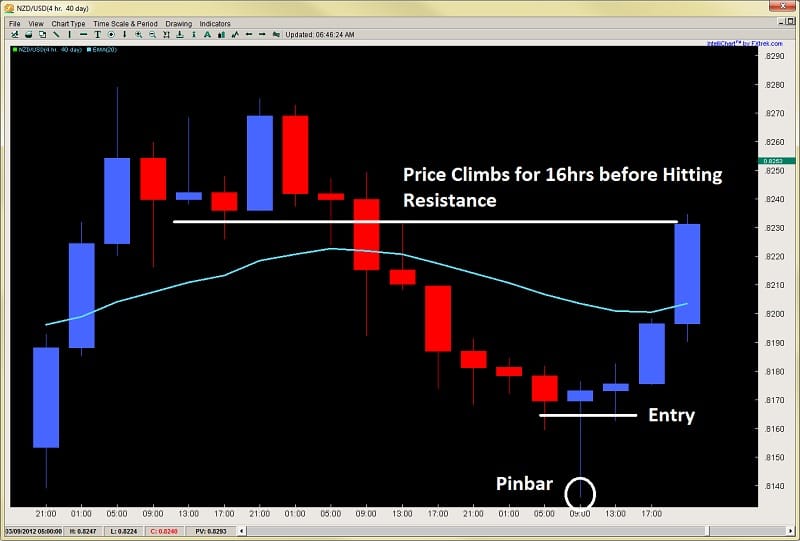
Price then sold off for 8 candles (32hrs) only to run into a pin bar a prior support level, giving us a really good price action trigger to go long and reverse this move. Let’s see how it played out in the following chart.
After selling off for 8 candles and 32hrs straight, price action then formed a pin bar, which was the low in this move reversing 90 of the 130pip sell off (over 61.8% of the move).
We actually blogged about this trade ahead of time and many of our price action traders got long on this one for a nice 3:1 reward-risk setup.
We placed our entry on a small pullback into the pin bar, and targeted .8225. Price went about 10pip past our entry and then encountered a new wave of selling.
But as you can see, the pin bar itself was the key price action trigger in setting up this reversal.
Let’s take a look at another example, then we will talk about finding a good entry for the pin bar along with time frames.
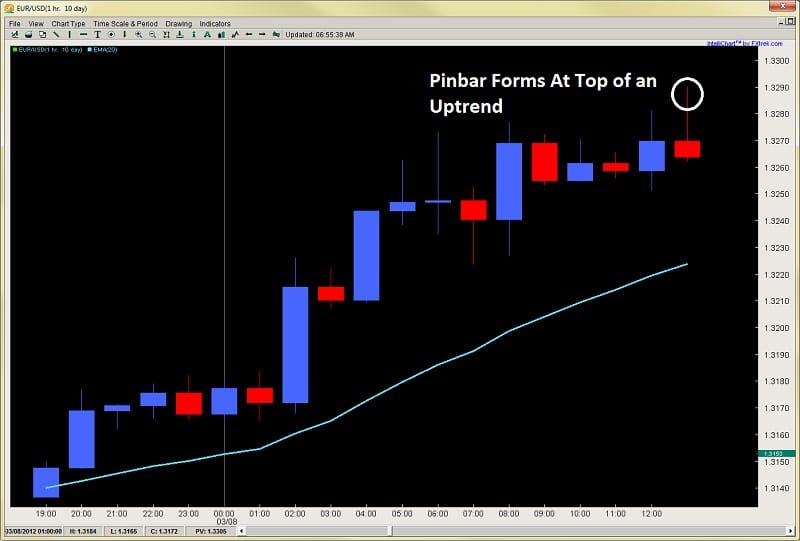
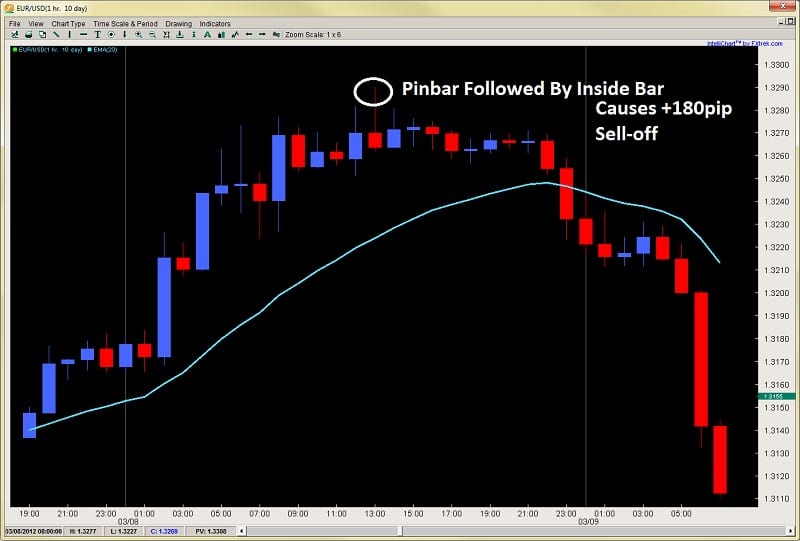
Here is the EURUSD on the 1hr time frame. Price has been climbing for over a day from 1.3140 – 1.3290 and then forms a pin bar at the top of the uptrend.
Notice how in forming this pin bar, price had already been struggling around 1.3270/80 to make any new significant highs. Let’s take a look at how price action responds to this pin bar formation.
Looking at the chart above, notice how after forming the pin bar, price then formed an inside bar right after the pin bar, telling us there was definitely a pause from the pin bar rejection which is interesting since
a) price was already struggling around 1.3270/80 and
b) the bulls had been in control for so long
Where did they go all of a sudden? This should have been a clue the market was about to reverse and the pin bar was the trigger.
Price then traded sideways for a few hours, but then sold off heavily shedding +180pips from the pin bar highs giving a highly profitable trade with very low risk so hopefully this gives you an idea of the pin bar formation as a whole.
Pin Bar Entries
In terms of finding a good entry, one method is to take a pullback into the pin bar itself, but this should always be based upon the order flow around the pin bar and the key levels around it. If the bulls/bears are in control at the time of the pin bar, there is a good chance they will attempt to break the highs/lows of the pin bar so a pullback gives a nice option to get in the market.
There are actually many pin bar entries, and they should depend upon the context of the price action around and leading up to the pin bar itself.
Depending upon how the price action is leading up to it and around it will determine and communicate what is the best entry, but the pullback is one solid option you can use for now.
In my price action trading course, I actually discuss how to quantitatively break down a pin bar as we have tested over 10yrs worth of data on over 15 pairs, totaling over 100,000+ pin bars.
From this information, we were able to come up with a very precise definition of a pinbar, along with giving you exact entry parameters for each type of pin bar, and how to find optimal targets.
One methodology suggested has been to find a 2:1 reward to risk target, or next key support/resistance level. But testing has shown this not to be an optimal method for trading this, as many times price can way under/overshoot the target, either leaving you stopped out before your target, or missing out on a lot of potential profits.
Time Frames
In terms of time frames for trading pin bars, they really can be traded on all time frames from the 1min, to the weekly chart. However, as a pure pattern, testing has shown them to be a lot less accurate on anything lower than a 1hr time frame, so we suggest using them on the 1hr, 4hr and daily time frames if you are only going to trade them as a pure pattern.
We always recommend trading them with price action context, and never just as a pure pattern.
It is not that they cannot be used on the lower time frames, but in isolation, they will be a lot less effective, so you will need to add additional optimizers and parameters to enhance the strength of them.
Also consider on the 1hr, 4hr and daily time frames, more traders will be watching them, and thus get into the trade – likely strengthening the reversal.
Along those lines, think about it this way. If price action forms a pin bar on a 5min chart, we are talking about a rejection that lasted 5mins. Think of how many orders or transactions occurred during that time.
Now compare that to 1hr of price rejecting, 4hrs of price rejecting (half a trading session), or a daily pin bar showing price had rejected for an entire day across three different sessions with three different sets of investors all weighing in saying this price rejection was a significant one.
If you consider that, then it makes more sense the 1hr, 4hr and daily ones will have greater strength to them, but again, it all comes down to context
In Summary
Thus as we can see, the pin bar formation is a strong price action pattern communicating a rejection of sorts in finding tops and bottoms, telling us a counter-trend move is likely to begin.
Obviously this is an over-simplification of a pin bar trading strategy, but we can see how it works and understand it from an order flow perspective.
There are many other variables and types of pin bars, which will enhance or weaken the pin bar, such as body size, close-type, prior price action, was it a trap, was it hitting off key levels, etc. In any case, this should give you a good introduction on what a pin bar is, what it means from an order flow perspective, how it works from an order flow perspective, and one way you can trade it.
There are various other pin bar trading methods which use this so should you want to learn more about then, then feel free to check out my Price Action Course. I teach quantitative methods for pin bar trading and discuss live setups all the time.
Other Related Articles:
Intraday Price Action Trading – Reading Forex Price Action
Pinbar Setup NZD/USD Mar. 9th
EURJPY Pinbar Price Action Forex Setup Mar. 7th

Hi Chris,
A great article. If pin bar as explained in above article is used with ichimoku cloud then it can be a very reliable signal.
On March 22 on daily chart Gold formed a pin bar right at the bottom of kumo.
I wanted to take long position bit due to bearish price structure for last few days I stopped myself from taking the trade.
Next day the price for gold reversed by 53 dollars. Presently it is reaching another resitance at Kijun sen and 20ema another potential sell signal.
In short combining pin bar as explained above with ichimoku can help in trading
Hello Kishore,
Yes, very good observation, that price action strategies can be combined with ichimoku as well. In fact, the very design of ichimoku is meant to work in concert with price action so very observant of you to notice this and start joining them together.
Kind Regards,
Chris
hey chris,
can we trade by use price action without any indicator??
Hello Dikson,
Yes, absolutely. I prefer myself just to have a 20ema, but yes, you can do it completely without it and I teach this.
Kind Regards,
Chris
Your description of the underlying psychology of order flow behind the bar patterns and indicators is enlightening and leads to greater understanding of technical analysis. Probably will join after I finish consuming your introductory material including the insightful archives.
I just looked at the gold 4hr chart(04/15/2013). We had clearly noticed that Pin bar was created.But after then Gold continually follow the bearish trend.So this method can not believe always.
Hello Flashmark,
I think there is a misunderstanding here about pin bars. No method can work always, and not all pin bars are created equal. You have to learn how to read trends to effectively use pin bars. Once you can learn to do this, then you can start to trade pin bars profitably.
Kind Regards,
Chris Capre
hi chris if i found a pin bar at any support/resistance level e.g i want to sell eur/usd at resistance level i found a pinbar those pinbar body is also inside on the previous bar but the pinbar close at bullish colour and i realized that market is also downtrend on this scenario i should go short or not due to candle colour reason?
Hello Arslan,
There is no way for me to answer this without seeing a chart of what you are thinking. I do not just trade every pin bar at a resistance level – there are other rules I follow when trading them which we discuss in our traders forum that you are welcome to join.
Kind Regards,
Chris Capre
Hi Chris. I am new to the Price Action concept. I have been trading for several years using 2 leading indicators and Fib retracements. I read your articles (not all of them as there are numerous of them) and it appears you are very patient and simple in explaining various topics, especially pin bars. Thank you.