Price Action Angles – Trading Forex Price Action
I wanted to write a brief article on a simple method I use to analyze price action – that of drawing trend lines to read the forex price action angles, or the speed of the buying/selling in the market.
I’m going to use an example to highlight how they can be useful for understanding trends, transition phases in trends, and when to look for key price action reversals in the market.
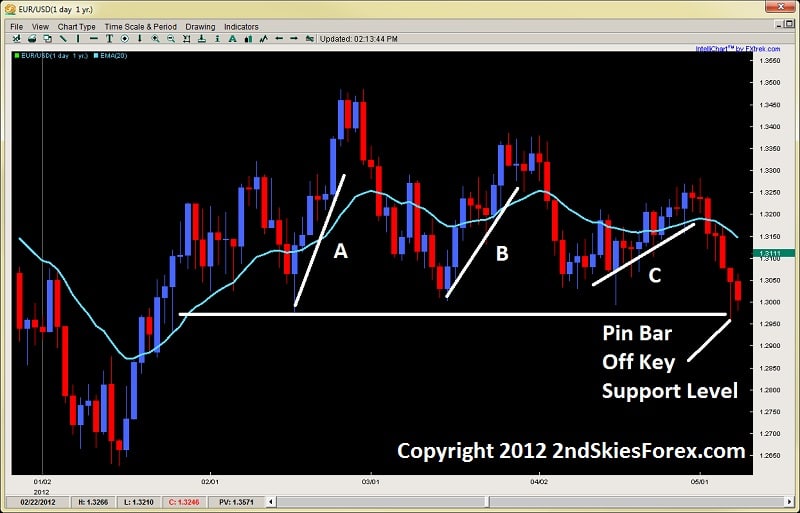
Exhibit A: EUR/USD Daily Chart

Looking at the forex price action trading trendline chart above, the EURUSD started 2012 dipping to 1.2600 before starting an impulsive bull run which climbed almost 900+ pips in a month and a half. Now if you look towards the left side of the chart, you’ll see a pullback to the horizontal line. Price rejected off this line, forming a piercing pattern that climbed 6 out of 7 days and over 500+pips.
This is the move in line A.
After reaching the peak from move A at about 1.3500, price then sold back in 11 days back towards the same support line. Although the low from this sell-off was a tad higher, take a look at the bounce off the level.
Notice how it had 3 bear days in the 8 day move (2 more than in prior move), but only went about 400pips (20% less)?
To me, when I see two rejections off a key level, I’ll draw trend lines on both of them (underneath if they are bull moves, and above if they are bear moves). The reason I do this is to measure the strength or speed of the buying/selling. This is communicated to me by looking at the price action angle of each trend line.
In this case, I have a weakening angle from A-to-B. This communicates a weakening effort by the bulls and that the bears are trying to take control of the market. Keep in mind, this is all happening above a support level, so the bulls still have overall structural control.
When you however look at the last bounce off this noted support line, we can see a massive weakening in the angle. When I see three structural, or price action angles weakening successively, this usually is a sign of an impending breakdown. What is also interesting is the C leg took 12 candles to gain only 250pips (50% less than A-leg, and 38% less than the B-leg). Put these two together, and you should be looking for a breakout to the downside.
What is interesting is how price action formed a pin bar strategy off this key level. If you were just trading pin bars as is, without the ability to read price action in real time, you would have taken the long on this pin bar setup, but then got crushed on the ensuing breakout which is below.
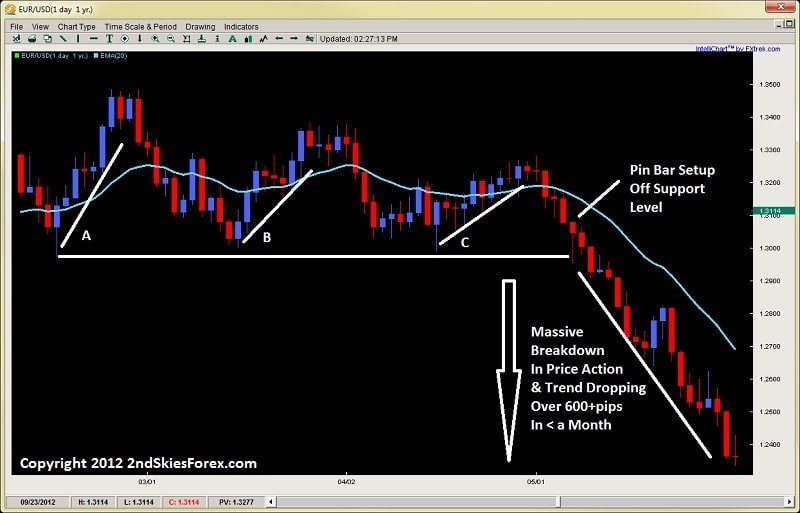
Exhibit B: EUR/USD Price Action Angle Weakening/Trend Change

Working with this chart above, we can see how even though there was a pin bar setup at the horizontal support level, price dropped right through that – stopping out traditional pin bar traders who were not reading the price action in real time, or the change in the angles.
In a flash, the trend was reversed and the pair sold off over 600+pips in less than a month. Had you been reading the price action angles in real time, you would have spotted this potential trend change, and looked to get short instead of longing off the pin bar setup.
This is one way to use forex price action angles to help with your reading and understanding price action.
Another way you can use them is in understanding parabolic or climactic price action moves. These can also be understood via these trend lines and angles. But they are a simple tool which is highly useful in forex trend trading, understanding transition phases in trends, and when to look for possible reversals.
I hope you enjoyed this article and found it a useful addition to your price action trading toolbox.
For those wanting to learn to trade price action, get access to the traders forum, a lifetime membership with free updates and more, visit my forex price action course page.

Dear Chris,
Frankly, I do enjoy your price action articles enormously. The reason is that you provide a very different essence from that of the other authors pa articles. More specifically, the other pa gurus rendered price action strategies to be widely conceived as the hunting of candlestick patterns in the forex charts and the application of arithmetic rules. They merely talk about schematic candlestick patterns and ways to trade them once spotted on a chart. In your case, each and every article of yours teaches the reader on how to read behind the candlesticks, understand how orders flow in the market and, with much-much practice, to actually visualize the market direction every minute.
I consider myself fortunate I am a student of yours and a follower of your wisdom, which you so generously endow to the public.
Kind regards,
Tasos
Chris,
The above timeframe was over several months.
Does the same apply to shorter time frames, like the 4 hour, daily etc?
For a bearish trend to end, we would see the same type of trend line flattening?
John
Hello John,
This applies on any time frame.
This is not a pre-requisite of a trend ending. There are many things that can indicate a trend ending,
many of which you know from the course.
But, this is one tool that is highly informative or indicative when trends are ending.
Hope this helps.
Kind Regards,
Chris
In bigger picture, it also descending triangle. today I leaned new concept from you, finding speed by drawing trend line below/above
chris,i just read one of your article about market context but didn’t get anything from it! what exactly is the market context and how do we trade with it?
Hello Saif,
Can you copy and paste the quote so I can see what specifically you are talking about?
In fact, email me via the Contact Page and I’ll respond there.
Thanks in advance.
Kind Regards,
Chris
Another great article. Thanks you so much for the simple yet in-depth way you teach price action!
Best,
Joseph
This reminds me characteristics of impulsive move I learned from here before. Now I have one more tool–trend angle to evaluate impulsive move.
Thank you, Chris.
Bin
Very good technique coming up with the angles of the price action to measure order flow.
Insightful method indeed.
Thank you Cris for sharing many valuable articles, now i have a better view on how the market works
You are welcome Victor.
There is more I teach about price action context so keep digesting the material.
Kind Regards,
Chris Capre