How To Trade Price Action Trends In Forex – What You’ve Been Missing
Today’s forex strategy article is not going to be your typical ‘how to do trend trading‘ article, where you see the perfect pullback setups, hear about ‘trading from value‘ , or ‘1, 2, 3 reversal patterns‘, or about ‘naturally occurring swing points‘. These “How to Trade Trends” articles paint a one sided picture on how trends work, but really fails to give you the underlying models and mechanics to trade trends profitably.
I’m guessing many of you have tried utilizing trend trading strategies, but either;
- a) got stopped out trading the breakout, or
- b) waited for a pullback that never came as the pair falls 100’s of pips flying to your target & no profits
- c) maybe you got into the trend, only to find it to all of a sudden reverse on you
Has this happened to you before?
I’m guessing it has, so I’m going to share with you what you’ve been missing regarding trend trading, how to understand it, and when to know what strategies to trade and what to avoid.
The Most Critical Point to Know When Trading Trends: Learn to Identify the Type of Trend You Are In
Before you can decide what forex trend trading strategy to use, you have to understand the type of trend you are in. If you don’t understand the trend and price action underlying it, you’ll be looking to ‘trade from value‘ in a pullback when a breakout strategy is what you need to get in and profit.
On the flip side of this, you may be looking to trade a breakout, only to find yourself getting stopped out when you should have been looking for a pullback setup.
How do you avoid this?
Identify the price action and order flow underlying the trend correctly. A simple way to do this is to look at the number of counter trend players in the market, or “level of imbalance“. For example, a trend that is highly “imbalanced“, is either heavily bullish or bearish, and this will reflect in the price action. I like to look at it as either strong participation from the counter-trend players, or very little at all. Two charts below will give you a good idea what the two look like.
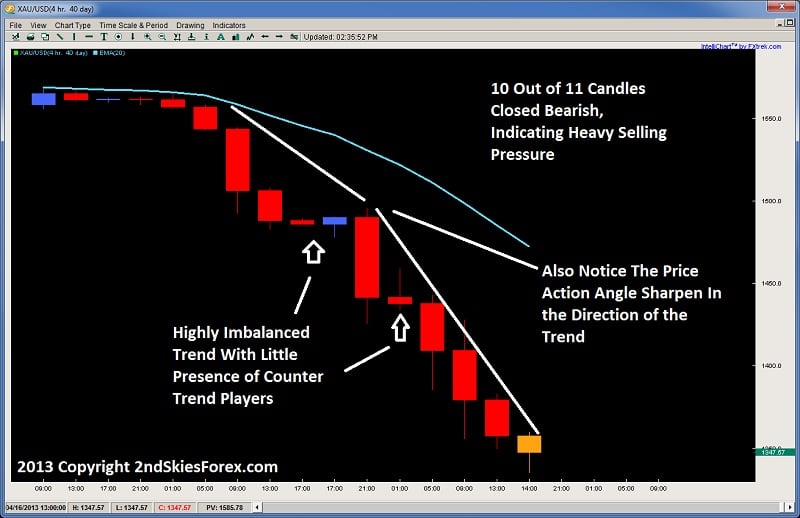
A Highly Imbalanced Trend With Few Counter-Trend Players Gold 4hr Chart

Looking at the chart above, we can see from the consolidation breakdout at the top left, the selling was quite impulsive and highly imbalanced in favor of the bears. 10 out of 11 candles closed bearish, or 40 out of 44hrs. This kind of price action trend shows very little presence of the bulls – so little they can only muster a single 4hr bull candle.
Looking for pullbacks in this type of trend trading will leave you missing the majority of the trend, while watching thousands of pips go by and no profits in your account.
Thus, in these types of trends, you want to be trading breakout strategies which will be highly effective since the momentum and order flow is behind you. Strong trends like these tend to support your breakout trade, and push the price action heavily in your favor.
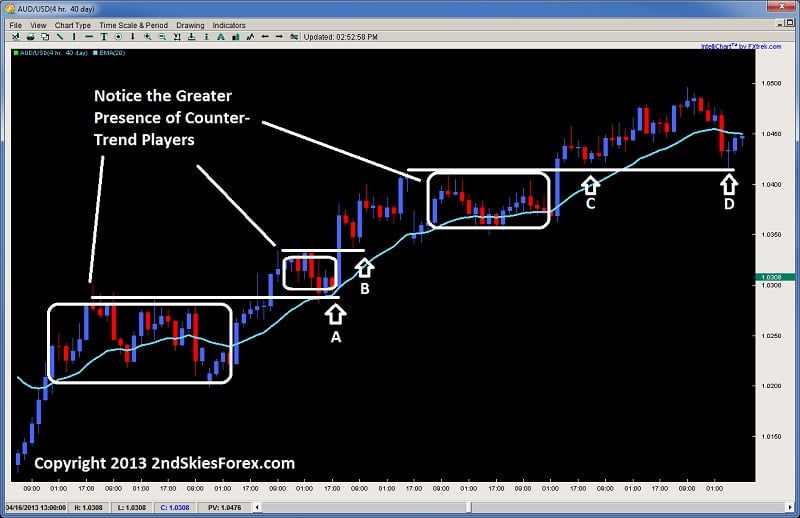
Now take a look at a different example below, using the AUDUSD on the 4hr chart. You will notice in this chart, there is a much greater presence of counter-trend players, thus a less “imbalanced” trend. Although the bulls have control of this trend, there are a fair amount of sellers present as they are able to a) take control of an almost even mix of candles and b) push back much further on the price action.
AUDUSD 4hr Chart with Stronger Counter-Trend Players

During trends like these, breakout strategies will likely fail, and you’ll find yourself getting stopped out, only to find the trend resume shortly after.
Has this happened to any of you before?
It has to me, and I’m guessing you as well.
Along those lines, this would be an ideal order flow and price action trend structure to take a with trend pullback. This is same as trading from a ‘swing point’ or ‘value area’. Here is where this strategy flourishes, usually offering a clear pullback to either
- a) role reversal level,
- b) dynamic support/resistance 20ema, or
- c) a price action signal.
Does this make sense why your trend trades have not worked out before?
Can you see why you missed out on so many trends that kept on running like Forest without you?
Now you know why.
In Summary
Understanding ‘value areas’, ‘1, 2, 3 patterns’, or ‘naturally occurring swing points’ is not going to give you the tools needed to understand how to trade trends in forex, or any market for that matter.
All of those are are “reactive” models – and essentially fail to give you the most important tool – that of understanding why type of trend you are in, and what is the order flow behind it. When you can understand what type of trend you are in, then you can correctly apply the strategy, price action setup, or proper tool trade that trend. Otherwise, you may be using a hammer when you need a saw, and thus either stopped out, or missing most of the trend.
It should be noted, that although trends are ‘relatively’ the same between markets, they are not the same between bullish and bearish moves. Bearish trends as a whole (across all markets) are generally much more impulsive and imbalanced then bullish trends.
Why?
This is mostly due to the emotions behind bull and bear trends
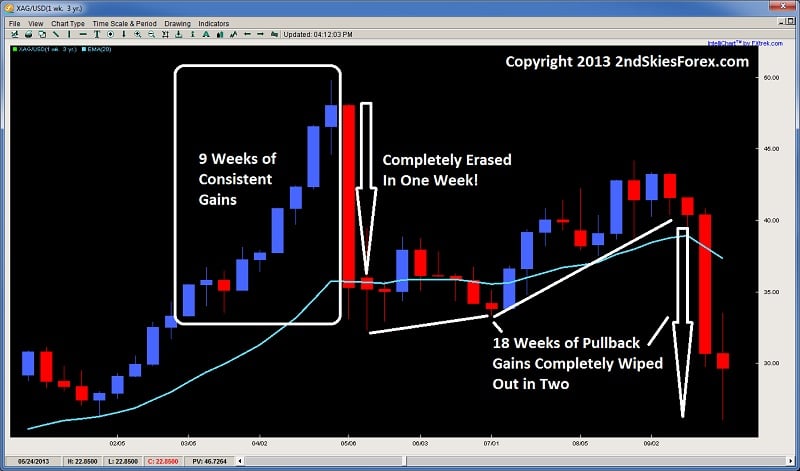
Generally bullish markets are much more euphoric and take more time to form or bottom, while bearish trends are typically characterized by fear, and are much more rapid and forceful. Take a look at any major sell-off on the daily/weekly chart on any pair or instrument, and you will see this clearly in the price action.
There is more to this, such as the order flow behind bear/bull trends, but the volatility, impulsiveness and level of imbalance is usually far greater in bear trends than in bull trends. A great example of this is in the weekly chart below on Gold.
While your at it, look at any weekly chart on the Dow, and major Index, or currency pair, and you will see bull and bear trends are completely different from an order flow perspective.
Another thing to point out is trading pullback setups, or from ‘value areas‘ (also trading from key levels) really only offers you one tool to trade trends, which by itself is very limited. Thus, beware of people painting a rosy picture when it comes to trends, as often times the clear pullbacks to role reversals aren’t there. Yet while you are waiting for one, you are missing out on a highly profitable trend right in front of you.
Thus, learn how to trade and read the order flow behind the price action, so you can understand what type of trend you are in, and what kind of participation is happening from both sides. When you have this information, then decide if you need to use missiles or guns. When you do, you’ll find yourself missing less of the moves, having more winners, and profiting heavily from these great trending plays.


Great Article, Chris!
This applies exactly to my last trade when I expected a reversal and had a breakout. It was because I failed to identify the trend and the order flow behind it correctly.
Thanks for this article. 🙂
Hello Darren,
Yes, when you can correctly apply the tool, you can avoid certain traps, and take advantage of the right opportunity, so glad you liked the article.
Kind Regards,
Chris Capre
Fantastic article. I was thinking reading this…”wow, and this is free!”
It seems that the pullback/range type approach to trading seems to be the more relaxed typed of trading, more conservative I suppose.
Whereas the breakout plays are much more aggressive and impulsive in nature.
These are my thoughts and observations, I could be wrong.
Thank you for posting this; this will certainly force me a good way, to see candles in a different manner.
Hello Gabe,
Yes, this and a lot more for free.
I don’t think either type of strategy is more relaxed or aggressive. Sometimes for people waiting is stressful, and for other people trading breakouts is intense. I think waiting for something that is not coming is silly, and trying to force something that is not there is also silly.
They are just simply tools, and sometimes you need one tool, other times you need the other.
If you learn to relax during either situation, then it’s not stressful and just trading.
Kind Regards,
Chris Capre
Aha!
This, along with the lessons I took yesterday are filling the gaps for me. Thanks Chris
Hello Ferb,
Glad you are liking the lessons.
Kind Regards,
Chris Capre
Which candle on the first chart would you enter?
Hello Tim,
Depends upon which system from the course I was using as there were several that created sell signals in this move.
Kind Regards,
Chris Capre
how can i gain to use your guide. please could you tell me
Hello Iftekhairul,
I’m not sure I fully understand – can you please clarify so I can understand better?
Kind Regards,
Chris Capre
Hello Chris,
Thanks for your articles, it makes me understand more clear why I still miss to trade with the trend. I will need to find out a suitable tool to enter the trade and I will continue reading your useful articles.
Once again, thank you Chirs.
Kind Regards,
Usa
Hi chris great data this is I just came across your site today, willing tp learn and be clea on all that you have to offer also I added you on Skype
Hello Hugo,
Glad you liked this article and material.
When you are ready to take things to the next level, make sure to check out my Price Action Course where models like this in the article are just the beginning.
Kind Regards,
Chris Capre
Hi Chris,
In your above article you have mentioned that first you determine the type of trend and then apply for the strategy.
How many candle analysis you do for which strategy to be used?
In your first analysis you have mentioned 10 out of 11 candles are bullish candle so you will be using break out strategy.But by that time already a major move happend for 10 to 11 candles.If now you are looking for breakout dot you think you late in catching the train?Break out entry should be done much before?
Hello Bedayan,
I don’t have a fixed amount of candles for me to use – its more of an aggregate picture.
But to say not to trade breakouts after 11 candles I think misunderstands trends, which can run for 20, 30 or 40 candles before reversing. If you look at the AUDUSD 4hr chart, you will see its been below the 20ema for over 35 candles, so trading breakouts would have been highly profitable if you employed it in this move.
Kind Regards,
Chris Capre
Very good info that I haven’t seen in some other sites … however it’ll be very helpful to see price action at least 15 candles before the trend develops and your readings on the 20 ema relationship on the first 2 pictures in order to understand the move before that happens.
Thanks Chris
Hello Luis,
Why 15 candles? What is so magic about 15 candles that you could ascertain information which would change or amplify your trading decision? A really good price action trader should be able to see the first screenshot and still make several trades, even without the last 5-8 candles on the chart. This would be even moreso with the second chart on the AU 4hr chart, so curious why you feel the need to see more.
Kind Regards,
Chris Capre
15 candles… no particular reason, I thought your approach may give away some more clues of PA behavior in order to grasp the subject thoroughly to my brain and digest it, that’s all!
On the other hand, your answer tells I don’t need to look further behind to make a trade.
Thanks
Chris
Thanks a lot you are always an help with your article, looking forward to your course
Thank you chris
Hello Jamiu,
Glad I could help and hope you found it informative.
Looking forward to working with you on the course as well.
Kind Regards,
Chris Capre
Another really great article. I’m really beginning to see that understanding order flow and participation from the players in the market is the real key to reading charts. A bit like learning a language the more you practise the more fluent you become. They way you explain it is second to none. Many thanks.
Kind Regards,
Jack
Hello Jack,
Yes, we have to learn to read the PA differently beyond simple price action patterns, trends and key levels. This by itself is not sufficient. This is why we focus on the order flow behind the price action, to understand who’s buying/selling, who’s in control and how to trade it.
So glad you noticed this and are picking it up.
Kind Regards,
Chris Capre
At the risk of jumping the gun I think after 6 months on the course it is all finally beginning to click. For awhile I fell into the trap of thinking I could get away with trading patterns. But now after several runs through the course it all makes sense. The when and why certain methods are applicable. When to ignore a price action pattern and when not to based on the market state. Understanding when a trend is transitioning and what that may mean the next impending move is and therefore what patterns are no longer applicable. It’s quite amazing I’ve been looking at the same charts for 2 years but have not seen them in this way. It’s extremely revitalising. Now I just have to combine a professional mindset with these professional methods and I’ll be well on my way.
Thanks again.
Kind Regards,
Jack
The imbalanced versus balanced description of a trend is how I had been thinking related to a volatile versus non-volatile trend. Are these basically synonymous?
Had never seen a forex trading article about trend trading like this. All others were vanilla,basic crap. this totally puts it into a different perspective
will definitely look to be joining your course this week
luke
hello Chris Capre,
What a wonderful and informative article. You have just changed many many things of my trading. After reading this article, I understood why I was missing most of signals. This article has opened a lot of things for me. Basically you explained about 2 types of trends. Now I understand when to take breakout strategy and when not. It would be great help to noobs like me if you write something for Ranging Market.
With best regards
Babul Akhtar
Bangladesh
Hi Chris,great article, sincere thanks to invaluable piece of information, regards LG
Hello LG,
Glad you liked it and found it useful.
Kind Regards,
Chris Capre
Brilliant!! Thank you Chris, I’m an absolute newbie & I’m finding all the information you post extremely helpful, I’m so so grateful you share this for free. I have made a good few mistakes in regards to this plus joining Bancdebinary which only do put or call & limited trading assets & time & don’t really offer much else. However I’m learning from you & will hopefully be able to join the trading view one as soon as i can get out. Thank you again big thumbs up.
Hello Gina,
Am glad you found this post helpful as it highlights some crucial aspects to reading price action trends.
Hope to be working with you soon.
I’m new to trading Forex and I find your discussions on order flow and the market action amazingly insightful. They provide an explanation for why things happen and why reliance on rote technical analysis is not enough to be a successful trader. No one else is providing this type of deep analysis about markets, price action and trends. After reading this article, I reviewed a monthly chart regarding the differences between bull/bear markets and you were spot on!
Hello Tom,
Yes most people talking about ‘price action’ are using carbon copy/cut and paste rote methods which fail to really understand price action and order flow. They also miss the point of what price action is about.
So I’m glad you are noticing how we take a completely different approach to reading and trading price action in real time.
Me too. I’m hoping to join the course soon.