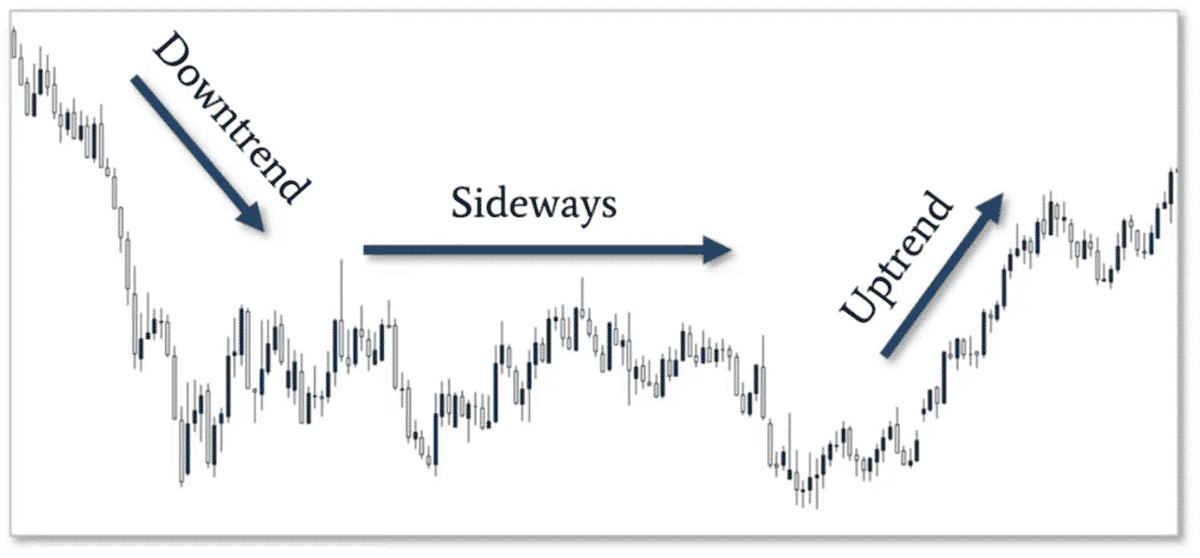
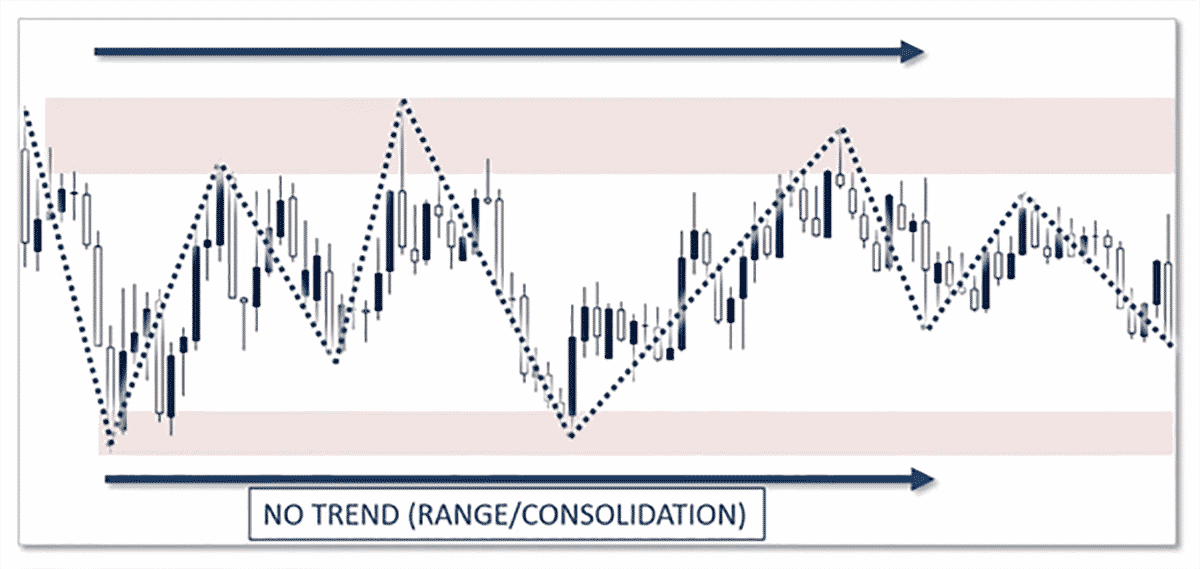
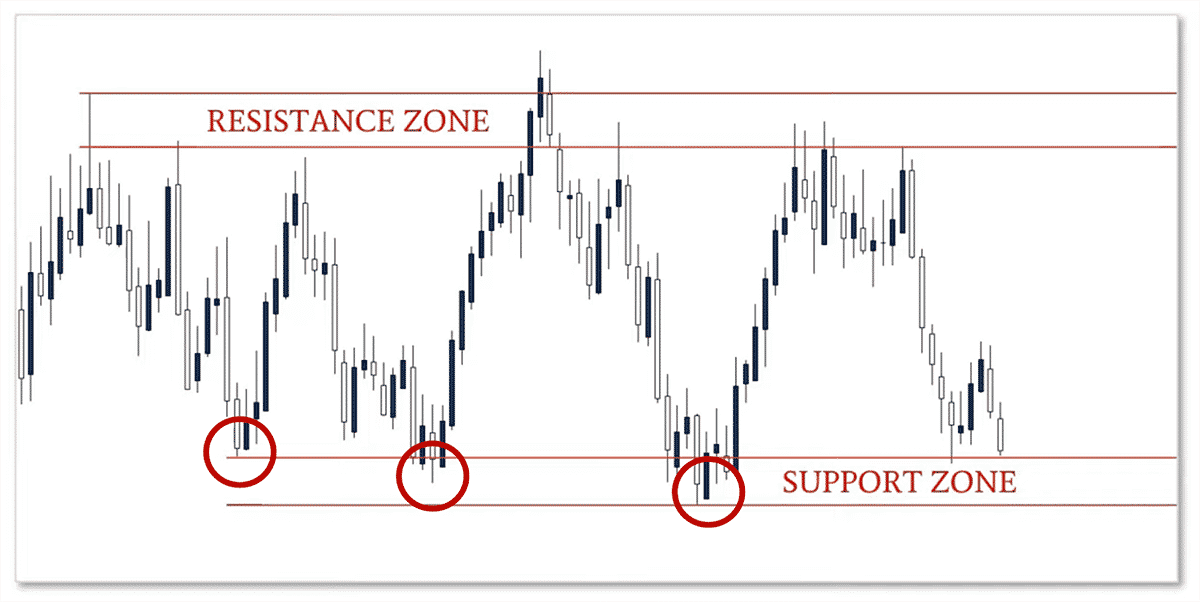
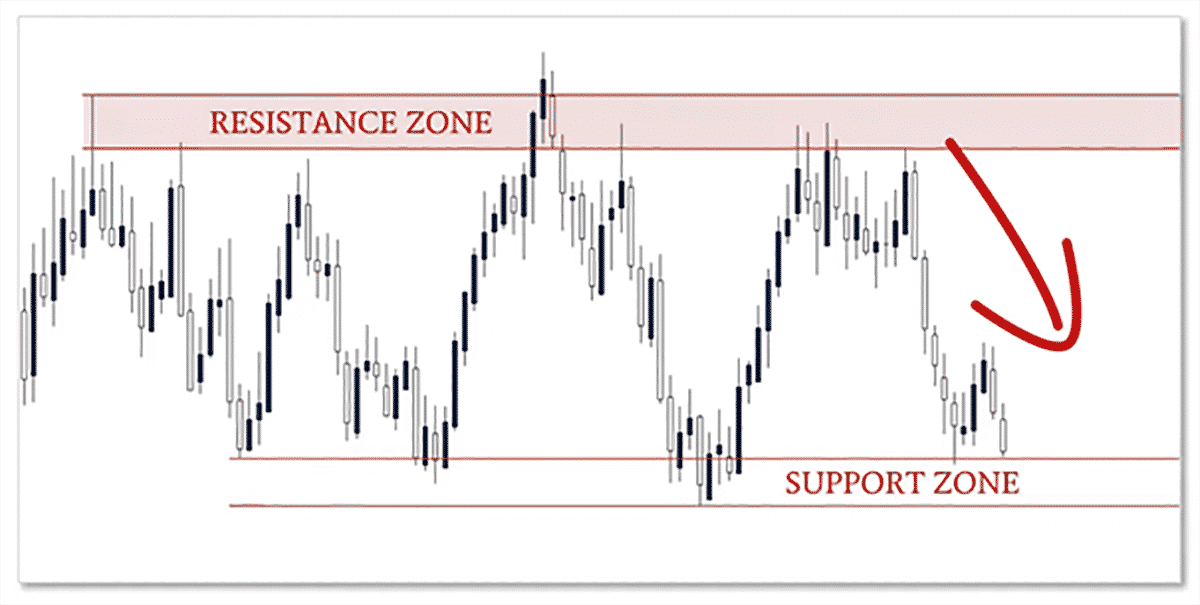
There are two ways to make money: you making money (through your daily job/work) or money making money. Investing is having your money make money for you, and is the only way to make money 24/7 while you sleep.

The goal of investing money is simple – to increase your financial resources and compound them over time so you can live off your investments, not your daily work (unless you want to).

Whether you’re a first-time investor, or have some experience, we’re here to help you begin the process having your money make money for you.

It’s important to note you don’t just want to throw your money into any security that will give you a return. You must consider a few key staples of investing your money, and how to do it to maximize your financial efforts. Below we are going to share a few methods for investing your money into the financial markets (in no particular order).

  1. Stocks – investing your money into stocks allows you to own a small portion of that company and the potential value it can build over time. When you invest in a stock, the goal is to capture a large portion of the value they create over time as it takes time to create massive amounts of value in any company.When the stock of a company you invest in gains market share, capitalization and value, you profit with them.
    Examples of individual stocks you can buy are Apple (NASDAQ: AAPL) and Amazon (NASDAQ: AMZN)
  2. Index Funds – sometimes its better to invest in an index fund that tracks a market and large numbers of stocks. It’s a way to instantly diversify by investing in the index fund, and thus have investment holdings into lots of stocks.
    The goal of investing in index funds is to a) diversify and b) balance the risk of your portfolio so you’re not solely invested in individual stock companies.Examples of index funds are the S&P 500, the Nasdaq and the Russel 2000.
  3. ETF’s – these are exchange traded funds that come in active and passive forms. Passive ETF’s track stock indexes like the Nasdaq and try to match the performance of the Nasdaq. Meanwhile active ETF’s have portfolio managers that choose which stocks to invest in with the goal of beating the market.Generally, most ETF’s pay dividends which is a way to earn a second income on your invested capital.Examples of ETF’s are TLT (NASDAQ: TLT) and IWM (CBOE: IWM).

How to Invest

How to Invest Your Money

While we are not financial advisors and suggest you seek out a certified financial advisor, from our two decades experience in the financial markets, we’ve found there are a few variables you should consider in terms of where and how to invest your money. 

Some examples are:

  1. Your Age – younger people generally are able to take more risk on early as they have more time to save while older people generally want to protect the capital they have focusing on that first before capital appreciation.Hence a general rule is if you are in your 20’s-30’s, have some decent risk invested, if you are in your 40’s-50’s, less risk while focusing on stable growth, and for those 60’s and above, capital preservation should be your primary focus.
  2. Your Debt Profile – generally, we do not recommend investing if you have bad debt (i.e. debt that has a 10% interest rate or higher). If you do, we recommend clearing your bad debt first before investing.For those of you that have very little bad debt, and mostly good debt (debt that yields a return, like a mortgage), then we recommend putting aside some capital for investing.Hence understanding how much debt and what kinds of debt you have is a factor to consider.
  3. Your Budget – if at the end of each month, you have virtually no savings, we do not recommend putting money aside to invest. We’d recommend putting aside several months of savings before investing.If, however you have several months of savings, then we’d suggest putting money aside for investing.
  4. Your Goals – what your investing goals are will have an impact upon what you invest in and how. Are you putting money away for retirement, trying to invest for your kids college tuition, or wanting to grow your net worth either through stocks or some physical assets (like real estate)?Whatever your goals are will determine what you should invest in, and how.

Passive vs Active Investing (which is better)?

Generally investing is divided into two categories, active and passive. 

Active investing consistently analyzing and evaluating your investments that you build and maintain on your own. Generally this requires you to have the time to do so, the knowledge to do so, the skills to do so, and the interest to do so. If you are missing any of the list above, we recommend making sure you continually work on all four variables above to actively invest on your own.

Passive investing is either having someone else do the work for you, or just throwing in your money into a few investments, then adding to them periodically over time.

It’s like hitting the cruise control on the highway, without any steering. It requires less time, less knowledge, less skills and less interest. 

It should be noted the wealthiest investors have generally been in the active investing camp, choosing where to put their money, when, and how. This is harder to do, but the potential upsides could be far greater. 

Meanwhile passive investing is a low-key project and can compound wealth over time, but you may certainly miss certain trends short and medium term. Very rarely does a top 100 investor in the world do so through passive investing.

You’ll have to decide which of these approaches is better for you.

Final Thoughts

Investing in the financial markets is a skill we recommend everyone should build over time. Sadly, most educational programs globally do not teach financial literacy or how to invest your money. 

Yet learning to do so gives you the potential to build multiple streams of income outside of your normal 9-5 job. Hence its important to at least learn some of the skills needed to invest your money based upon your time available, interest, age and goals.

Investing in the stock market takes several steps to achieve your investment goals and financial needs. We’re going to give you a step-by-step beginners guide on how to invest in the stock market.

Below is our list of what steps you need to take to invest your money in the stock market the right way.

1 – Do you want to be an active investor or passive investor?

As we’ve mentioned in our how to invest guide, generally stock investing is divided into two categories or methodologies. They are

  1. Active investing
  2. Passive investing

As the name suggests, passive investing is where you either have someone else do the work for you (in terms of what to invest) like a financial advisor/planner, or you passively put your money into a few stock indexes, then let the money grow over time with the stock market indices, choosing fixed times to add money into your investment account.

It’s a very hands-off approach where you passively invest without much decision making.

For those of you with very little time or interest in learning about the stock market, we suggest this approach and that you should consult your financial advisor.

On the other hand, active investing is where you actively choose which stocks to invest in, when and for how long. 

It’s important to understand this does take more time, along with building your knowledge of the stock market and skills required to do so.

I would like to note the wealthiest investors are not passive investors, but active investors. If you like building new financial skills, don’t mind doing a little research on your time off, and would like to invest in specific companies, then we recommend active investing

2 – What are your investing goals?

What your specific investing goals are will greatly determine how you should invest in the stock market.

Are you a millennial that has at least 30-40 years before retirement? If so, you can probably take on more risk than someone in their 60’s or 70’s. 

Are you wanting a lower risk investment approach so you can steadily build your income with lesser risk to your investment funds? If so, you’ll want to invest in stocks that have lower price volatility, and ideally a strong market share + low competition so they can retain their stock value.

Hence, your investment goals will determine what stocks or stock indexes you invest in, thus it’s important to have a clear goal in terms of what your reason for investing in the stock market is, how much time you have till retirement, and how much risk you are willing to tolerate.

How To Invest In Stocks

3 – What to invest in?

There are generally two major protocols for investing in the stock market. They are:

  1. Index funds
  2. Individual stocks

Index funds track major stock indices like the NASDAQ and S&P 500. An index funds are designed to match the long-term performance of the index they are trying to track. 

For the Nasdaq, it’s the QQQ, and for the S&P 500, is the SPY. Both index funds offer a dividend and have low costs in terms of fees.

It should be noted the S&P 500 historically has produced about a 10% annual return which is a fantastic way to build your investment portfolio over time, hence why it’s such a sought after index to be invested in.

Individual stocks are another protocol for investing in the stock market. 

Do you believe Apple (Nasdaq: AAPL) will remain a dominant player in the computing/phone/wearable device industry for years to come? You can buy a piece of that company by buying shares, thus profiting if they grow in value over time.

Do you think Amazon (Nasdaq: AMZN) will for years to come be the dominant player in the retail e-commerce space? Again, you can buy individual shares of Amazon and partake in the stocks increase in value over time.

Investing in individual stocks allows you more nuance in what you want to invest in, when you want to invest in, and how much to invest in them. Again, this takes a bit more time as you are ‘actively’ deciding which stocks to invest in. But if you feel you can learn the skills of investing in stocks, and think specific companies will do well over time, you will want to consider investing in individual stocks.

Regardless of whether you are in the active or passive investing camp, we recommend having investments in both individual stocks and index funds. 

4 – How much to invest into the stock market?

When it comes to how much money you may want to consider investing in the stock market, we only recommend investing money which meets the following requirements:

  1. It’s not needed to pay off bad debt (i.e. any debt with a 10% interest rate or higher), and
  2. You won’t need this money in the next three to five years.

If you have funds available that meet the above criteria, then we recommend at least investing some of those funds into the stock market.

It’s important to note the stock market has a directional bias of going up over time. If you look at the prices of the US stock markets over years, you’ll see they have a natural incentive to go up because the goal of a company is to increase its value over time.

It’s also important to note the stock market can and often does lose 20+% of its value (what we call a bear market) over time. This has occurred over five times in the last twenty years, so it’s something that’s not uncommon, and to be expected. Thus, it’s important you understand the risks of investing in the stock market.

Now as to how much should you invest with your investable funds, we recommend the rule of 110. This simple rule states that you take your age and subtract it from the number 110. Whatever that number is, that is the % of your investable funds you should put at risk into stocks and index funds. The remainder we suggest putting into fixed-income investments like higher grade bonds (AA or AAA rated). 

So now you know how much to invest in the stock market with your investable funds.

5 – Open an investment account

Once you’ve decided upon your investment goals, how you want to invest (active vs passive) and how much to invest, its time to open a brokerage account. This is simply an account that allows you to buy stocks and index funds.

There are many companies which offer brokerage accounts, and its possible your bank offers this as well.

For those who are more active investors, especially those with (or looking to build their investing skills), we recommend TD Ameritrade.

For those who are more passive investors, we recommend Public or Robinhood as they offer easy mobile apps which allow you to open the account via your phone and can be done so within a matter of minutes.

Generally opening a brokerage account is pretty easy, but it’s important to consider what type of investor you will be, and what account you may need to invest your funds.

For those just looking to invest funds from your normal bank account, you’ll want to choose a standard brokerage account. This will give you easy access to your funds and allow you more flexibility.

For those of you wanting to invest from your IRA account, note you’ll have limitations as to how much and will have less access to your funds. 

It’s important to note the costs and fees associated with stock investing so make sure you understand the fees and commissions for buying and selling stocks and index funds with your chosen broker.

We always recommend your broker have the following qualities:

  1. Be regulated (by your regulating agency in your country)
  2. Have customer support you can contact via phone
  3. Has a user-friendly app or software that allows you to easily make decisions about how to buy and sell stocks or stock indices.

6 – Choosing your stocks

Now that you’ve gotten your brokerage account all setup, it’s time to choose which stocks to invest in. Below are several points to consider which stocks to invest in:

  • Invest only in stocks where you understand their business
  • Avoid stocks that have high volatility (i.e. massive changes in their stock price) in the beginning
  • Avoid penny stocks (most penny stock companies go broke and lose value over time)
  • Learn the basics of how to evaluate stocks (through both fundamental and technical analysis)
  • Diversify your holdings to mitigate risk

Based on the above key points, here are a few things to consider or avoid doing:

  • Avoid meme stocks as they have high volatility and rarely will accumulate value over time
  • Invest in companies you understand their product, market position and future developments
  • Invest in a base of stocks that will have lesser price volatility, but stable growth over time
  • Choose a few stocks that have strong dividends (4% and above) with lower price volatility
  • Invest in a few index funds to provide lesser risk and greater stability over time
  • Always pick a few stocks that focus on growth so you can capture more upside in your portfolio.

7 – Keep Investing

Virtually every successful investor in the last 50 years didn’t just put money in the stock market one time. They all kept investing and adding to their portfolios over time. We recommend the same approach, and often suggest simplifying this process by choosing a small amount you can put aside each month towards your investment portfolio. 

As we’ve said before, the stock markets have a directional bias of going up, thus by continually investing your money over long periods of time, you increase your probabilities of maximizing your returns and increasing your wealth.

In Closing

Investing in the stock market is a potential method for increasing your financial wealth over time. It’s important to understand there are risks and to never risk more than you can afford to lose.

But for those who are prudent with risk and invest their funds well, you can produce additional returns on your capital over time while building your financial means to buy a new home, pay for college, or fund your retirement.

Whatever your goals are, we recommend following the step by step guide above for investing in the stock market to improve your chances of success.

In our article on how to invest in stocks, we talked about investing in individual stocks and also investing in index funds. Index funds are simply a fund that tracks a market index by investing in the individual components of that index. Index funds are managed by fund managers whose job is to make sure the index fund performs the same as the index itself.

Below we are going to share with you some simple steps for investing in index funds to help you with your investment process.

Understand the various index funds

While there are hundreds of index funds, we’d like to share a few index funds in terms of what they invest in and how you can diversify your exposure. Examples are:

  • SPY which tracks the S&P 500
  • QQQ which tracks the Nasdaq composite
  • IWM which tracks the Russel 2000 index
  • EEM which tracks emerging markets
  • TLT which focuses on the 20+ year treasury bonds in the US
  • FEZ which tracks the Euro Stoxx 50 Index

Now keep in mind, these are broadly focused index funds. If you believe certain sectors of the market will do well for years to come (perhaps semiconductors, or residential real estate), you can invest in index funds which track those sectors.

We recommend having a mix of exposure to US indexes, some overseas indexes, and a few sectors you think will be strong for years to come.

It’s important to look at the long-term charts of those indices you are interested in so you can see their price volatility. This will give you an idea of what kind of volatility you can expect by looking back in history (20+ years) to see what kinds of drawdowns to expect and how to manage your risk based on this.

We recommend looking at the weekly or monthly charts (i.e. each candle represents a week or month of price movement) to help you see the long term trends, drawdowns and volatility.

How to Invest in Index Funds

Choose funds based upon costs, limitations and tracking performance

There are often several different funds you can invest in for each index you want to track. Each index fund will have varying performance fees, slight variations in how accurately they track the index, and some may have limitations in terms of when you can buy and sell.

The key is to find the funds that:

  • most accurately track the index
  • have the lowest fees (management fees)
  • have the least restrictions (if any) in terms of when you can buy and sell

Buy shares of the index fund through your brokerage account

Once you’ve selected the funds you want to invest in, make sure your brokerage account has those funds available to buy and sell shares from.

Once you’ve confirmed they do, it’s time to buy shares in each individual fund. We generally recommend buying several funds at a time so you can easily be diversified from the moment you start buying shares across many index funds.

Again, depending upon your investment goals will determine how much you should have in index funds vs individual stocks.

Why invest in index funds?

As we’ve mentioned in our prior article on how to invest in stocks, index funds have several benefits for investors, such as:

  • Diversifying risk – since an index fund invests in dozens, if not hundreds of stocks, no one stock will make or break your returns, and should any one fall, you still have others to maintain strength for the fund.
  • Less time – individual stocks take a bit more research to understand their nuances, potential challenges and future risks. Index funds are managed by fund managers whose main job is to perform consistently over time.
  • Less expensive vs mutual funds – unlike actively managed mutual funds, index funds are less expensive in terms of management fees, thus you pay less over time to get exposure to index funds.
  • Greater stability – unlike individual stocks which can lose a lot of value from something as simple as the CEO stepping down, index funds generally have lesser volatility to them and thus smaller drawdowns than many individual stocks may have.

Index funds to consider starting with

For those of you who are new to investing long term, here are a few funds to consider investing in long-term offering a range of stability, fixed income and some speculative risk.

  • SPDR ETF TRUST (SPY) which tracks the S&P 500. Has averaged about a 10% return annually over the last 50 years
  • Invesco QQQ Trust (Nasdaq: QQQ) which tracks the Nasdaq index, thus giving you exposure to some of the top tech companies in the world.
  • PIMCO Income Strategy Fund II (NYSE: PFN) which is a strong dividend producing fund (8.44%) that invest in a wide variety of local and nationally represented stocks and entities.
  • iShares MSCI Switzerland ETF (CBOE: EWL) which gives you exposure to one of the more stable economies in the world and their major corporate holdings.

Using index funds to build your wealth

For those learning to invest in the stock market and build your investment portfolio, index funds give you access to a wide range of stocks and risk profiles while simplifying the process. For those of you wanting to grow your wealth over time without having much time to do the research, you should consider index funds for providing one solution to your financial and investing goals.

Day trading can be a highly lucrative form of trading because of the sheer volume of trades you are taking. Very much like the online poker player, who plays as many tables as possible to maximize their edge and profit, day trading works under the same vein.

Trade a lot more for smaller profits, and they all add up.

Now there may be people who claim “day trading doesn’t work” and “you won’t make money day trading”, but these statements are completely inaccurate.

Case in point, Stefano Serafini, who won the 2017 World Cup of Futures Trading with an impressive 217% return, is a day trader! Many people in this contest who placed very high, were also day traders.

Hence, it’s important to forget the falsely imported narratives about how day trading doesn’t work. There are a lot of people who make a lot of money day trading. The key is whether you can make it work.

How Do We Define Day Trading?

Before we dig deeper into the world of day-trading, let’s start by defining what day trading is and is not.

Day trading refers to the buying and selling of an instrument/security within a single trading day or session depending on the type of market you’re trading. Day traders close out all of their positions at the end of the day/session.

Day trading is common across many markets, such as forex, futures, commodities, stocks and global indices.

There are professional day traders, trading for large financial institutions and there are individual day traders trading their own money, or managed funds from investors and clients.

Now that we have a basic definition of day trading, let’s have a look at the pros and cons of day trading.

Day Trading Advantages vs. Challenges

Day trading offers advantages compared to trading on the higher time frames, but those advantages also come at the cost of added challenges which you have to be aware of.

One of the major advantages with trading on the lower time frames is the increased trade frequency because markets are moving faster and presenting more structures on lower time frames than higher ones.

If you’ve already established you have a trading edge, then like a casino, you want to execute that edge as many times as possible.

Another benefit to day trading is you eliminate your overnight risk – a risk that major events can happen (while you are sleeping) which may affect your trades.

By day trading, you are closing all your positions before the end of each day/session. This mitigates your ‘event risk’ by not having a position open long enough to be exposed to such risk.

On the other hand, day trading has its challenges. Trading intraday means faster price movements, which means you have to make your trading decisions much faster, while increasing your cognitive load (CL).

We will talk about trade frequency, cognitive load and transaction cost in more detail later. For now, just be aware day trading has its advantages and challenges, both of which you need to be fully aware of.

Is Day Trading Something For You?

First off, if you’re completely new to trading, I’d suggest not day trading in the beginning until you have learned the core skills of trading price action context, so much so that they are wired into your brain.

Why do I recommend this?

Day trading requires you to put all the focus and attention you can muster into reading price action context in real time. When the markets are moving fast, you can’t afford to spend more time than absolutely necessary on basic skills such as position sizing, order execution, etc. They have to be automatic and wired in so you can keep your mind free to find the best trades on the quick.

Hence, it’s important to ask yourself, are you someone who likes to take time to analyze charts, re-think scenarios multiple times before making a decision or easily get stressed?

Are you someone who has a full time job and only 1-2 hours available to trade each day?

If your answer to one of these questions (or both) is yes, you’d likely want to re-consider if day-trading is something for you.

However, are you someone who can make a decision very quickly and act on it?

Do you have several uninterrupted hours to find trades at your computer?

If you answered yes to the above two questions, then you might want to take a serious look at day trading.

The key point here is to understand yourself and how you naturally think/act.

If you can do that, you can align your trading as much as possible with your personality and lifestyle, which is one of the most important factors to determining your success in trading.

Day Trading Time Frames

Generally, the time frames for day trading you want to use are the 1H, M30, M15, M5, M3 and M1 charts. Any time frame above 1H won’t likely be of any use for a day trader since any significant moves on those time frames take longer than a session or a day to play out.

If you hear someone say “One-minute or five-minute charts are just noise” don’t take advice from that person. Time frames just give you a different perspective into the markets and price action.

Shorter time frame charts reveal more detail, but less historical context, while longer-term charts show less detail, but greater historical context.

One of the most important ways to look at time frames is to see them as ‘lenses’ into the price action and information on the chart.

This is clearly demonstrated by the three images below.

How to Day Trade 0

After looking at the above 3 shots, what do you see?

Starting on the left, we have the wide lens (18mm) which shows this shore/side of the lake, trees on both sides, and a couple peaks near the top left. In the middle, we have a 55m wide lens which only shows the shore on the other side of the lake. It also shows a 3rd peak which is more easily seen to the upper right.

On the right side, we don’t see any lake, only one major peak, with a well-defined white strip of snow and lattice structure on the mountain.

3 lenses, same piece of land.

Now let me ask you this question: Which one is ‘right’? Which one is the ‘most accurate‘? The answer is neither, or better yet, ‘whichever is most important to what you’re trying to see.’

And that is how you need to think of price action on the lower time frames. Each time frame is its own ‘lens‘ (perspective) about the price action and order flow. Hence each time frame has its own trend.

The key is to pay attention to the time frames most relevant to how you’ll trade.

Expectancy vs. Frequency

As we’ve talked about before, day trading takes advantage of the premise that volume of trades (over smaller profits) is your trading edge (how you make your money).

This section will be dedicated to understanding what is a trading edge, trade frequency, expectancy, and how this ties into your performance and profitability.

It’s very easy with all the literature out there, to look at risk in a very two-dimensional perspective of accuracy and risk to reward, but there’s a lot more to your profits and performance than just risk to reward + accuracy. You have to look at your performance 3-dimensionally!

The bottom line is that our profits and performance are determined by 3 things:

  1. Accuracy (% winners/losers)
  2. Avg +R per trade
  3. Trade Frequency

All of the above create your trading edge and ‘expectancy’, which is what we can expect to make over time through hundreds and hundreds of trades.

Hence, it’s critical to understand how these 3 relate to each other, particularly in relationship to day trading.

To get an idea of how these numbers all affect your performance and edge, let’s take System A with 60% accuracy, trading 5x a month, risking $100 and targeting $200, assuming a 1% risk per trade.

Below is how the math works out:

5 trades over 12 months = 60 trades per year
60 trades x 60% accuracy = 36 winners/24 losers
36 winners at +$2,000/trade = $7,200 profit
24 losers at -$1,000/trade = $2,400 loss

Total Profit = +48% profit/+$4,800

Now, let’s take System B, which is the same as System A, but lets reduce the accuracy by 10% (assuming you will be less accurate trading the same system on a lower time frame) while increasing trade frequency.

Trading 20 times a month (~5x per week), risking $100/trade and targeting $200/trade.

Below is how the math plays out:

20 trades a month = 240 trades per year
240 trades at 50% accuracy = 120 winners/120 losers
120 winners at +$200/trade = +$24,000 profit
120 losers at -$100/trade = -$12,000 loss

Total Profit = +120% Profit/+$12,000

Comparing the two systems, the day trader made an impressive +120% profit vs +48% for the swing trader. Same system, same risk to reward ratio, yet more profit for the day trader.

Even if I make System A 70% accurate (a very low probability), here is how the math plays out risking the same 1% per trade:

5 trades over 12 months = 60 trades per year
60 trades at 70% accuracy = 42 winners/18 losers
42 winners at +$200/trade = +$8,400 profit
18 losers at -$100/trade = -$1,800 loss

Total Profit = +66% Profit/+$6,600

As you can see, even being 20% more accurate (highly unlikely), the day trader still makes more profit than the swing trader.

The bottom line is, if you have an edge, the more times you can apply it with a relative level of accuracy, the more the edge will play out in your favor. And that leads to more profits!

The prior examples are of course overly simplistic, but in our Trading Masterclass, we teach you how to calculate trade expectancy based on your current performance, and how you can improve your performance by improving your expectancy and trade frequency.

Day Trading & Price Action Context

Regardless if you’re swing trading or day trading, you want to make sure that you’re trading in line with the most dominant order flow as this helps to put the probabilities in the favor of your chosen trading direction.

Therefore you’d want to work with at least one higher time frame (HTF) to establish the price action context + trading direction, together with one lower time frame (LTF) which will be your trading time frame on which you make your trading decisions and place your trades.

To give you an idea what this looks like, let’s have a look at some charts.

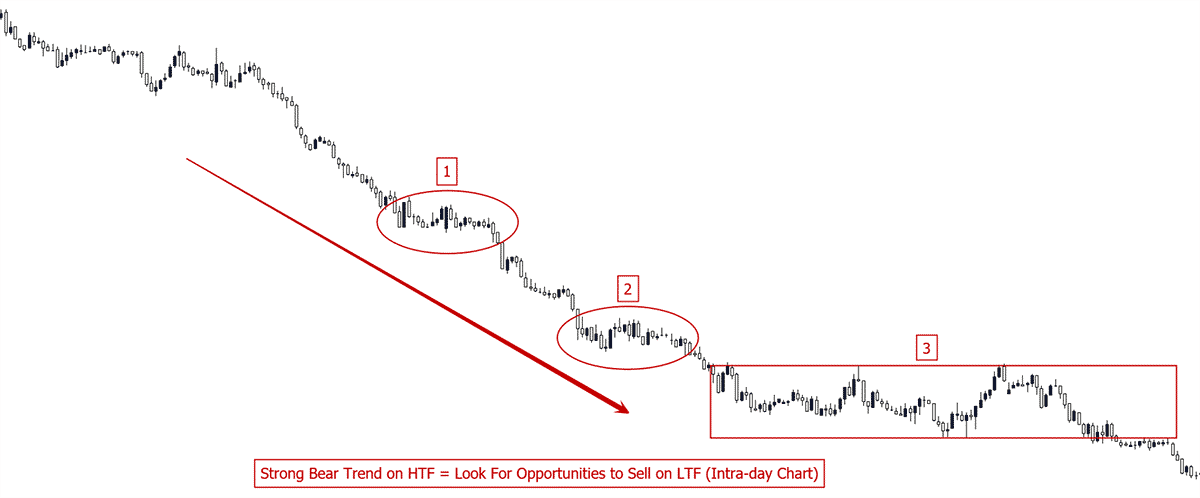
Below is a 1 hour chart which shows a very clear bearish trend.
Price Action Context 01

Using this view as our HTF (Higher Time Frame) context we can clearly establish the most dominant order flow is distributed towards the sell side and we should only be looking for opportunities to sell this instrument on our trading time frame (Lower Time Frame).

Now, let’s have a look at each of the highlighted areas (1-3) on the LTF (Lower Time Frame) or Trading Time Frame (TTF), showing us the price action in greater detail.

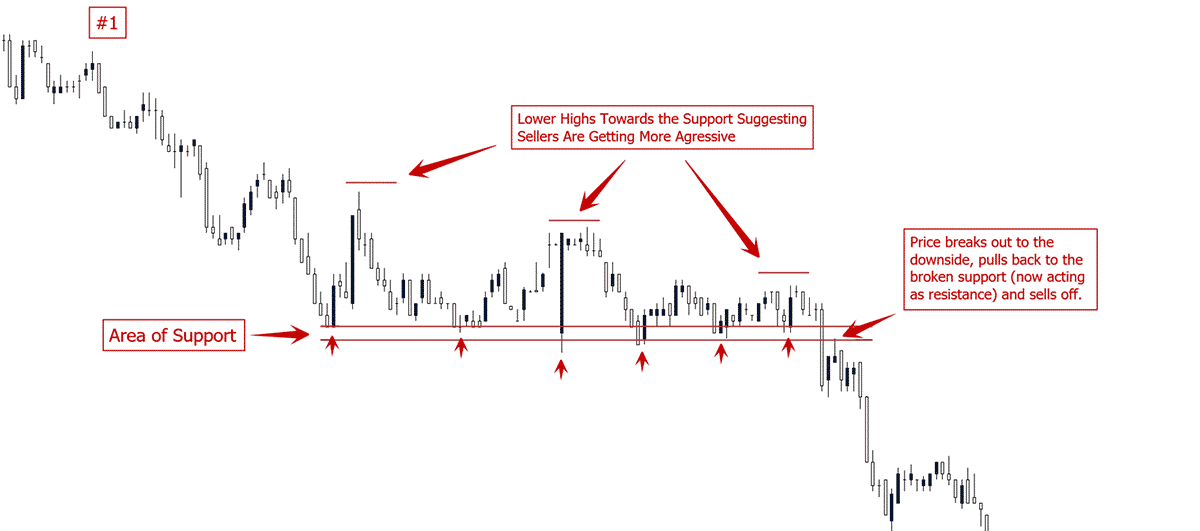
Highlighted Area #1:

Using the M15 chart enables us to view the bearish trend on our HTF in greater detail, enabling us to find high probability entry locations.

In this first example, we can see how price did build an area of ST support which later was broken and offered a good trading location on the pullback.
Price Action Context 02

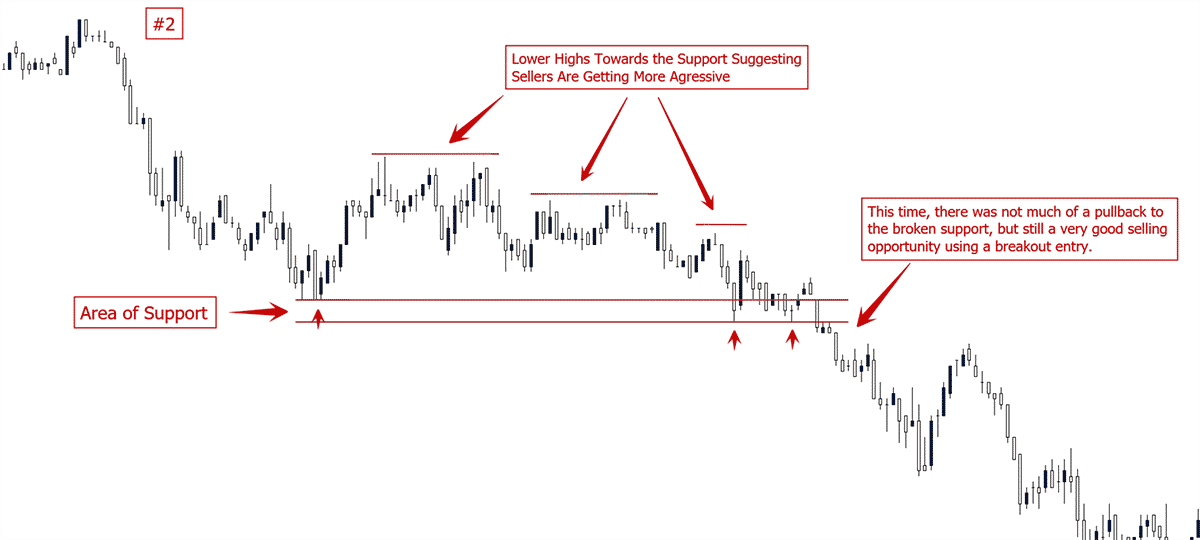
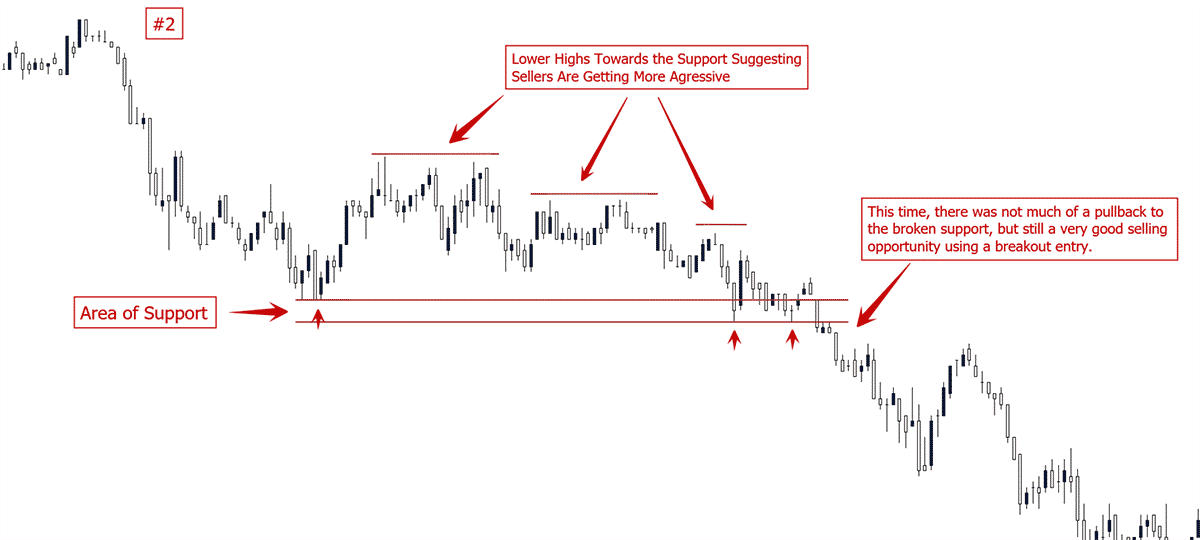
Highlighted Area #2:

The exact same structure/pattern repeated itself further down in the same trend.
Price Action Context 03

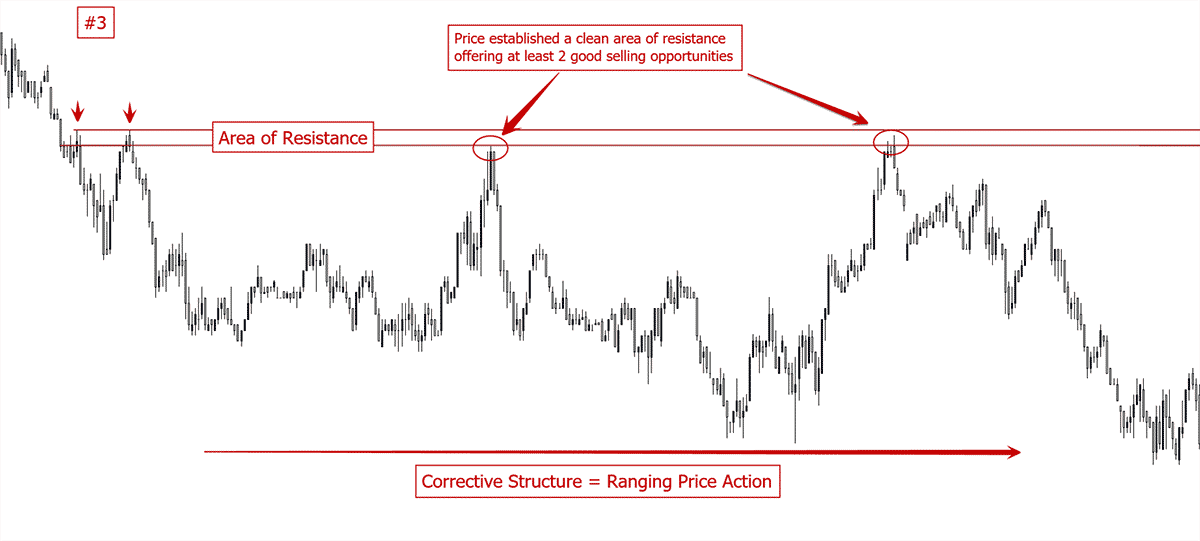
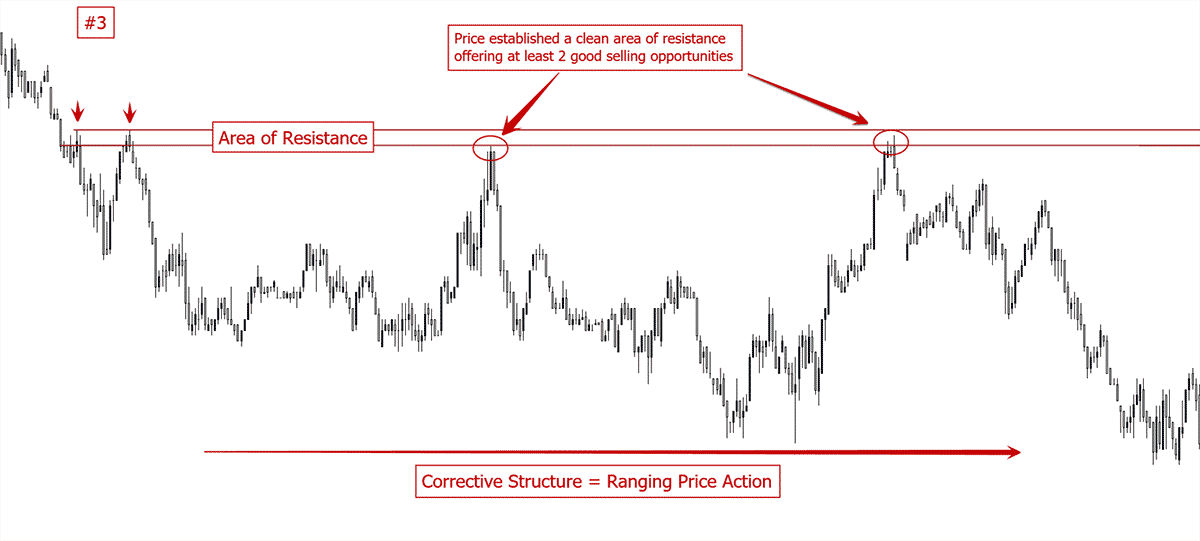
Highlighted Area #3:

Once the trend started slowing down, price started ranging within a small corrective structure, providing multiple shorting opportunities from the top of the structure.
Price Action Context 04

I hope this example clarifies why it is important to trade in line with the HTF price action context/order flow and how you can utilize the lower time frames to view the HTF price action in greater detail, enabling you to spot high probability entry locations.

Anyone trying to buy in this trend would have gotten crushed.
These are only a few examples of how to use the LTF to enter trades within a HTF trend.

Increased Cognitive Load (CL) When Day Trading

As already mentioned, intraday trading means faster moving prices/charts and requires you to make many important decisions in a fraction of the time that you’d have at your disposal when trading on a higher time frame like the 4 hour or daily chart. This significantly increases the cognitive load on a trader.

What is cognitive load you ask? Cognitive load refers to the total amount of mental effort being used in the working memory, similar to the working memory of a computer and refers to how much information an individual can consume/process in a given period.

A greater cognitive load means that you’ll exhaust your energy at a much faster rate which in turn can have an effect on your decision making.

Aspiring traders often are attracted to trading the lower time frames because they offer more ‘action’. But since they are not experienced enough, they are often unable to cope with the increased cognitive load, which renders them paralyzed at times or leads to very bad trading decisions.

The additional stress caused by suboptimal trading decisions further increases the cognitive load and a trader can end up in a very vicious negative spiral.

Now, there are a few key things we can do to:

  1. Reduce cognitive load and
  2. Handle the increased cognitive load correctly

First of all, one of the most important factors to reduce cognitive load is skill. The better you are at something and the deeper a skill has been wired and made subconscious, the less effort is required to perform a task.

A good example is driving a car. When you just have gotten your driver’s license, driving a car in heavy traffic can be exhausting, simply because all the skills necessary for driving a car have not yet become a sub-conscious skill and therefore requires a lot of focus/concentration, whereas a few years later, we are able to drive a car effortlessly, almost on auto-pilot.

It’s the same with trading. Before you take on one of the most challenging trading environments (intra-day trading), you’d want to make sure that many of your core trading skills have been repeated enough for them to be subconscious skills.

Another key factor to help reduce cognitive load is having the right mindset and being able to handle emotions. Having an incorrect mindset while letting emotions take control of you will multiply the already high cognitive load experienced during day trading.

In our Advanced Traders Mindset Course, we provide the tools, strategies and training to build a successful trading mindset, including day trading.

Increased Trading Costs

It is important to note, if you are trading the lower time frames intraday, trading costs will become a greater factor compared to someone trading the higher time frames. Even though trading costs may seem small in isolation, those differences in trading costs can add up pretty fast.

As a simplified example, let’s say a swing trader and intraday trader go long the stock of Apple at the same time. The swing trader naturally will have a bigger profit target and stop loss compared to the intraday trader since he/she only trades larger moves/swings.

Thus, for the sake of this example, let’s say that the swing trader has a target of $10 whilst the intraday trader a target of only $2 and both have an average spread of $0.20.

Now, for the intraday trader, this means that the spread (cost) for this trade is 10% of their potential profit whilst for the swing trader, the spread will only be 2%, meaning the swing trader can keep 98% of their potential profit whilst the day trader only can keep 90%.

Whilst this might not sound like a lot, over time (and hundreds of trades), this difference can add up fast and ‘eat up’ a big portion of your profits.

Now this example is overly simplified as there can also be commissions and swap rates involved, but the bottom line is that intraday trading is more ‘expensive’ than swing or position trading when it comes to transaction costs.

The higher trade frequency of an intraday trader will likely cover some of the costs, but in the end, as an intraday trader you need to be more precise in your trading to reduce the impact of the spread in relation to your overall profit.

Risk & Money Management

Taking risks is an essential part of trading. In order to make money trading, a trader has to take on risk. But this risk has to be calculated and controlled at all times as poor risk management can lead to disaster, and in the worst case blow up your account (losing your entire trading capital).

Thus, proper risk, money management and capital preservation should be the #1 priority of any trader.

For the members of my Trading Masterclass, I recommend having three to four risk thresholds as part of their trading plan.

These thresholds are:

  1. A max risk per trade
  2. A max risk per day
  3. A max risk per week
  4. A max risk per month

A max risk per trade should be based upon your risk of ruin. If you have a risk of ruin that is zero, mathematically you cannot blow up your account and you will make money. A max risk per day should be a daily risk limit to avoid losing too much on any given day. The max risk per week and month are also based upon the same concepts.

If any one of the above is ‘optional‘ in my book, it is the max risk per week. Keep in mind, none of the above defines how many trades you should (or should not) take in a day to avoid over-trading, a topic we’ll talk about later.

Also I’d suggest no more than a 1% risk per trade, although for day traders, I’d suggest less in the beginning (<1%).

Preparation

Preparation, in my opinion, begins with the mental game, and that has to start before you actually put your butt in your chair.

You’ll see this in professional athletes who are getting themselves mentally ready before they even get to the stadium.

Aaron Rogers (quarterback for the Green Bay Packers, 1x Super Bowl Champion & holder of several Quarterback records) spends a lot of time the night before thinking about the game and what he is going to do.

Trading has to be approached in a similar way, and the successful traders I communicate with regularly, employ the same tactic.

Hence, you have to include mental preparation in this part of the trading process.

Many times I talk to my private course students and ask them what they do to prepare for the day’s trading.

These are the general responses I get:

  • Drink a cup of coffee, maybe two.
  • Check out what announcements are coming out.
  • Look at the markets and then get ready to trade.

And it ends there…

To me, this is somewhat shocking. Perhaps because I trained in martial arts, played semi-professional futbol or competed in archery, I have a habit of preparing for anything I am doing seriously. This is the same for trading – preparation is key.

Case in point, think about what you are doing when you are going to trade for the day.

You are going to do many of the following tasks each day:

  • Make critical decisions and calculations on risk
  • Access long-term memory and use your pattern recognition skills to find trades
  • Come up against your psychological issues around money and Equity Threshold
  • Sit down for hours meaning your bodies energy will be less active and more stagnant
  • Use the reptilian part of your brain (limbic brain) which thinks more of near term rewards instead of long term benefits

Do you notice a pattern here?

Other than the fourth one on the list, all the others have to do specifically with your mind. The most important tool you are going to be using while trading is your mind, so preparing this is the most critical thing you could do before trading.

Ask yourself the following questions:

  • Would a professional football player not warm up their muscles before a game?
  • Would a football coach not watch video of their team or the opposing team before a game?
  • Would a professional archer not take a few shots with the bow before starting a competition?

No – and there is a reason for this. All professionals know one thing for sure – they all prepare for whatever their task, skill or thing they have to execute. And why shouldn’t you?

Why shouldn’t you be preparing your mind before you start your day of trading?

While the questions are rhetorical, there are several things you can do to get yourself mentally prepared to make money trading. My first recommendation is to get up early and take a shower before you start your day.

Your central nervous system actually needs certain things to get in sync with your body biologically. Getting up around the time the sun does activates a protein sequence in your brain which helps it get chemically prepared for an intense day of critical thinking.

Showering helps to stimulate your nervous system and wake up your body and mind so you are more fresh for the day.

Another recommendation is to get some exercise, whether it be physically, mentally, or ideally both.

Each day, before I do anything, before I make any critical decisions or start work, I practice yoga and meditation every day.

Yoga helps calm my breathing which allows me to control my emotions and thoughts while having a body physically healthy to sit for long hours in the day.

Meditation sharpens my mind to help develop awareness of my thoughts and emotions which could influence my trading. It also helps me think clearly while making critical decisions.

I then spend the last 10-20mins visualizing what I am going to accomplish for the day, how I am going to trade, and what I will do successfully.

At a minimum, if you start trading in the morning, I’d suggest doing a few stretches since you are sitting all day and at least do some visualizations to program your mind for success. Remember, sitting is the new smoking, so make sure to augment this by getting some exercise.

If you are trading after work, make sure to take a break from your work mode, unwind a bit, clear the mind, and then sit down at your computer.

Day trading & Overtrading

Regardless of whether you are day trading or swing trading, over-trading is something many traders struggle with. The reason why you over-trade has two major underlying reasons.

Before we dive into those, I’d like to point out some key things most struggling traders mention when it comes to over-trading.

They are:

  • “Feeling the need to be in the market” or “Fear of missing out (FOMO)”
  • “I get impatient sometimes”

Note those two statements down for now as they are critical.

But before we get into the reasons why you over-trade, we need a working definition of ‘over-trading’. My definition of over-trading is as follows.

Assuming you are working with a trading plan, I define over-trading as the following:

Over-trading is taking any trades outside of your trading plan.

If you take any trade outside your trading plan (either going over your risk limits, or something not in your trading plan), then you are ‘over-trading’. Everything inside your trading plan (whether it be 10 trades or 100 trades for the month) is not over-trading, just trading and taking advantage of opportunities.

You can over-trade on any time frame. The time frame is not the root cause of over-trading. A lack of discipline is.

If you have not wired your brain to mentally execute your trading plan, the time frame will make no difference.

Just like if you have the habit of overeating, you will do so whether you are at a restaurant or your own kitchen. The habit is within you and doesn’t just disappear when you change environments.

If you want to dissolve the underlying root of over-trading (discipline & mental execution), you have to rewire your brain. Before we get into how you can do that, I’d like to address a few points about my definition of over-trading.

If a basketball player is on a hot streak, you keep feeding him the ball as those streaks are critical to winning. Professional poker players know this as well – when hot, keep putting your chips down.

The same goes for trading. Not pulling the trigger when you have a setup (with all conditions in place) simply limits your upside. Why would you ever do that? If the price action context is prime for you to make a ton of money that day, you should be attacking the markets.

On the other side of the coin, I’ve had days where I started out with 6, 7, maybe even 9 losses in a row. But I’m not fazed by this. As long as I haven’t hit my risk limit per day, I’ll keep attacking the markets, sometimes buying and selling in the same day.

Ironically, on many of those days, one or two big winners either brought me back to break-even, or helped me end up in profit for the day. Had I succumbed to some notion about ‘over-trading = x trades‘, every one of those days would have ended in a loss. On top of that, each one would have ended with a much greater negative impression in my mind.

Yet how much confidence do you think I get from losing 9+ trades in a row, yet still ended the day in profit? Just like a quarterback doesn’t stop throwing the ball because he’s had a couple interceptions and bad passes, the same goes for trading.

Your goal should be to win each and every day while maintaining your trading plan, risk limits and mental execution.

The time frames you are trading doesn’t determine whether you over-trade or not.

And the proof is in the pudding! Many traders are already trading the higher time frames, and still have issues with over-trading. The underlying root cause is discipline and mental execution in trading, and that comes down to how your brain is currently wired.

If you haven’t wired it into your brain yet, you won’t be able to execute discipline while trading. It’s as simple as that, regardless of the time frame. If you fear something will happen, you create psychological tension around this fear. This only increases your negativity bias, which further perpetuates this behavior.

In conclusion, we have to adopt a different working definition of ‘over-trading’. We have to get beyond the time frames that cause overtrading notion.

Your goal should be to execute your trading plan as is (and nothing more). And that needs to include your risk limits while pulling the trigger when you need to.

Review Your Work for the Day

Did you know professional football coaches after each game will spend anywhere from 20-40hrs a week reviewing tape of their last game, how things went, and then look at tape of their upcoming opponents?

Sometimes they are spending as many hours as people work in a week, just preparing for the next game. They will make notes, look at several different angles of the games, then prepare some tapes for their players to review to see what mistakes they made and learn from their mistakes.

There are actual poker players who have rooms full of journals with notes they took on players, how they played, what decisions they made, and how the hand played out.

  • What do you do to review your trading and correct your mistakes?
  • Do you have a trading journal which you actually fill out religiously?
  • Do you screen record your trading and make comments of what you were seeing so you can see your mistakes and what you did correctly?

Do you review your systems performance monthly, quarterly or yearly? Trading is not just sitting in front of the computer when the markets are open, pushing a few buttons on the mouse, buying, selling and putting in stops or limits.

Trading, like all professional endeavors, is about preparing yourself for the challenge ahead. Trading is having a framework and a clear trading plan so there is no confusion about what you need to do each day.

Trading is about preparation + reviewing your performance. Simply put, you cannot change that which you do not review and measure.

Ask yourself what you are currently doing to review your trading process and how you are fixing your trading mistakes and plugging your leaks.

In terms of reading the price action context and making trading decisions, there is not much difference between swing trading and day trading.

The biggest difference between the two styles of trading is the holding time, trade frequency and cost per trade.

We’ll take a look at each of these in detail, but before we do, let’s define ‘swing trading’ and why it’s called that.

What Is Swing Trading?

If you remember from our day trading article, depending on the market that is traded, a day trade is a trade that is opened and closed within the same day or the same trading session.

So what is a swing trade?

A swing trade is a trade that is held for longer than a trading session or day.

A general definition of a swing trade is a trade that lasts from a couple of days and up to several months, in order to profit from an anticipated price move in the traded instrument.

Now, why is it called ‘swing trading‘?

To clarify this, let’s bring in a chart from our article on price action context.

How to Swing Trade 01

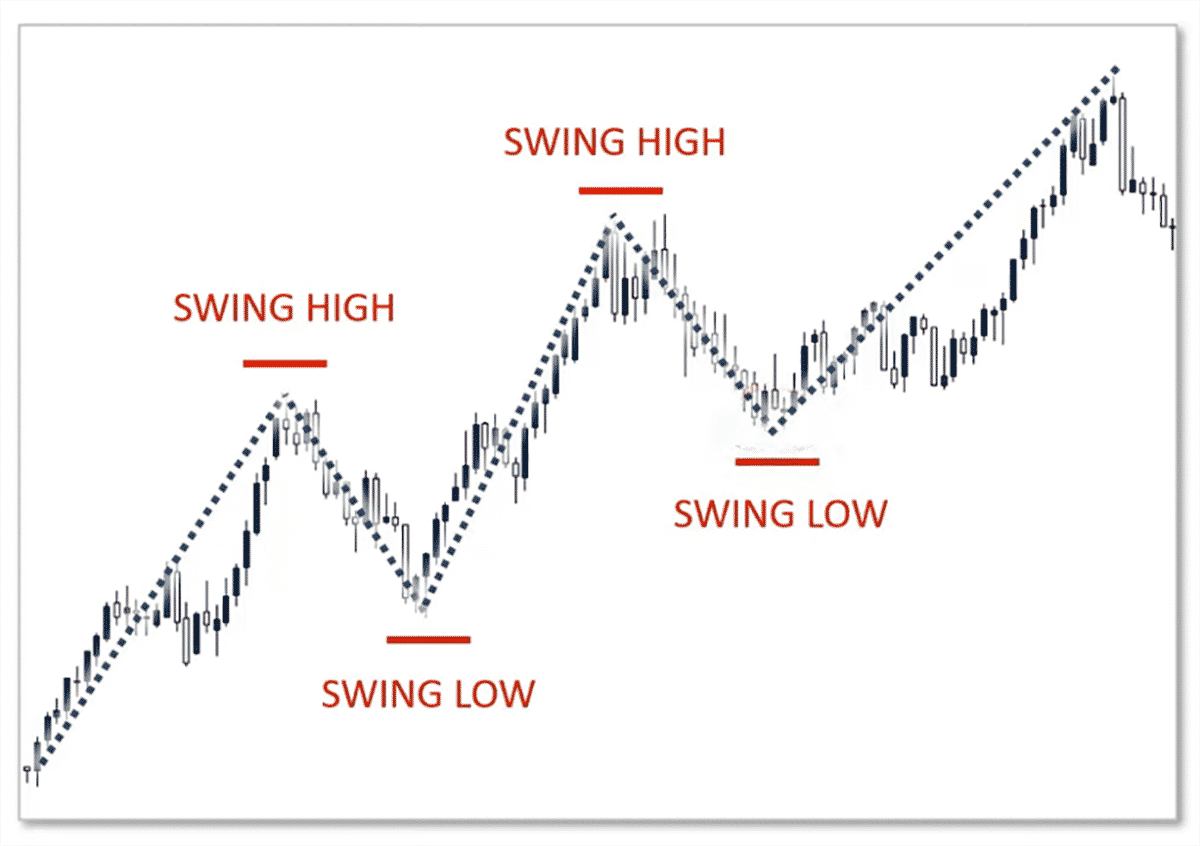
The increase/decrease of price in an instrument over time rarely happens in a straight ‘line’ up or down, but rather in ‘waves’ where price moves fast in one direction and then pauses before the next move into the same direction.

These ‘waves’ are what create bullish or bearish trends which can last from a few hours to multiple years depending on the time frame that you’re looking at.

Every time that price starts a pullback or starts a new move after a pullback creates so called swing points (see chart above) and thus, as a swing trader, you’re looking to get in as close as possible at a swing low in the trend and exit as close as possible to a swing high to capture as much of the trend move as possible and that is why it’s called swing trading.

Swing Trading Advantages vs. Disadvantages

Swing trading offers advantages compared to day trading on the lower time frames, but there are also disadvantages which we’ll cover below.

Starting off with the advantages, there are three major advantages of swing trading:

  1. Compared to day trading, swing trading requires less time. If you do not have a lot of time to dedicate to trading on a daily or weekly basis, then swing trading is the better choice for you. Once you got the basics down and have created your trading framework, you can swing trade effectively only dedicating a few hours per week to it.
  2. Decreased trading costs. If you’re trading the higher time frames, your stop loss and targets naturally will be larger, meaning that trading costs in general will be lower compared to trading on the lower time frames. For example, let’s say that a swing trader has a target of $10 whilst an intraday trader has a target of only $2 and both have an average spread of $0.20. This means that the spread (cost) for this trade is 2% of the potential profit for the swing trader whilst for the day trader, the spread will be 10% of the potential profit, meaning the swing trader can keep 98% of their potential profit whilst the day trader only can keep 90%.
  3. Decreased cognitive load (CL) compared to day trading. What is cognitive load you ask? Cognitive load refers to the total amount of mental effort being used in the working memory, similar to the working memory of a computer and refers to how much information an individual can consume/process in a given period. A lower cognitive load means that you’ll exhaust your energy at a slower rate which in turn can have a positive effect on your decision making.

In terms of disadvantages, the major disadvantage to swing trading is the lower trade frequency. When trading, the more often you can apply your edge in the markets, the better. With swing trading, you’ll a) overall devote less time to trading and b) trading the higher time frames won’t offer as many trading opportunities.

To read more about how trading frequency and expectancy ties into your trading performance and profitability, check out this article on day trading.

Swing Trading Time Frames

Generally, the time frames for swing trading you want to use are the weekly, daily, 4-hour and 1-hour charts. Any time frame below 1-hour likely won’t be of any use for a swing trader since trades on those time frames require a much more ‘hands on’ approach in terms of trade management.

Thus, if you’re able to only devote a couple of hours to trading per week, you want to stay above the 1-hour time frame.

Swing Trading & Price Action Context

Regardless if you’re swing trading or day trading, you want to make sure that you’re trading in line with the most dominant order flow as this helps to put the probabilities in the favor of your chosen trading direction.

Therefore you’d want to work with at least one higher time frame (HTF) to establish the price action context + trading direction, together with one lower time frame (LTF) which will be your trading time frame on which you make your trading decisions and place your trades.

To give you an idea what this looks like, let’s have a look at some charts.

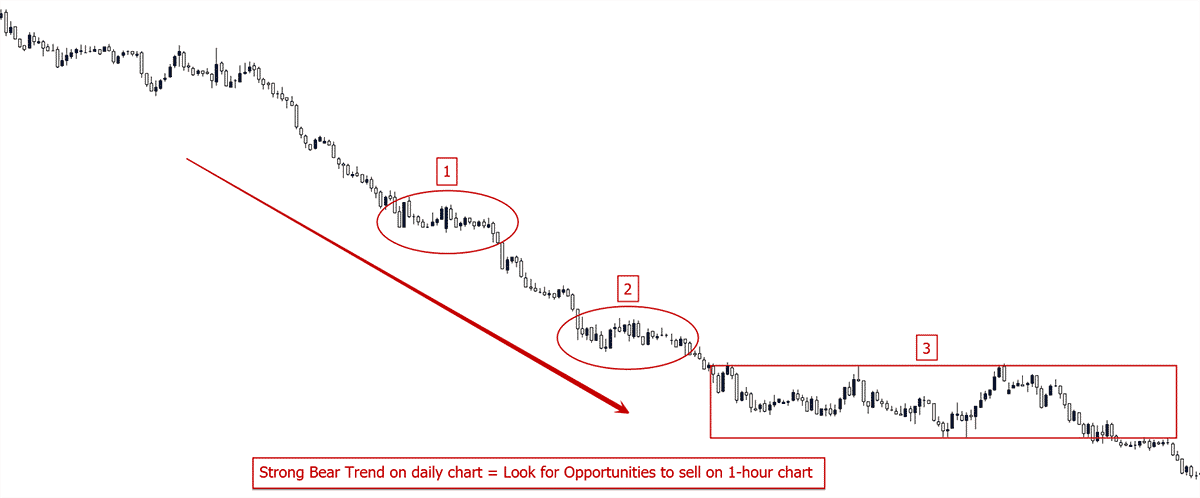
Below is a daily chart which shows a very clear bearish trend.

How to Swing Trade 02

Using this view as our HTF (Higher Time Frame) context we can clearly establish the most dominant order flow is distributed towards the sell side and we should only be looking for opportunities to sell this instrument on our trading time frame.

Now, let’s have a look at each of the highlighted areas (1-3) on the 1-hour time frame or Trading Time Frame (TTF), showing us the price action in greater detail.

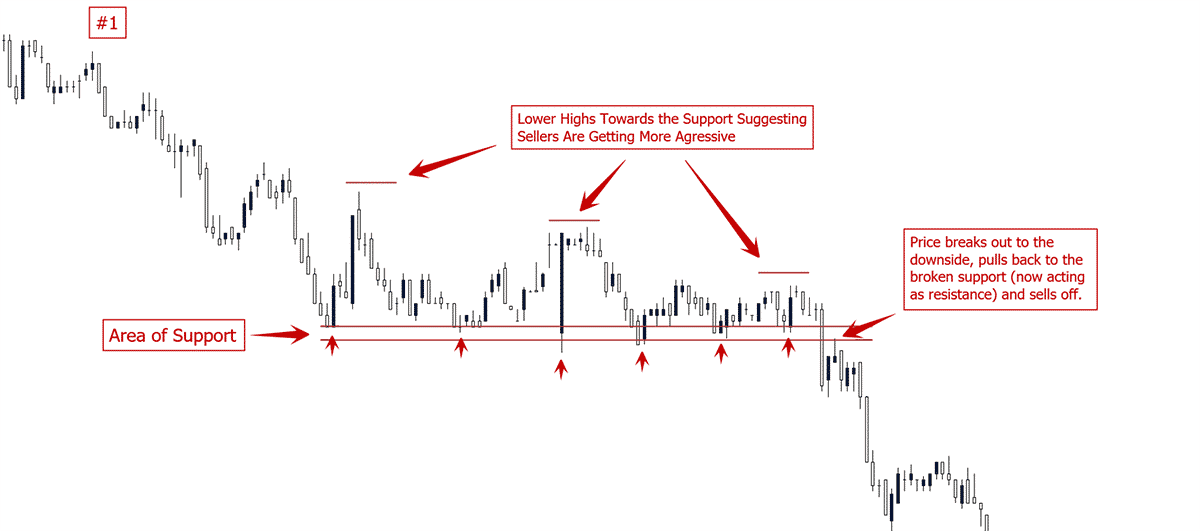
Highlighted Area #1:

Using the 1-hour chart, we can view the bearish trend on the daily time frame in greater detail, enabling us to find high probability entry locations.

In this first example, we can see how price did build an area of ST support which later was broken and offered a good trading location on the pullback.

How to Swing Trade 03

Highlighted Area #2:

The exact same structure/pattern repeated itself further down in the same trend.

How to Swing Trade 04

Highlighted Area #3:

Once the trend started slowing down, price started ranging within a small corrective structure, providing multiple shorting opportunities from the top of the structure.

How to Swing Trade 05

I hope this example clarifies why it is important to trade in line with the HTF price action context/order flow and how you can utilize the lower time frames to view the HTF price action in greater detail, enabling you to spot high probability entry locations.

Anyone trying to buy in this trend would have gotten crushed.
These are only a few examples of how to use the LTF to enter trades within a HTF trend.

Risk & Money Management

Taking risks is an essential part of trading. In order to make money trading, a trader has to take on risk. But this risk has to be calculated and controlled at all times as poor risk management can lead to disaster, and in the worst case blow up your account (losing your entire trading capital).

Thus, proper risk, money management and capital preservation should be the #1 priority of any trader.

For the members of my Trading Masterclass, I recommend having at least three risk thresholds as part of their trading plan.

These thresholds are:

  1. A max risk per trade
  2. A max risk per week
  3. A max risk per month

A max risk per trade should be based upon your risk of ruin. If you have a risk of ruin that is zero, mathematically you cannot blow up your account and you will make money. The max risk per week and month are based upon the same concepts. Also I’d suggest no more than a 1% risk per trade, preferably even lower if you’re just starting out.

Preparation

Preparation, in my opinion, begins with the mental game, and that has to start before you actually put your butt in your chair.

You’ll see this in professional athletes who are getting themselves mentally ready before they even get to the stadium.

Aaron Rogers (quarterback for the Green Bay Packers, 1x Super Bowl Champion & holder of several Quarterback records) spends a lot of time the night before thinking about the game and what he is going to do.

Trading has to be approached in a similar way, and the successful traders I communicate with regularly, employ the same tactic.

Hence, you have to include mental preparation in this part of the trading process.

Many times I talk to my private course students and ask them what they do to prepare for the day’s trading.

These are the general responses I get:

  • Drink a cup of coffee, maybe two.
  • Check out what announcements are coming out.
  • Look at the markets and then get ready to trade.

And it ends there…

To me, this is somewhat shocking. Perhaps because I trained in martial arts, played semi-professional futbol or competed in archery, I have a habit of preparing for anything I am doing seriously. This is the same for trading – preparation is key.

Case in point, think about what you are doing when you are going to trade for the day.

You are going to do many of the following tasks each day:

  • Make critical decisions and calculations on risk
  • Access long-term memory and use your pattern recognition skills to find trades
  • Come up against your psychological issues around money and Equity Threshold
  • Sit down for hours meaning your bodies energy will be less active and more stagnant
  • Use the reptilian part of your brain (limbic brain) which thinks more of near term rewards instead of long term benefits

Do you notice a pattern here?

Other than the fourth one on the list, all the others have to do specifically with your mind. The most important tool you are going to be using while trading is your mind, so preparing this is the most critical thing you could do before trading.

Ask yourself the following questions:

  • Would a professional football player not warm up their muscles before a game?
  • Would a football coach not watch video of their team or the opposing team before a game?
  • Would a professional archer not take a few shots with the bow before starting a competition?

No – and there is a reason for this. All professionals know one thing for sure – they all prepare for whatever their task, skill or thing they have to execute. And why shouldn’t you?

Why shouldn’t you be preparing your mind before you start trading?

While the questions are rhetorical, there are several things you can do to get yourself mentally prepared to make money trading. My first recommendation is to get up early and take a shower before you start your day.

Your central nervous system actually needs certain things to get in sync with your body biologically. Getting up around the time the sun does activates a protein sequence in your brain which helps it get chemically prepared for an intense day of critical thinking.

Showering helps to stimulate your nervous system and wake up your body and mind so you are more fresh for the day.

Another recommendation is to get some exercise, whether it be physically, mentally, or ideally both.

Each day, before I do anything, before I make any critical decisions or start work, I practice yoga and meditation every day.

Yoga helps calm my breathing which allows me to control my emotions and thoughts while having a body physically healthy to sit for long hours in the day.

Meditation sharpens my mind to help develop awareness of my thoughts and emotions which could influence my trading. It also helps me think clearly while making critical decisions.

I then spend the last 10-20mins visualizing what I am going to accomplish for the day, how I am going to trade, and what I will do successfully.

At a minimum, if you start trading in the morning, I’d suggest doing a few stretches since you are sitting all day and at least do some visualizations to program your mind for success. Remember, sitting is the new smoking, so make sure to augment this by getting some exercise.

If you are trading after work, make sure to take a break from your work mode, unwind a bit, clear the mind, and then sit down at your computer.

Swing Trading & Overtrading

Regardless of your trading style, over-trading is something many traders struggle with. The reason why you over-trade has two major underlying reasons.

Before we dive into those, I’d like to point out some key things most struggling traders mention when it comes to over-trading.

They are:

  • “Feeling the need to be in the market” or “Fear of missing out (FOMO)”
  • “I get impatient sometimes”

Note those two statements down for now as they are critical.

But before we get into the reasons why you over-trade, we need a working definition of ‘over-trading’. My definition of over-trading is as follows.

Assuming you are working with a trading plan, I define over-trading as the following:

Over-trading is taking any trades outside of your trading plan.

If you take any trade outside your trading plan (either going over your risk limits, or something not in your trading plan), then you are ‘over-trading’. Everything inside your trading plan (whether it be 10 trades or 100 trades for the month) is not over-trading, just trading and taking advantage of opportunities.

You can over-trade on any time frame. The time frame is not the root cause of over-trading. A lack of discipline is.

If you have not wired your brain to mentally execute your trading plan, the time frame will make no difference.

Just like if you have the habit of overeating, you will do so whether you are at a restaurant or your own kitchen. The habit is within you and doesn’t just disappear when you change environments.

If you want to dissolve the underlying root of over-trading (discipline & mental execution), you have to rewire your brain. Before we get into how you can do that, I’d like to address a few points about my definition of over-trading.

If a basketball player is on a hot streak, you keep feeding him the ball as those streaks are critical to winning. Professional poker players know this as well – when hot, keep putting your chips down.

The same goes for trading. Not pulling the trigger when you have a setup (with all conditions in place) simply limits your upside. Why would you ever do that? If the price action context is prime for you to make a ton of money that day, you should be attacking the markets.

On the other side of the coin, I’ve had days where I started out with 6, 7, maybe even 9 losses in a row. But I’m not fazed by this. As long as I haven’t hit my risk limit per day, I’ll keep attacking the markets, sometimes buying and selling in the same day.

Ironically, on many of those days, one or two big winners either brought me back to break-even, or helped me end up in profit for the day. Had I succumbed to some notion about ‘over-trading = x trades‘, every one of those days would have ended in a loss. On top of that, each one would have ended with a much greater negative impression in my mind.

Just like a quarterback doesn’t stop throwing the ball because he’s had a couple interceptions and bad passes, the same goes for trading.

Your goal should be to win while maintaining your trading plan, risk limits and mental execution.

The time frames you are trading doesn’t determine whether you over-trade or not.

And the proof is in the pudding! Many traders are trading the higher time frames, and still have issues with over-trading. The underlying root cause is discipline and mental execution in trading, and that comes down to how your brain is currently wired.

If you haven’t wired it into your brain yet, you won’t be able to execute discipline while trading. It’s as simple as that, regardless of the time frame. If you fear something will happen, you create psychological tension around this fear. This only increases your negativity bias, which further perpetuates this behavior.

In conclusion, we have to adopt a different working definition of ‘over-trading’. We have to get beyond the time frames that cause overtrading notion.

Your goal should be to execute your trading plan as is (and nothing more). And that needs to include your risk limits while pulling the trigger when you need to.

Review Your Work for the Day

Did you know professional football coaches after each game will spend anywhere from 20-40hrs a week reviewing tape of their last game, how things went, and then look at tape of their upcoming opponents?

Sometimes they are spending as many hours as people work in a week, just preparing for the next game. They will make notes, look at several different angles of the games, then prepare some tapes for their players to review to see what mistakes they made and learn from their mistakes.

There are actual poker players who have rooms full of journals with notes they took on players, how they played, what decisions they made, and how the hand played out.

  • What do you do to review your trading and correct your mistakes?
  • Do you have a trading journal which you actually fill out religiously?
  • Do you screen record your trading and make comments of what you were seeing so you can see your mistakes and what you did correctly?

Do you review your systems performance monthly, quarterly or yearly? Trading is not just sitting in front of the computer when the markets are open, pushing a few buttons on the mouse, buying, selling and putting in stops or limits.

Trading, like all professional endeavors, is about preparing yourself for the challenge ahead. Trading is having a framework and a clear trading plan so there is no confusion about what you need to do each day.

Trading is about preparation + reviewing your performance. Simply put, you cannot change that which you do not review and measure.

Ask yourself what you are currently doing to review your trading process and how you are fixing your trading mistakes and plugging your leaks.

Here is a live interview Chris Capre did on price action trading and order flow tactics with Etienne Crete from Desire to Trade. In this interview, Chris Capre talks about how you can use price action context to glean the underlying order flow in the market, making sure you’re trading with the institutional traders, and the dominant order flow in the market. We specifically talk about how impulsive and corrective price action can help you discover the underlying order flow in the market, and how to trade higher time frames and lower time frames together.

Read more

Introduction to the Ichimoku Cloud

The Ichimoku cloud is one of the more unique trading methodologies out there. Originally developed in the 60’s in Japan by Goichi Hosada, the Ichimoku cloud (also known as Ichimoku Kinko Hyo – or ‘one glance balanced cloud chart) was first published in a series of 4 books and over 1000 pages.

After releasing the Ichimoku cloud, Goichi Hosada started to go by the pen name Ichimoku Sanjin. Originally build for the Japanese stock markets, the Ichimoku cloud indicator eventually made its way into the western trading world via the stock, commodities and forex markets.

As the name implies, the goal of the Ichimoku cloud is to give you a complete idea of the market at one glance. In other words, the Ichimoku cloud is designed to give you information about the trend, momentum, price action, key support and resistance levels, along with potential turning points and likely future direction.

In this article, we’re going to cover the core components of the Ichimoku cloud, which include the 5 lines and the 3 pillars.

The 5 Lines of Ichimoku

The Ichimoku cloud indicator. This is what Ichimoku is most famously known for is the 5 lines that are unique to Ichimoku.

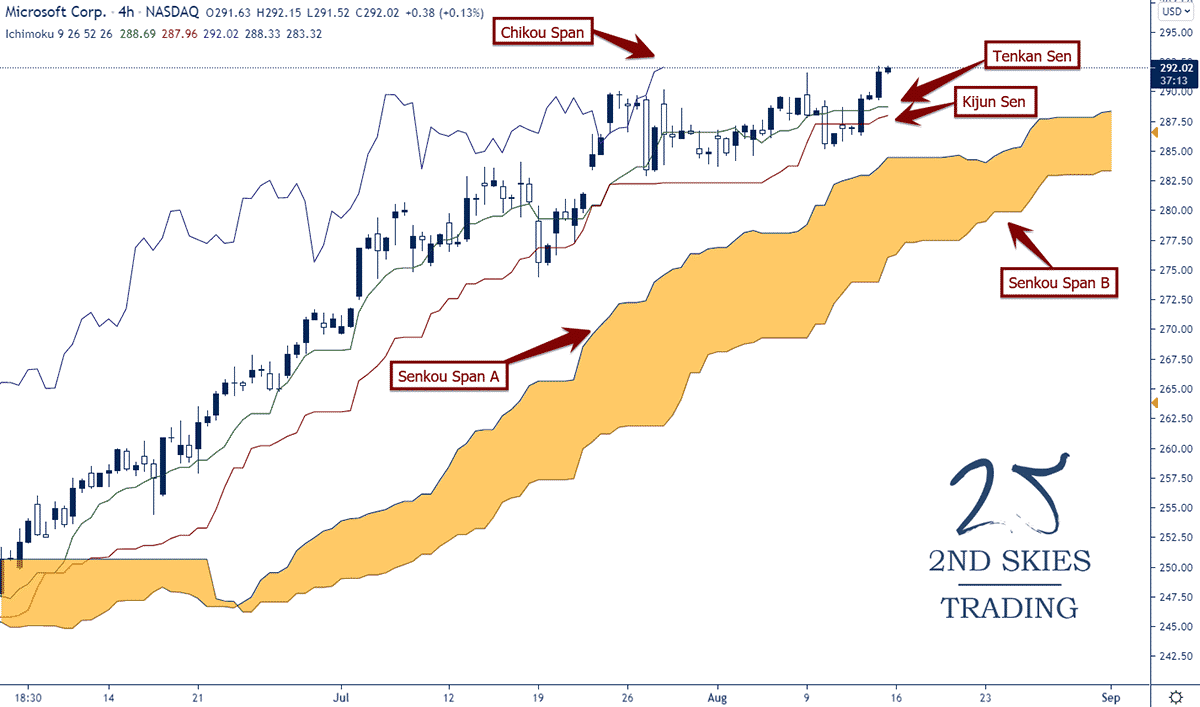
Ichimoku Cloud Trading 01

The following are the 5 lines of the Ichimoku cloud:

  • The Tenkan-sen (sen means ‘line’ in Japanese)
  • The Kijun-sen
  • The Chikou Span
  • The Kumo (or cloud, which is composed of the Senkou Span A & B)

The 5 lines above comprise the most visible aspects of Ichimoku and convey a lot of information about a stock’s price action so lets break down each of the 5 lines and what they communicate for the stock investor or trader.

The Tenkan-sen

The Tenkan-sen which you can see in the above chart is similar to a 9 EMA (exponential moving average), and thus acts like dynamic support or resistance, but uses a slightly different calculation.

The Tenkan-sen is calculated by taking the highest high + the lowest low over the last 9 periods (or candles) and create a line to describe those 9 periods of price action.

The best way to think about the Tenkan-sen is as a line the calculates momentum and volatility. It incorporates a short to medium term momentum (by covering the last 9 periods) while also including volatility which will be partially represented by the highest highs and lowest lows over that 9 period.

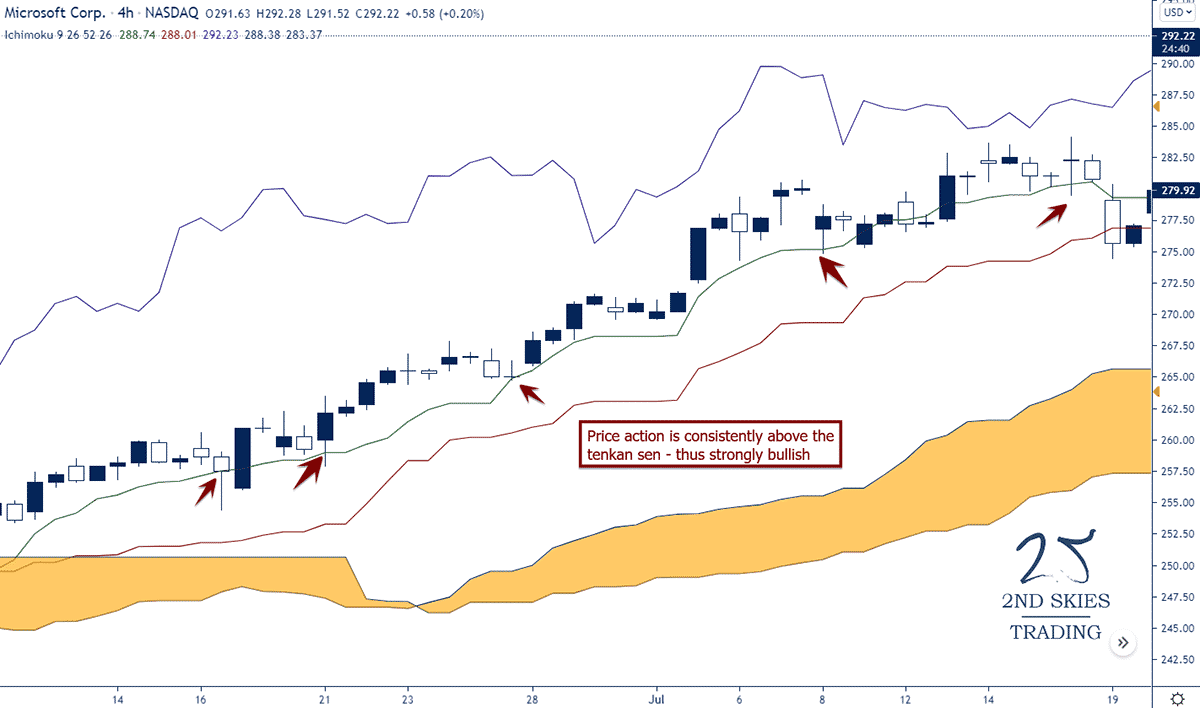
Generally, when the Tenkan-sen is trending up and the price action is above the Tenkan-sen, the market is considered to be strongly bullish for uptrends.

Ichimoku Cloud Trading 02

For downtrends, if the price action is below the Tenkan-sen while it’s trending down, then the market is strongly bearish.

The Kijun Sen

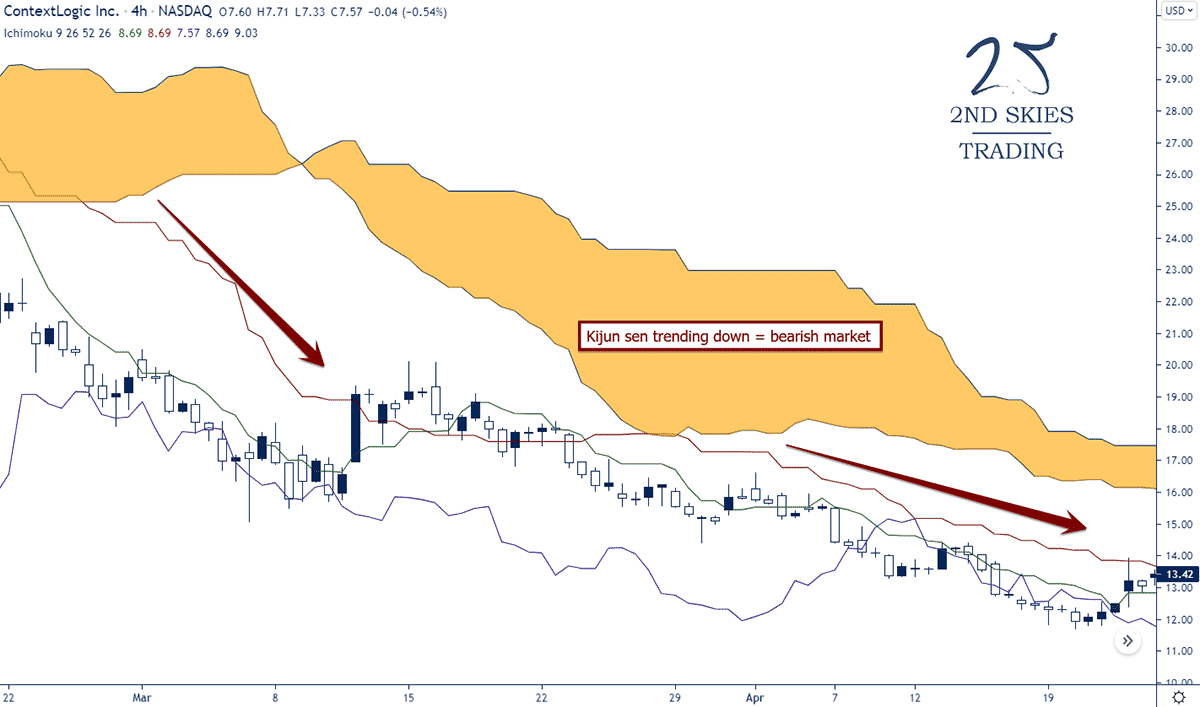
The Kijun-sen is often referred to as the datum line or trend line, meaning its function is to gauge the overall trend of the stock or instrument.

Generally speaking, when the Kijun-sen is trending up and the price action is above, the market is in a bull trend, and if its trending down while the price action is below it, the market is in a bear trend.

The Kijun-sen covers the highest high + the lowest low over the last 26 periods, so essentially the same calculation as the Tenkan-sen, but over a longer period, thus capturing the overall trend, but not as sensitive to shorter term bursts of volatility and momentum.

Ichimoku Cloud Trading 03

The Chikou Span

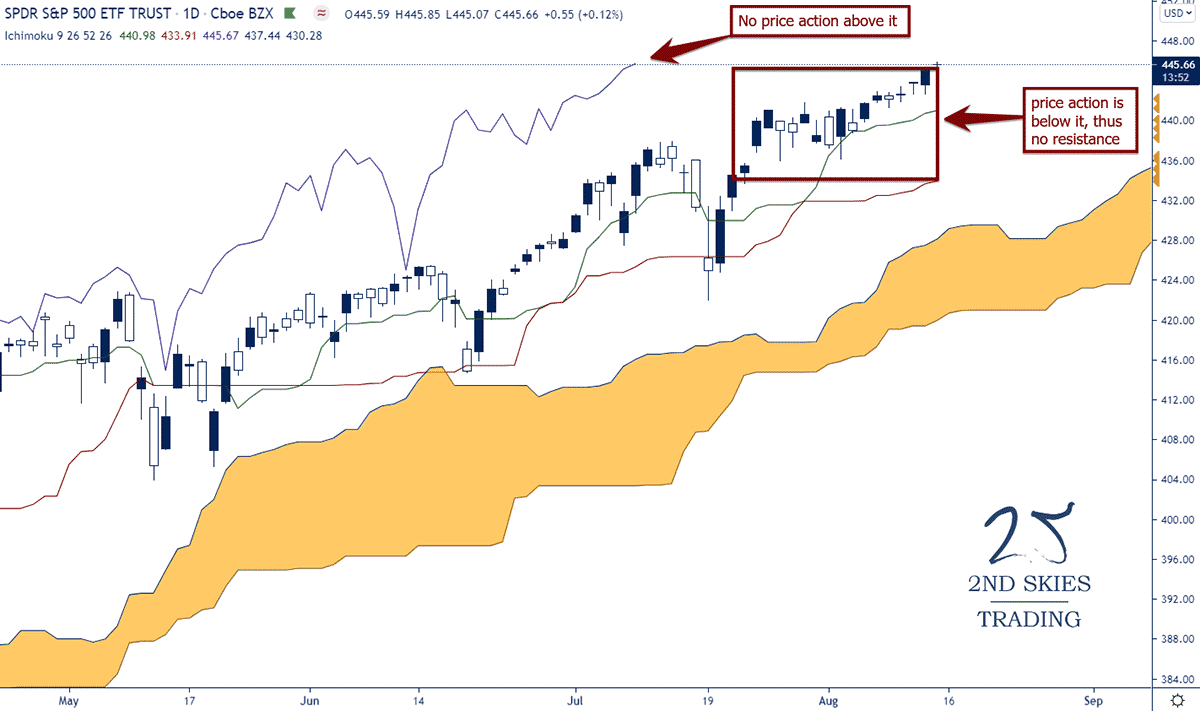
The Chikou span is a lagging line which takes the current closing price and shifts it back 26 periods (or candles) of time.
Why would the Chikou span be shifted back 26 periods?

The idea is to take the current closing price and compare it to the prior price action to see if there is resistance ahead in a bull trend or support lower in a bear trend.

If the Chikou span is above the prior price action, there is little history or resistance in the way of the current trend (for a bull trend, and vice versa for a bear trend).

In the chart below, we can see the Chikou span (purple line) has no price action or structures above it, thus no historical resistance in the way here.

Ichimoku Cloud Trading 04

The Kumo (or cloud)

The most unique aspects of the Ichimoku cloud is the Kumo (cloud) part of the indicator.

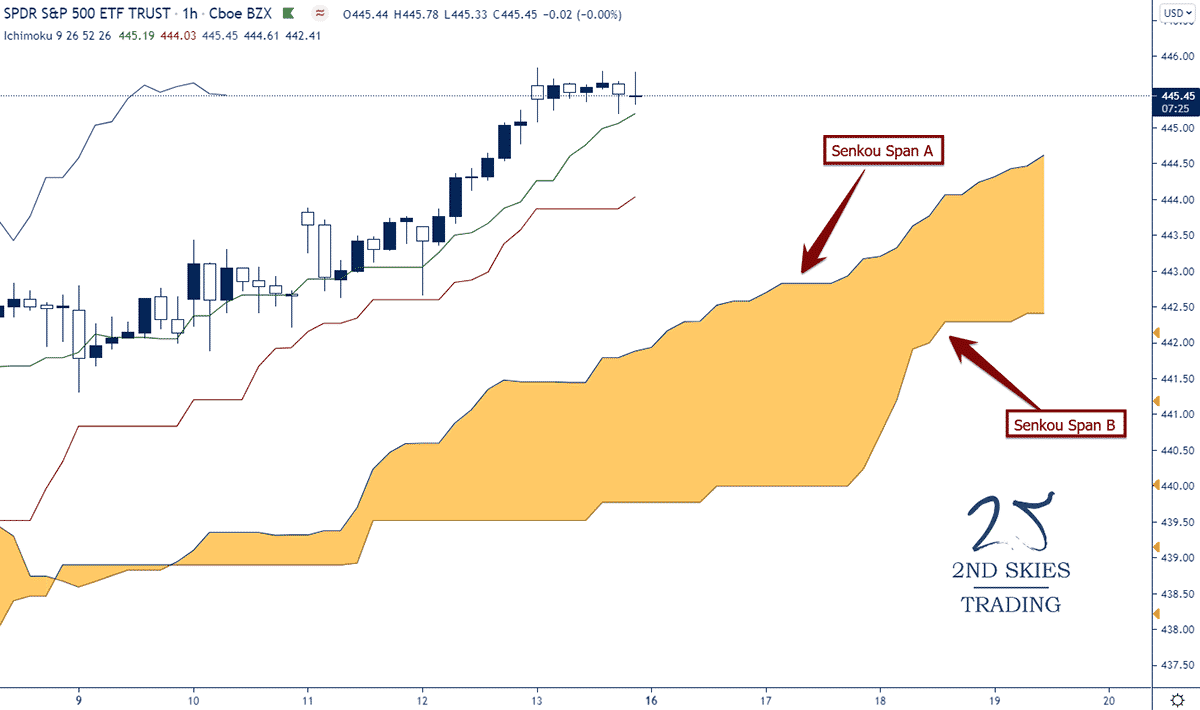
If you notice in the stock chart below, the cloud is below and ahead of the current price action. This is because the Span A (upper part of the cloud in an upward rising cloud) which is formed by taking the Tenkan-sen and adding it to the Kijun-sen, dividing that value by 2, then plotting it 26 periods ahead. So:

(Tenkan Line + Kijun Line) / 2 placed 26 periods ahead

Span B is formed by taking the highest high (over the last 52 periods) and adding it to the lowest low (over last 52 periods), dividing that by 2 and plotting it 26 periods ahead. Thus:

(Highest High + Lowest Low over last 52 periods) / 2 and plotted 26 periods ahead.

Ichimoku Cloud Trading 05

The main goal of the Kumo is to give the stock investor or trader an idea of future support and resistance.
In a general way of speaking, if the price action is above the Kumo while its rising, you are in a bull trend. If the price action is below the Kumo while its falling, you are in a bear trend.

You will notice across many stock charts (especially higher time frames like the 4hr, daily and weekly charts) that strong bull trends will stay above the Kumo for long periods of time. They will also sometimes pull back to the Kumo, treat it as support, then continue in the bull trend.

This can sometimes be used for potential adding points for stock investors to add to their current stock holdings, or for swing traders looking for potential pullback locations to get long.

5 Lines Closing Comments

The 5 lines of Ichimoku have both individual functions and are meant to provide a collective picture (or one glance) of the stocks current trend (Kijun), momentum (Tenkan), along with potential future support or resistance levels (Kumo).

While there are more subtle nuances involved, this covers the basics of the Ichimoku cloud and its 5 lines.

There are more advanced aspects of the Ichimoku cloud called the 3 Ichimoku pillars. For those of you looking to learn more advanced aspects of the Ichimoku cloud, read on.

The 3 Pillars of Ichimoku

While most people associate Ichimoku with its 5 lines, the real base of Ichimoku theory is the 3 pillars. The following are the 3 pillars which all of Ichimoku is based upon:

  • Ichimoku number theory
  • Ichimoku wave theory
  • Ichimoku time theory

Ichimoku number theory is based upon 4.5 years of research by Goichi Hosada who studied every Easter and Western theory under the sun, including physics, Fibonacci’s, and various eastern numerological systems.

Eventually he settled upon 3 numbers that became the basis of all Ichimoku numbers. They were 9, 17 and 26. There are technically 10 numbers in all, but these are the primary ones.

The numbers according to the original texts are referred to as one section (9), two sections (17) and 1 period (26).

While I’d like to dive in deeper at some future point into Ichimoku number theory, after speaking with Hosada’s grandson (see picture below) who has studied Goichi Hosada’s texts extensively, he agreed with me the most important of the 3 pillars is the one I’m going to talk about next.

Goichi Hosada's grandson and Chris Capre

Hence, while you’re welcome to spend time studying Ichimoku number theory, I don’t think it has many practical applications for the everyday trader.

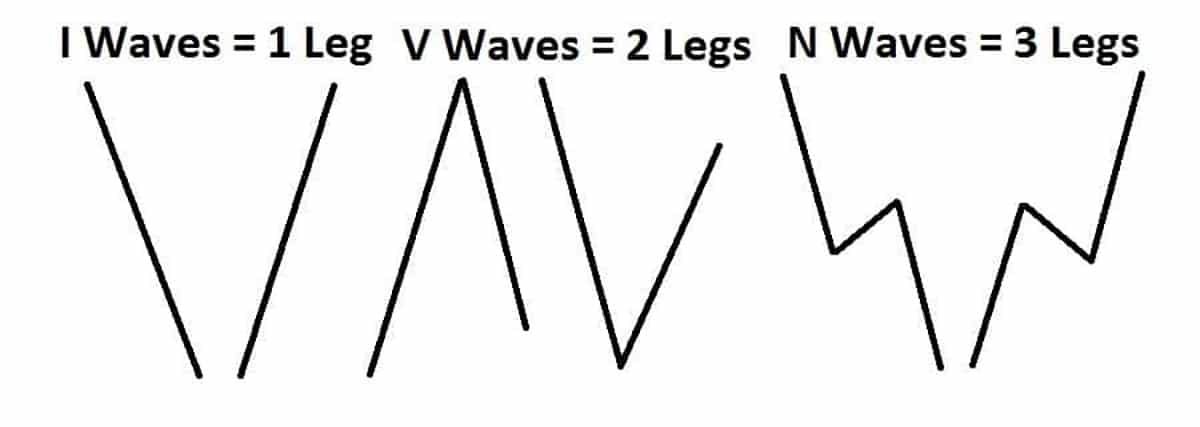
The second pillar of the Ichimoku cloud is Ichimoku wave theory, and this pillar (IMO) has lots of applications for every kind of trader. In Ichimoku wave theory, there are 3 main types of waves, which are simply price action structures that give you more probable directions for the next move. The three waves are I waves (1 leg), V waves (2 legs) and N waves (3 legs).

Ichimoku Cloud Trading 07

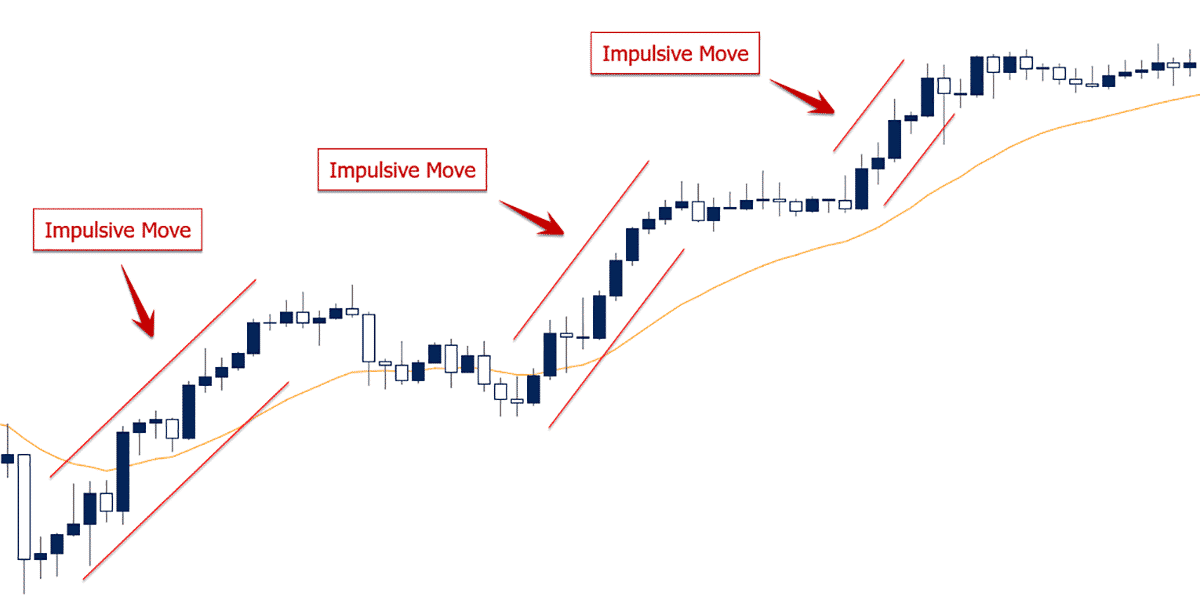
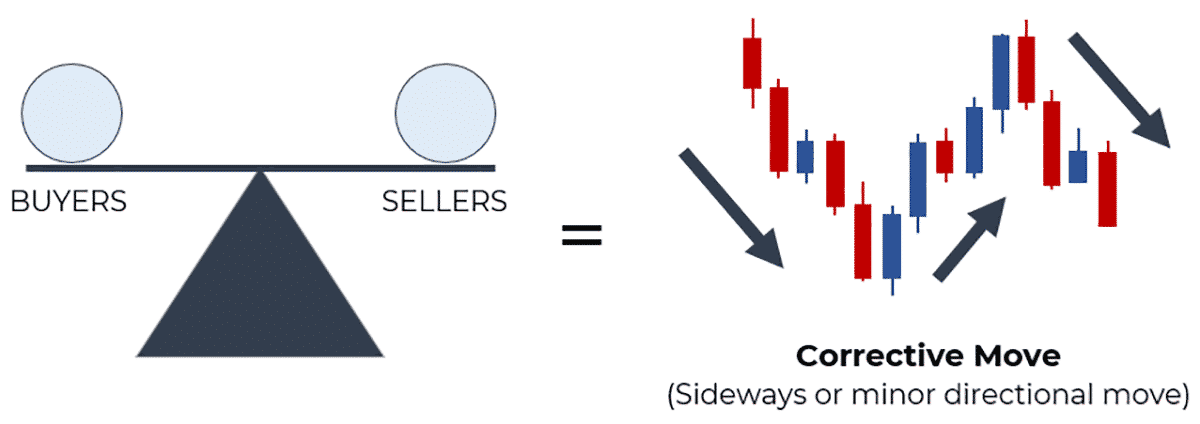
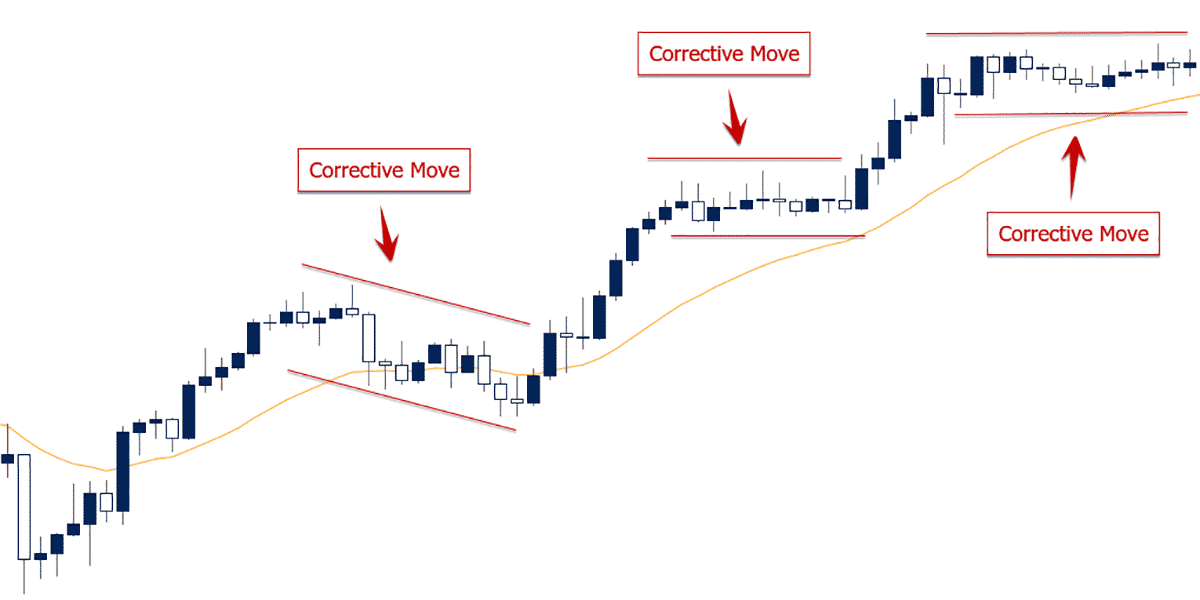
As you can see, any of the 3 types of core waves can be upward or downward in direction. For those of you familiar with my core models of understanding price action and order flow, you’ll see the I waves are impulsive moves, V waves are two impulsive moves in opposite directions, and N waves are impulsive moves, followed by a corrective move, then continuing with another impulsive move in the same direction.

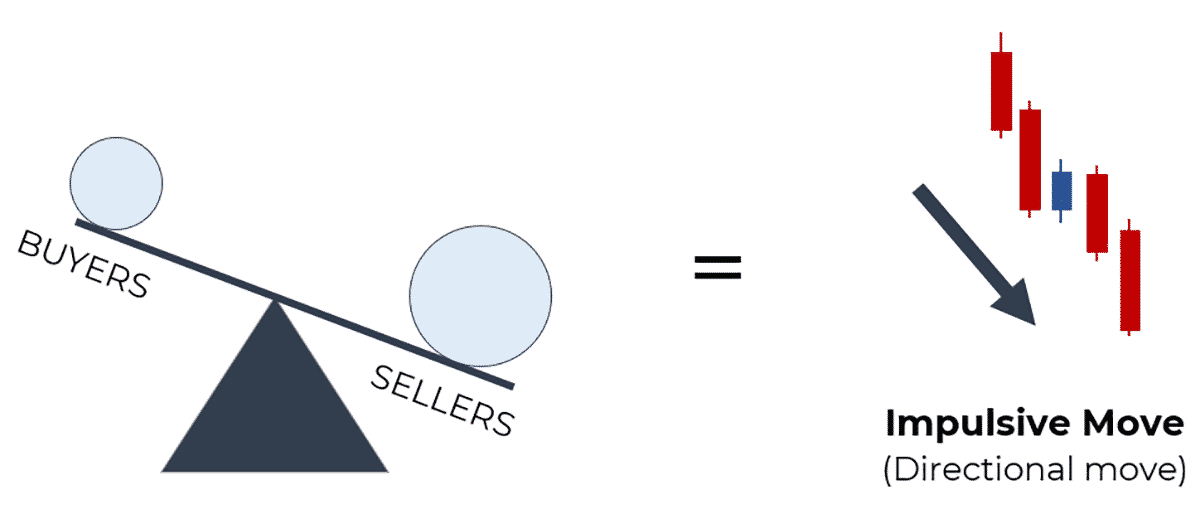
I waves (or impulsive moves) signal a dominant imbalance in the order flow to one side of the market. When there is an imbalance in the order flow to the buy or sell side, the market moves directionally. The stronger the imbalance, the stronger the directional move.

Between the 3 waves, the N wave and V wave are most telling (IMO). Why? Because a V wave is an impulsive move followed by a counter directional impulsive move. This suggests a strong amount of buying (or selling) was met with a counter force of buying (or selling) and thus a strong rejection at the top (or bottom of the V wave).

The N wave on the other hand shows a dominant I wave, followed by a weak pullback (i.e. corrective) followed again with a trend continuation of the first impulsive move. This suggests the direction will continue until you see a disruption in this wave structure, minimally via a counter trend I wave (impulsive move).

There are more complex wave structures such as P waves and Y waves, which are simply expanding and contracting volatility waves, but the core aspects of wave structure are in these 3 waves above.

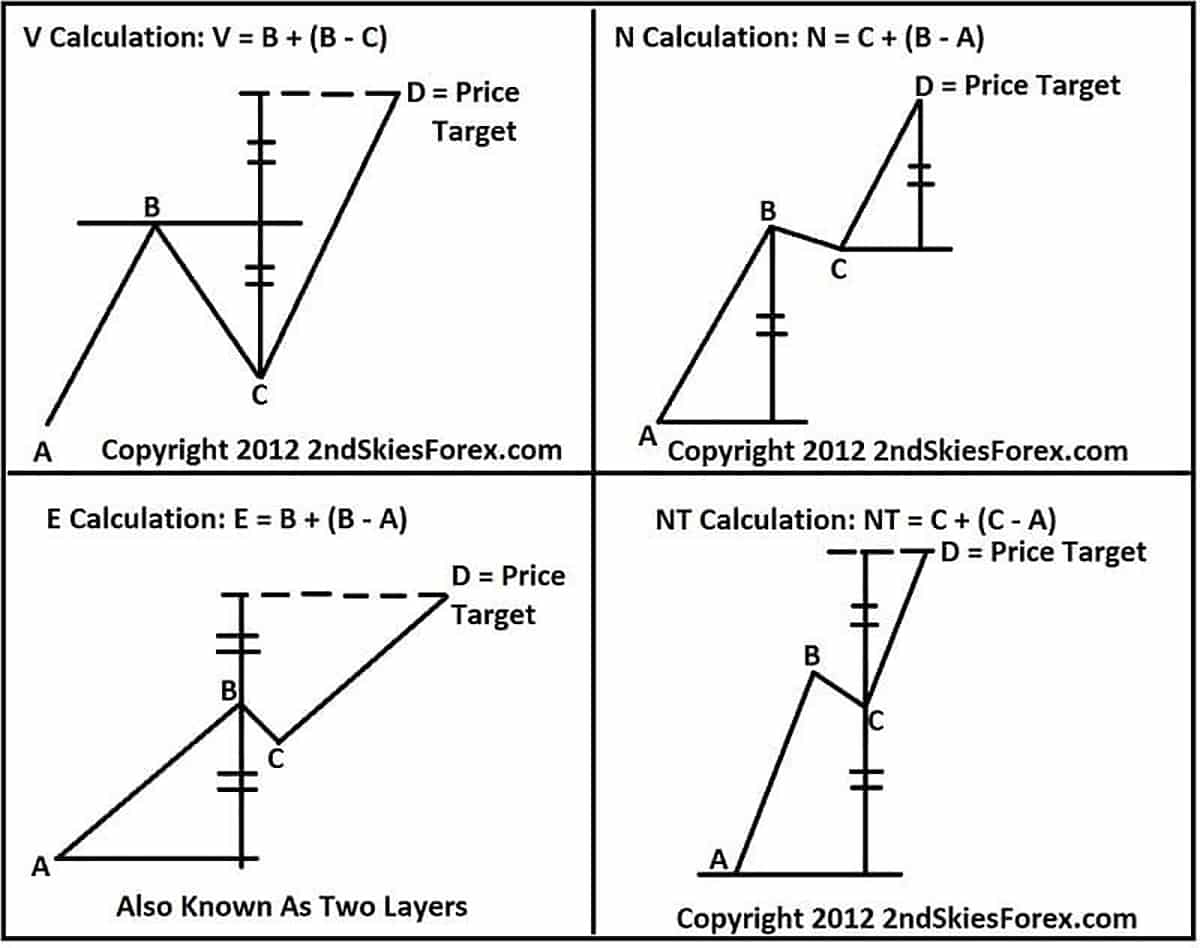
The third pillar of Ichimoku is Ichimoku price theory. The main goal of Ichimoku price theory is to give ‘potential’ future targets for specific moves based upon their price action structure and depth of move. All the price calculations are essentially various types of N waves with varying degrees of pullbacks and retracements before the next likely leg will continue.

The three main price calculations are:

  • The V calculation = B + (B – C)
  • The N calculation = C + (B – A)
  • The E calculation = B + (B – A)

The formulas listed above have corresponding structures and graphs you can see below.

Ichimoku Cloud Trading 08

All the calculations above have 4 legs in the move (A, B, C and D). Ichimoku price theory suggests that based upon the calculation and type of move, D will likely be the target for the move from C.

As you can see from all 3 types (NT calculation is a more nuanced one we don’t really cover), they are all various forms of N waves.
The V calculation has the deepest pullback (C), the N calculation has the least or most shallow (corrective) pullback while the E calculation has a mild pullback, but deeper than the N calculation.

The best way to use these calculations is to find which one most aptly describes the current 3-legged structure you are in, and when you see price bouncing from the C point, use your specific calculation to project a potential target for the next move up.

Our suggestion is to back test this over 100’s of charts across various time frames and see how it works.
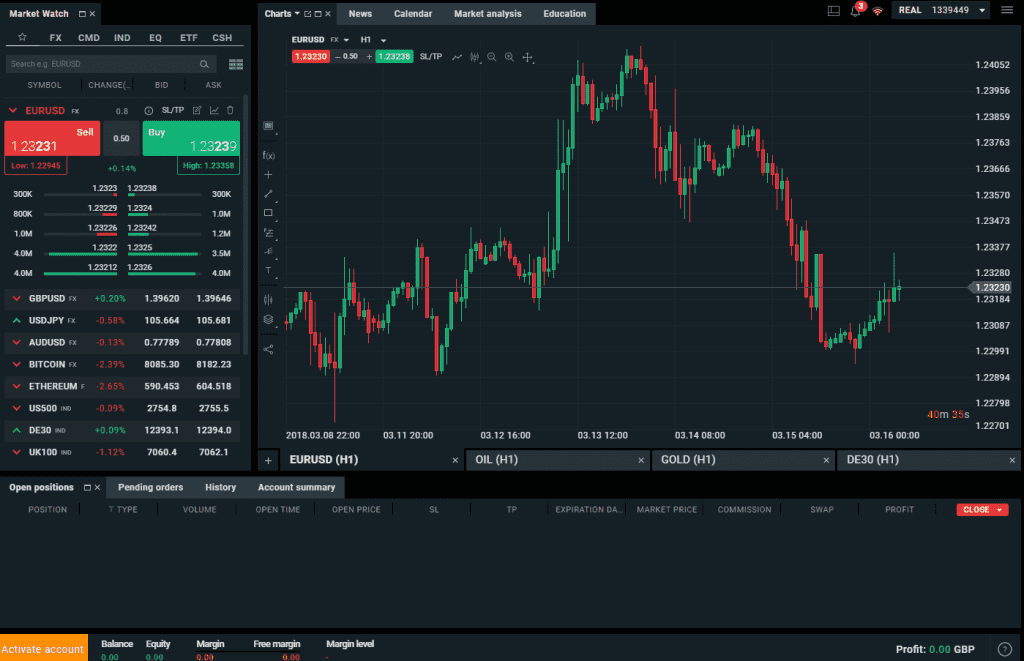
Those are the three main Ichimoku pillars, however very few Ichimoku traders fully understand them, partially due to the original texts being in Japanese and have not been translated into English.

NOTE: We have possession of the original texts and got them directly from Goichi Hosada’s grandson while we were in Japan in 2020.

In Closing

For long term stock investors or swing traders, the Ichimoku cloud can be a valuable technical analysis tool to help you decide potential adding points, swing entries, determine the overall trend, momentum and potential future support and resistance levels.
When you learn to use the 5 lines sufficiently, the long term stock investor or swing trader should be able to use them effectively for understanding what kind of trend you are in, when the market may be turning, and where are potential locations to get into the market at a solid price.
For those of you wanting to dive deeper into the more intermediate and advanced strategies of the Ichimoku cloud, check out our premium advanced Ichimoku course.

In this article, we are going to talk about the traditional definition of price action, how we approach it differently than others, and how you can use price action to trade pretty much any asset class and any time frame

What is Price Action Trading?

In the most traditional and technical sense, price action is simply price’s movement over time. This could be on any time, ranging from the 1-minute chart, all the way up to the monthly chart. Any price change or fluctuation for any instrument is a form of price action. Price action trading is the science and art of trading these price fluctuations over time with few or no indicators. By learning to read price action and price’s movement over time, you can learn to:

  • See where the institutional players are getting involved
  • Where key support and resistance areas are located
  • Where to find precise entry and exit locations
  • When to get out of a trade, add on to a trade or exit for profit
  • How to trade transitions and reversals
  • How to spot breakouts and identify if they have a high probability of working out or not
  • Get into trends early on
  • Identify the overall market conditions and how to position yourself based on that

This is why learning to read price action can (and in our opinion should) be a critical component of one’s trading. However, based on one’s approach to it, there are key differences in how one can trade it.

Various Ways to Approach Price Action

A lot of price action trading techniques you find on the internet these days are based upon candlestick patterns. Some of these patterns can be flags, triangles, double tops and bottoms, pinbars, inside bars, etc.

But if you are trading these patterns just because they are a pattern, then you are really failing to understand what price action is. As already mentioned, the proximate driver of price action is order flow which is the total sum of all buy and sell orders that are executed in the market.

It does not matter whether the market is moving because of a fundamental or technical reason. Order flow is the underlying force and reason why price moves on the chart. Price action has the fingerprints of order flow all over it.

Some markets do offer tools that allow you to read the order flow directly, for example via the DOM (depth of market) or time & sales (T&S) in the stock market. Markets such as the FX market, a market that isn’t centralized, does not offer the same advantage.

Regardless, since the most common driver of market movements comes from order flow, you can learn to read the order flow distribution using price action.

Don’t get me wrong, we also do trade patterns in the markets, such as breakouts for example, but we do so with the key understanding that all price action is the result of order flow. And since order flow is what moves the markets, we have to learn how to read order flow through price action. This is how you can take your trading to the next level.

Good Trading Decisions Are Based Upon Context

If you want to find high probability trades and skip those with a low probability of working out, you’ll need to develop a core skill.

What is this skill you ask?

The core skill we’re referring to is the ability to read the ‘Price Action Context’.

Yes, Price Action Context.

First, in order to make things easier, let’s define the word ‘context’. Context refers to the ability of understanding and approaching a situation based upon the ‘context’ (or environmental variables) around it.

In price action, the ‘context’ is a way of describing the overall environment, and using that to help you trade with the underlying order flow.

Now, before we dive further into how you can analyze the price action context of an instrument, let’s go over the basics of technical analysis as this is a crucial precursor to understanding and being able to read charts properly.

Introduction to Technical Analysis

Okay, so what is technical analysis?

Technical analysis can simply be defined as using technical methods to analyze a stock and use information in a chart to predict what is the more probable direction for the stock in the future. Typically, this is done with a price chart.
While there are many types of charts, the most common and our preferred method is the candlestick chart, which you can see below.

Price Action Trading 01

Those blue and white bars that you see in the chart are called candlesticks or candles. They move up or down based on changes in the price, they have different shapes, with little wicks or lines on the top or bottom.

Each one of these bars/candles represents the stock’s movement for a particular amount of time. For now, we’re going to focus on the very basics of technical analysis, starting with candlesticks.

Before you can really understand a candlestick chart, you must understand what candlesticks represent. To break down candlesticks a little bit further, we’re going to show you a bullish and bearish candle individually and explain what they mean about the stock’s price so you can understand how they work.

NOTE: You can color your candles any colors you want, but typically in most charts, by default, they are going to be green and red.

Price Action Trading 02

This green candle above represents a bullish move for the instrument, and we’ll be showing you a red one shortly that represents a bearish move.

Let’s say this candle is from a daily chart. That means each candle, like the one above, that you see on the price chart equals the stock price’s movement over that entire day. Thus, this green candle represents a bullish day, meaning the stock traded higher for that day.

There are a couple main parts of the candle that you need to understand, which is the body (the ‘boxy’ part of the candle), and then there’s the wicks or little lines at the top and bottom.

The body of the candle will represent the open and the close of the stock price for that day. Since it went up, the bottom part of the candle’s body is called the opening price while the top part is the close. The wicks on top and the bottom represent the highs and lows of that candle or the highest and lowest price of the stock for that particular day.

If you look at this candle and you want to understand what it really means in terms of that stock price, it basically means the stock opened at the bottom of the candle’s body, traded a little bit lower, and at some point in the day, bounced higher, hit the highest price at the top of the wick, and then closed just a little bit off the highs.

Moving over to this red candle, it’s basically the opposite of a bullish candle. Since it is a red candle, we know that it’s a bearish candle, that means the stock price went down for the day.

Price Action Trading 03

Essentially this means this instrument opened at the top of the candlestick’s body, went a little bit higher which is represented by the wick at the top, and then some point in the day, it sold off, went all the way down to the bottom of that wick, and then bounced a little bit and closed a little bit off the lows.

These are the four components, the ‘boxy’ part is the body (price movement between the open & close), and the lines on the top are those of the wicks (price movement between the highs & lows of that time compression).

The top wick will always represent the highest price of the day, and the bottom of the wick pointing downward will always represent the lowest price for that day. That means the bottom of the body is the opening price and the top is the closing price.

For a bearish candle it is just vice versa. The opening price is the top of the body, and the closing price is the low of the body. This is how to read candlesticks.

While it may seem confusing right now, with some practice it will become second nature very soon. Eventually, after looking at enough candles, and soon it’ll just be automatic in your head, you’ll understand it without any sort of thinking.

On the price action charts that we looked at earlier, you can see that candlesticks take many shapes and forms. Don’t be intimidated by this. As soon as you start looking at a bunch of charts, this will become second nature. It won’t be that complicated to read at all.

Okay, now going a little bit deeper into technical analysis and chart reading, there are three main environments in terms of price action:

  • Downtrends
  • Sideways movement (also called ‘ranges)
  • Uptrends

These are the only three things that you can really see on any particular chart.

Price Action Trading 04

Downtrend is very straightforward. That’s when the price of that stock is trending downward over time. A sideways, or what we call ranging market, is when the price is going sideways or stuck, not really going up too high or not really going down too low. It’s stuck between a few prices. An uptrend, simply the opposite of a downtrend. It’s the price of a stock appreciating consistently over time. These are the only three technical environments you can be in at any given time.

Trends, as we mentioned before, downtrends and uptrends, these are just directional moves where the instrument is either being bought up or sold consistently.

NOTE: For those of you wondering about the bull and the bear symbolism, it has to do with how those animals attack. A bull, with its horns, will attack from down to up. It’s attacking upward, hence a bull trend. A bear will attack with its claws swiping down, hence a bear trend. That’s where that terminology comes from.

Now let’s dive a little bit deeper into trends. Even though trends can have an overall upward or downward direction, they can also have what we call swings in the market, where the market swings up or down inside the overall trend.

When you look at the chart below, you see that the overall price is climbing over time, but there are individual pullbacks within that bullish trend. You can see that price is making new higher highs on each move up and new higher lows on pullbacks. These little upward swings are called trend swings.

Price Action Trading 05

To clarify, bullish trends consist of a series of higher swing lows and higher swing highs and bearish trends are made up of a series of lower swing lows and lower swing highs.

Looking at the chart above, you can see that the first pullback in this bull trend finds a bottom and then rallies higher, that’s a swing low. Then it makes a new swing high, pulls back a little bit, and then it makes another swing low. Very straightforward. Just a little bit more nuance to understanding trends.

Ok, so now that we’ve talked about uptrends, downtrends, and swing points, let’s go back to ranges now. A range, as I mentioned, when price moves in a sideways direction, we call that a range because the price is between a high and a low, i.e. between two prices.

In ranges, nobody really is in control of the market between the bulls and the bears. In ranges, price just moves sideways for a period of time, and eventually it’ll break out of that range either to the upside or to the downside.

Price Action Trading 06

Another key aspect of technical analysis and reading candlestick charts is to understand the concept called support and resistance zones. Support zones if you think about it, like when you stand on something, it’s offering support.

A support zone in a stock is when the instrument you’re trading is supported at a particular price or zone, where buyers feel like, “Hey, it’s really cheap at this level. We’re going to keep buying anytime it gets down, and we’re going to buy it and then we’re going to send it back up”. That is a support zone.

Price Action Trading 07

It’s when bulls feel the stock is cheap, they feel it’s a good value, they’re going to continue to buy it because they feel it’s valuable at that particular price. Hence, the instrument is supported by this.
A resistance zone is just the opposite. It’s a ceiling that is hard for the stock to break through in price. This could be because the buyers simply don’t want to buy it at this price as they feel it’s too expensive and sellers feel that “Hey, we feel this stock is expensive at this price, we are going to sell this stock, and therefore provide a temporary ceiling for this stock in terms of price.” These are support and resistance zones. Very straightforward.

Price Action Trading 08

You need to think of them like the floor and ceiling in your house. They provide support or resistance for things to be supported on the downside or capped in terms of how much they can grow to the upside & they only last for a period of time.

There is a lot more to learn about technical analysis and this is just to give you the basics. But for now, if you’re a beginner, you should have a basic foundation in candlestick charts and technical analysis.

Price Action Pyramid

If I had to look at price action as a structure, it would be a pyramid, with the base being how price action is a reflection of order flow (particularly executed transactions).

In our Trading Masterclass, we have 3 major filters to understand price action context and in this article, we’ll talk about 1 of these 3 filters which are impulsive and corrective moves.

Price Action Trading 09

Impulsive Moves

During impulsive moves, the order flow is relatively ‘imbalanced’, meaning it’s dominant towards one side (buying/selling) which causes strong directional moves.

3 characteristics of impulsive moves are:

  • Larger candles
  • Majority of candles are of the same color
  • Candles often close towards the direction of the move

Price Action Trading 10

Below is an example of impulsive moves:

Price Action Trading 11

Impulsive moves are critical to understanding price action context because they communicate a strong ‘imbalance’ in the order flow of the market. The more ‘imbalanced’ the order flow is to one side, the stronger the directional move will likely be.
Impulsive moves communicate critical things to you about your current/potential trades, such as:

  1. Who’s in control of the market (bulls/bears)
  2. If a move/trend is more likely to continue
  3. If there is a potential breakout

By learning about impulsive moves, you can make critical trading decisions to increase your potential profit.

Corrective Moves

Corrective moves are also critical to understanding price action context because they communicate a relative ‘balance’ in the order flow.
3 characteristics of impulsive moves are:

  • Smaller candles
  • Candles close towards the middle
  • Greater mix of bullish/bearish candles (mixed color)

If there is a relatively even number of buyers and sellers (buying/selling in relative equal amounts), the price action and market won’t move much up or down.
For a directional move to happen in the markets, an ‘imbalance’ between the buyers and sellers is required.

Price Action Trading 12

Below is an example of impulsive moves:

Price Action Trading 13

You should be able to notice that the chart above is the same chart in which we marked the impulsive moves earlier. This is a great example of how bullish impulsive moves, followed by corrective moves create a directional movement, i.e. bullish trend.
Corrective moves give you important information about your trades and price action, such as:

  1. When the market is taking a pause (likely to range)
  2. When it is more conducive to play both sides of the market
  3. When you need to be more patient with your trades
  4. Potential trade locations

Learning how to spot and read corrective moves, enables you to optimize your trading decisions and increase your potential profit.

Using Impulsive and Corrective Moves to Discover the Price Action Context

Now that we understand the basics of impulsive and corrective moves, we can use them to discover the price action context of the market.

As a general rule, an impulsive move (the majority of the time), is followed by a corrective move. For example, a with-trend impulsive move, followed by a corrective move, is more likely to be followed by another with-trend impulsive move than the opposite (counter-trend).

Now, what do impulsive and corrective moves teach us about price action context?

They give us an underlying sense of what the dominant order flow is.

If you see a potential trend in place, along with a good series of impulsive and corrective moves, then you can feel confident the order flow is imbalanced towards the bullish side (bullish PA context), and thus you should be looking to buy more often than sell.

Want To Learn More About Price Action Context?

While impulsive and corrective moves are a crucial part to determining price action context, they are only one tool in the took-kit our students use to achieve this.

We have two other key factors to determine price action context and in which direction the dominant order flow in the market is imbalanced towards.

To learn more about these two, plus much more, like reversal patterns and ways to increase the accuracy of your entry locations, check out our Trading Masterclass where we teach you how to analyze higher-, lower- and multiple time frame contexts with clear rules to understand them.

In fact, our entire 1st section of lessons is dedicated specifically towards understanding price action context. Inside the course, you’ll also learn how to read other critical (and more advanced) price action structures to help you find high probability trade setups.

If you’re currently learning/trading a price action strategy or approach that only works on specific time frames or instruments, then it’s a limited strategy that doesn’t really understand how price action or price action context works

If you want to learn how to read the markets in real time instead, find more and better trade opportunities, increase your profit potential and at the same time boost the quality of your learning process, make sure to check out our Trading Masterclass.

What’s Inside?

  • What is the xStation5 platform?
  • What are the key features of this forex and multi-asset class trading platform?
  • How does the charting, feature and technical analysis of the xStation5 compare to other platforms?

xStation 5 Platform Intro

Late last year, I was starting the process of looking for a new broker and platform to trade with. While I’ve been trading with SaxoBank’s platform (SaxoTrader Go & SaxoTrader Pro) during the last 3 years, I felt there were certain features that were missing which (IMO) were necessary for my trading operations.

I eventually stumbled upon the xStation 5 platform, and from the first few moments of using it, I realized it was one of the best platforms I have worked with over the years.

When I’m trading on any platform, there are two main areas I am evaluating every platform on. They are:

  1. Functionality – does the platform offer the functions/functionality I need to perform my trading operations on a daily basis? This could range from the simple aspects of trading/execution, to charting to analysis/statistics on my performance, etc.
  2. UX (User Experience) – what is the user experience when I start working with the charts? Are they intuitive/easy to use? Or are they bulky and confusing? Do I have to do several clicks for a simple operation that should/could be done in 1 click? And is it easy to switch from task to task?

If the above two criteria are met with my requirements for any trading platform, then I engage in a further process of experimentation and discovery with the platform using it for several months before I park my money with any broker.

I don’t want to be learning how to drive a sports car on the race track. The same goes for trading.

After working with the xStation 5 platform, I can honestly say this is a platform I’d want to trade $1MM+ of funds with and feel it can satisfy 99% of everything I’d need/want to do with trading.

FYI, the platform is available in many languages, such as:

English
Polish
Czech
German
Spanish
French
Hungarian
Italian
Portuguese
Romanian
Slovenian
Turkish
Chinese
Japanese

And you can trade the following instruments/asset classes on the xStation 5 platform:

Forex
Global Indices
Commodities
Stock CFD’s
ETF CFD’s
Crypto Currencies

xStation 5 Platform UX/Functionality

Now that I’ve shared my personal take on using the xStation 5 platform over the last 6 months, it’s time to get into the UX, functionality, along with the pros/cons of it.

The xStation 5 platform is a web based trading platform, which IMO is where platform technology is moving.

This is the xStation 5 platform when you login.

xstation-5-base-platform-image-2

From the moment I opened the xStation 5 platform, I was super impressed by how easy it was to use and navigate. I didn’t watch a single video, nor read one tutorial on how to use it, yet I was able to do 90+% of everything I wanted to within minutes.

The main color themes it comes in are black and white (I prefer white).

Below is what they call the ‘Market Watch‘ screen which is one of the ways you can place a trade.

xstation-market-watch

It is fully customizable by instrument and asset class which you can seamlessly change through. You can also search directly in this market watch section for any of the 2000 instruments available.

I also like how they group the different sub-categories within each asset class. So for trading forex pairs, they have it broken down into major forex pairs, minors, and EM (emerging market) pairs.

Stock traders will also love this as they have the stock selections separated by country (see below).

xstation-stock-market-watch

The easiest way to describe the market watch UX and functionality is simply ‘user-friendly‘.

xStation 5 Charting

Next is the charting features which are either embedded within the platform, or can be detached so you can put your charts on a separate monitor.

I prefer this setup because I trade with several monitors (3) and like to have my platform on one monitor, and my charting on another.

You can open several tabs/charts which can be viewed individually (full screen) like the one below:

xstation-individual-chart

…or have them in a grid of your choosing.

xstation-grid-chart-image

Do you noticed that ‘+‘ sign in the bottom left of the chart? That is what you click on to add a chart.

The charts are flexible, customizable and easy to learn. Any newcomer to the xStation platform should be able to figure out most charting operations within minutes.

I won’t go into all the charting features available, but by and large, I’ve yet to see a chart feature I need on a day to day basis that this platform doesn’t offer.

Open Positions & Pending Orders

Your open positions tab is pretty straight forward and customizable so you can add/delete certain data points at your discretion.

xstation open-positions-tab

NOTE: Those are a couple of my open trades. You’ll notice both are in profit 😉

xStation 5 News/Calendar/Analysis/Education

Rounding off some of the standard features in most platforms today are the news/calendar/analysis/education features.

They provide up to date news in the global markets so you can stay apprised of any market moving announcements or data coming out.

The calendar is simple, intuitive and will give you all the economic announcements per country, time, currency its most related to, along with the forecast, previous numbers and actual posted numbers.

Market Sentiment

Market Sentiment is a really interesting feature as it displays the overall open position status for all of XTB’s clients.

xstation-market-sentiment

Top Movers

Top Movers shows you which instruments had the biggest moves % wise per day/week/month which I find to be a very helpful feature to spot where volatility is increasing and thus providing potential trade setups.

xstation-stock-trading-analysis

Stock Trading Analysis

Stock traders will love the stock scanner which shows the instruments of your choice by country/industries, and allows you to narrow down what you’re watching based upon market cap, EPS, P/E values, dividends, ROE and BETA.

xstation-stock-scanner

The heat map is just an extension of the top movers in a different graphical form.

There is also a small amount of educational videos and a trade history showing all your closed trades. The education section is somewhat limited, but the history tab is easy to understand and you can export your data to an excel/CSV file.

Trading Statistics

Lastly, the platform offers you some trading statistics, such as:

  • Overall profit/loss
  • Broken down by instrument
  • % Accuracy (all/buy only/sell only)
  • Avg. Trade Duration
  • Avg./Max consecutive winning/losing trades
  • Avg./Max profit/loss on winning/losing trades

While I would like any platform to offer more trading statistics than this, I find it sufficient for any beginning/intermediate trader to work with.

In Summary

Overall I find the xStation 5 platform to be one of the most user-friendly platforms available today whether you are a retail or professional trader. All but the institutional trader will find this platform with one can need/use/want.

You can seamlessly navigate between the different panels which makes your every day user functions and experience feel effortless. I feel they could improve their offerings for automatic trading and back testing strategies, but the overall UX/functionality makes this platform a must try for all but the most algorithmic heavy traders.

Hence if you haven’t tried the xStation 5 platform, I’d highly recommend you give it a go and see what your experience is using it. Compared to MT4/5, I find this to be a superior platform for everyone but algo/EA traders.

If you’d like to sign up for a free demo account, you can click on any of the two links below:

For UK/EU Clients, click here
For Non-UK/EU Clients, click here

BONUS OFFERING: If you’d like to get my price action course for FREE, you can do so by clicking on this link to learn more about the requirements.

Full Disclosure: 2ndSkiesForex does not receive any fees/commissions/remunerations based upon your trading activity with XTB. We may receive a 1x fee for referring any new clients who open up an account with XTB and fulfill certain requirements.

With that being said, please make sure to leave a comment along with your feedback from using this platform below.

Until then – I sincerely wish you real growth and success in your trading.