Chris Capre’s current open price action and ichimoku trades: EURUSD, GBPUSD, USDMXN, USDJPY, BIR, TL

NOTE: How do you know if you’re taking the right steps to make money trading, or skipping steps you shouldn’t? If you want to know, read my latest article The 4 Stages of Becoming A Millionaire Trader.

GBPJPY – Strong Rejection + False Break @ LT Support (Daily chart)

Price Action Context

After the flash crash in early January, bulls heavily rejected lower prices, resulting in a false break of two LT support zones (only upper one shown in chart). If bulls successfully can defend the closest LT support, a move higher towards 148.60 is likely IMO.
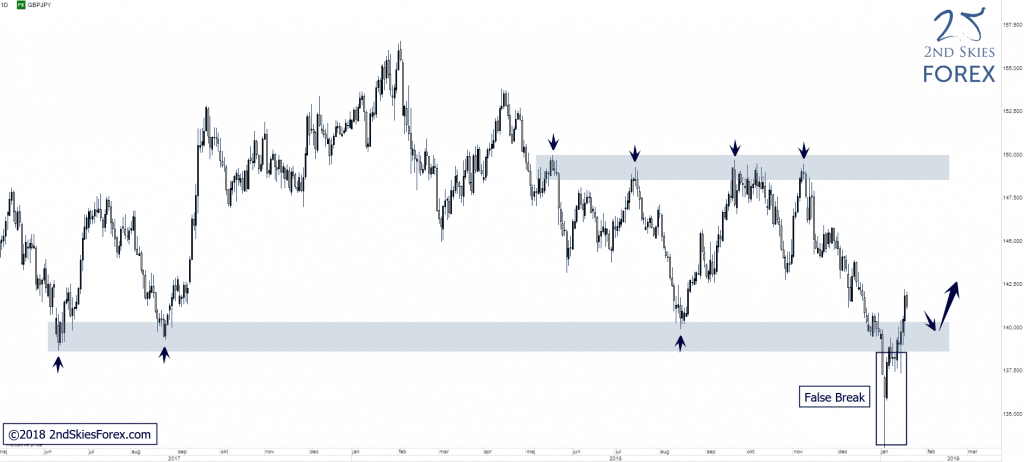
forex-gbpjpy-trade-setups-2ndskiesforex

Trending Analysis

Bias changed to neutral and bulls can look for potential trading locations on weak pullbacks into the LT key support.

Key Support & Resistance Zones

R: 148.60 – 150.00
S: 138.60 – 140.30

Stay tuned to the members market commentary for updates.

******

DAX – MT Trend Reversal, Broken Above MT Resistance (4h chart)

Price Action Context

After an initial CT impulsive move, followed by a corrective structure, which often is an early indication of a potential trend reversal, bulls ultimately managed to push through a key MT resistance zone on Friday, clearly closing above the zone ending the trading week.
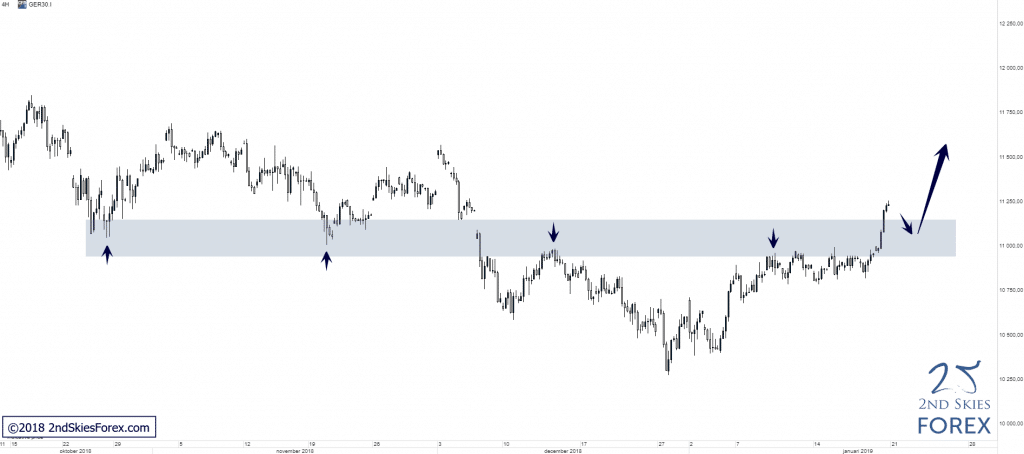
dax-technical-analysis-2ndskiesforex

Trending Analysis

MT bias changes to bullish and ST/MT bulls can look out for possible trading opportunities on weak pullbacks into the S/R zone (now support).

Key Support & Resistance Zones

R: 11 700 – 11 950 [LT]
S: 10 950– 11 150

******

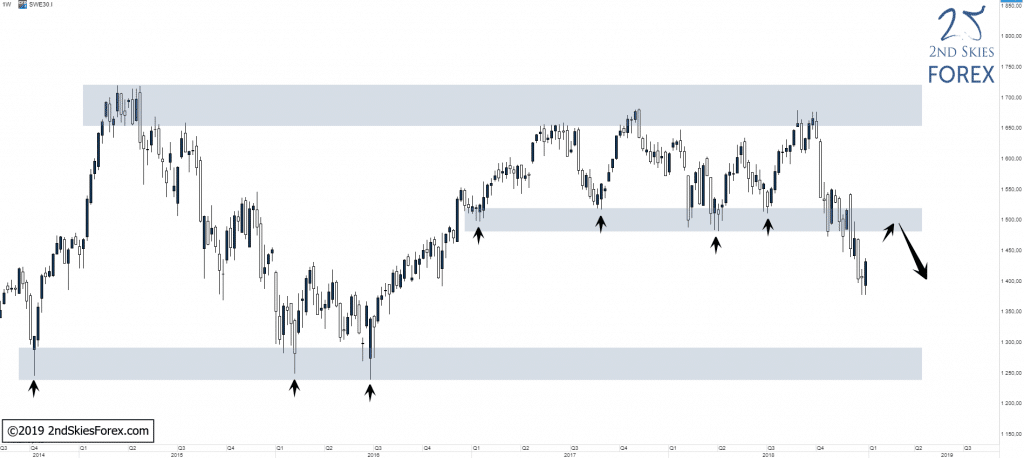
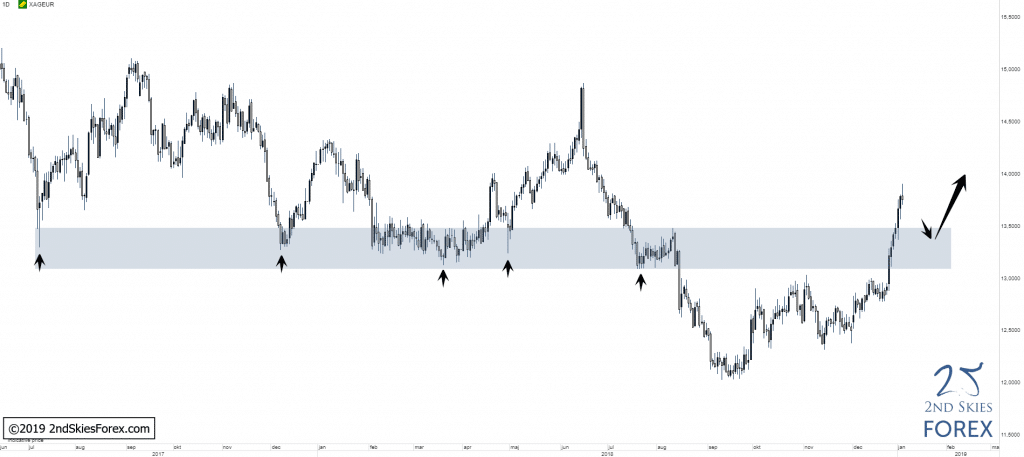
WTI – Strong Close @ LT Key Resistance (Weekly chart)

Price Action Context

Between early October and late December last year, WTI sold off roughly -40%, all the way to a major multi-year support level. The support produced a very strong rejection/bounce that has taken price all the way up to the closest key resistance with a very strong close right at the zone ending the trading week.
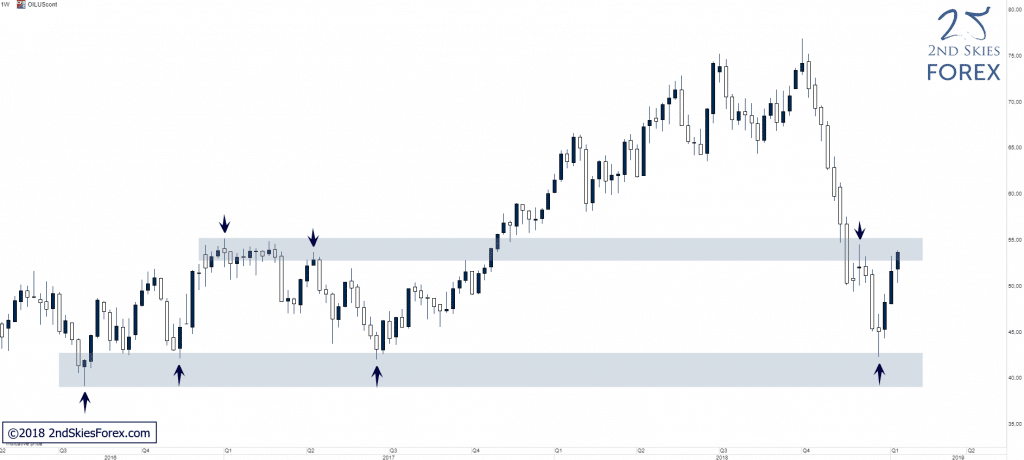
wti-oil-technical-analysis-2ndskiesforex

Trending Analysis

LT bias is bearish and if the resistance holds, a move down towards the key support is likely, whilst A failure of the resistance on the other hand would technically open up for a continuation towards 59.00.

Key Support & Resistance Zones

R: 53.20 – 55.20
S: 39.00 – 42.80


Chris current open positions: EURUSD, GBPUSD, USDJPY, USDMXN, BIR, TL

NOTE: Not sure what to work on as a trader to get better, or how to progress? Read my latest article The 4 Stages of To Becoming A Millionaire Trader

EURUSD – Holding Below Multi-Year S/R Zone (Weekly chart)

Price Action Context

Long term, not much has changes since we covered the LT context on this pair on the 18th of November last year . Price did break out to the upside of the MT corrective structure we mentioned on the 8th of January, pushed deeper into the LT resistance, only to get rejected heavily within the LT resistance, with price quickly selling off 100 pips again before markets closed for the week.

forex-eurusd-technical-analysis-2ndskiesforex

Trending Analysis

LT bias is bearish and bears can look for possible trading locations around the LT resistance, alternatively look out for potential LTF structures and/or reversals forming that can be used to get involved in a likely move lower.

Key Support & Resistance Zones

R: 1.1400 – 1.1580
S: 1.0350 – 1.0530

Stay tuned with our members market commentary for updates.

******

CADJPY – Massive False Break @ Key Support (Daily chart)

Price Action Context

The recent flash crash across currencies took the pair all the way down to 75.00 and a major multi-year support at which price got heavily rejected, taking price back above the LT key support level again which goes back to early 2017.

forex-cadjpy-price-action-2ndskiesforex


Trending Analysis

LT bias is neutral at this point IMO with the LT support offering potential buying opportunities to get involved in a likely move higher towards 87.00.

Key Support & Resistance Zones

R: 86.30 – 87.40
S: 80.40 – 81.70

******

CAC40 – Pulling Back Towards Broken LT Support, Now Resistance (Weekly chart)

Price Action Context

The multi-year support ultimately failed as more bears piled in, taking the index to prices not seen since late 2016 and over the last three weeks, price has been in a CT corrective pullback, heading towards the broken support zone which now should act as resistance.

cac-40-technical-analysis-2ndskiesforex

Trending Analysis

LT bias is bearish and sellers can look for potential shorting opportunities on pullbacks into the resistance.

Key Support & Resistance Zones

R: 4 900 – 5 070
S: 3 800 – 4 070

Chris Capre’s current open price action and ichimoku trades: EURUSD, GBPUSD, USDMXN, USDJPY, BIR, TLS

NOTE: Wondering what stage you are at in trading, and how to progress to the next level? Read my latest article The 4 Stages of Becoming A Millionaire Trader.

USDJPY – LT Support Holding For Now (Daily chart)

Price Action Context

Bears did stay in control after breaking below the MT support we mentioned on the 23rd of October, and during the last week, price continued to sell off heavily. But despite the flash crash towards the end of the week, the LT support we’ve talked about in earlier member market commentaries as well seems to be holding for now, with price closing back above the zone ending the week.

Trending Analysis

LT bias remains neutral while inside the LT range and LT traders can look for potential trading opportunities around the top/bottom of the LCS.

Key Support & Resistance Zones [LT]

R: 114.30 – 115.50
S: 107.30 – 108.30

Stay tuned to the members daily trade ideas for updates.

******

OMX30 – Broken Through LT Key Support (Weekly chart)

Price Action Context

The continuation after the bullish reaction to the LT key support level never manifested, and instead bears stepped on the gas, pushing price through the key support and additionally -100 points lower in the process, giving bulls a hard time.

omx-technical-analysis-2ndskiesforex

Trending Analysis

LT bias changed to bearish after the break of the LT support and if bears can stay in control, a move down towards the bottom of the bigger multi-year range is likely IMO. Weak pullbacks towards the broken support which now should act as resistance can offer potential shorting opportunities.

Watch the price action on the daily, 4hr and 1hr charts for potential trade setups.

Key Support & Resistance Zones

R: 20 200 – 21 000
S: 14 800 – 15 900

******

XAGEUR – Broken Back Above LT S/R Zone (Daily chart)

Price Action Context

After bouncing from the multi-year support we’ve talked about in earlier market commentaries, bulls have now pushed the precious metal back above the LT resistance which now should act as support again.

IMO this changes the price action context MT to bullish.

gold-eur-2ndskiesforex-trade-setups

Trending Analysis

LT bias changed to bullish and bulls can look for potential trading opportunities on weak corrective pullbacks into the key support zone.

Key Support & Resistance Zones

R: 14.70 – 15.10
S: 13.10 – 13.50