Chris Capre’s Top Trade Ideas for 2019
Last year I did a top trade ideas for 2018, and now that I’m really centering my new year’s around losar, it’s time for a new trade ideas for this year. But before we jump into that, we need to hold my feet to the fire and see how I did last year. Let’s jump in and review.
2018 Top Trade Ideas Reviewed
I gave 3 trade setups and ideas free to the public which are below.
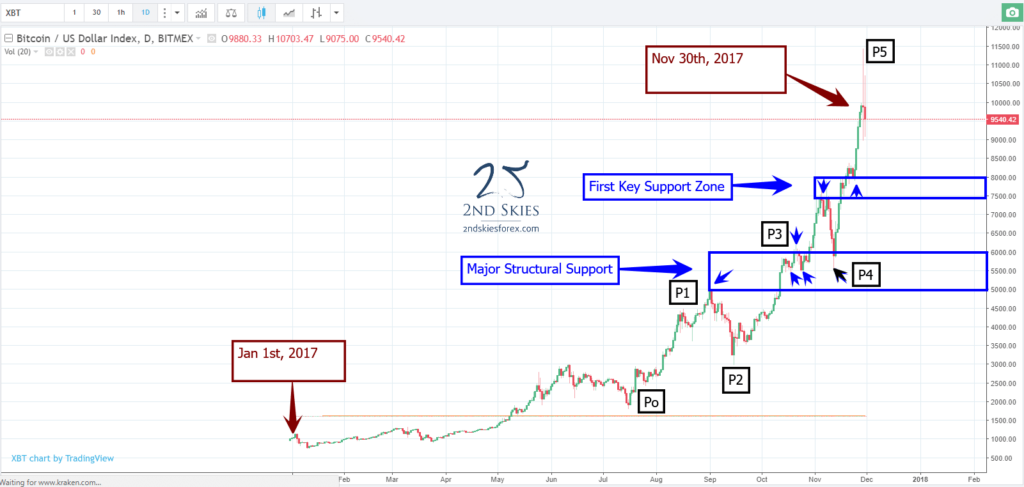
2018 Trade Idea #1: BTCUSD Will Hit 20K
Here is the chart before my trade recommendation (image below).
And here is the chart after.
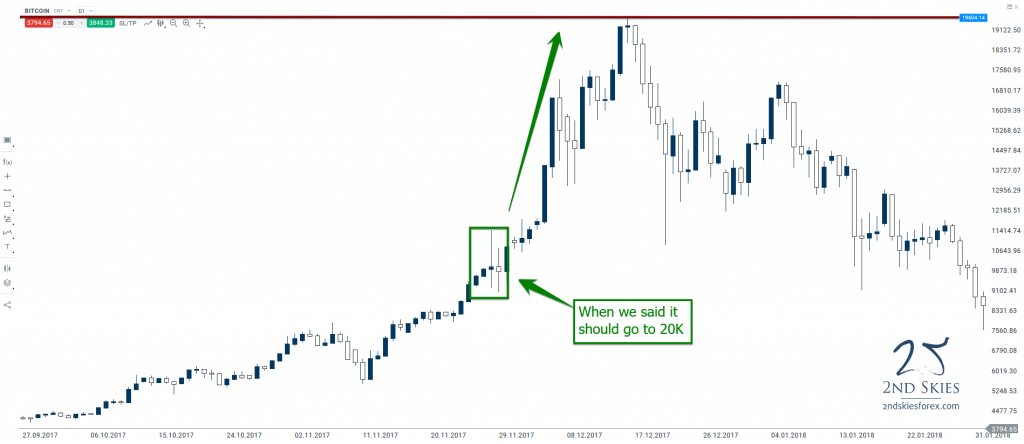
How close did I get? It got within $50 of 20K, or .2% from my target while gaining about 80% from its price near 11K.
The Verdict: A Win. Hard to argue otherwise.
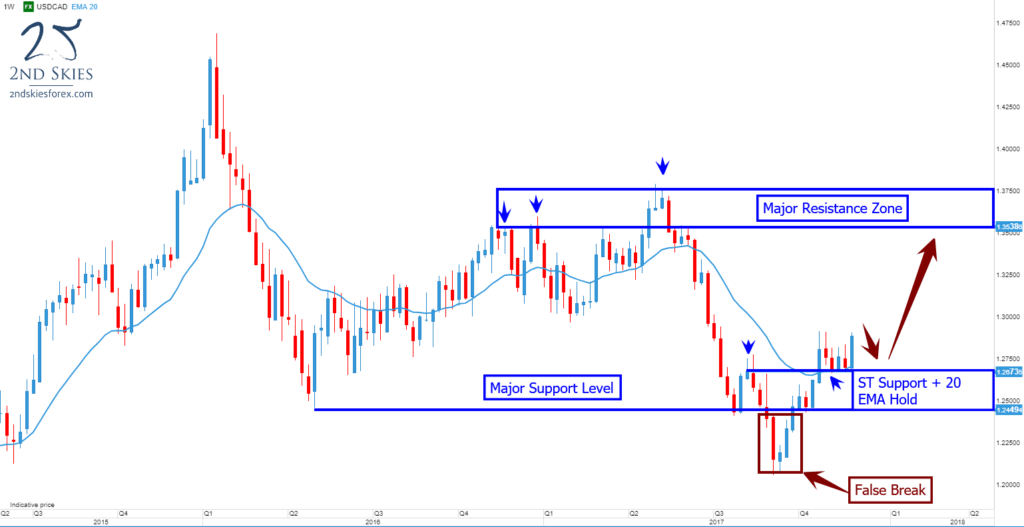
2018 Trade Idea #2: USDCAD Should Pullback And Then Hit 1.35
As we mentioned in our trade ideas, we felt like the false break provided us with a bullish trade signal and that prices should go higher targeting 1.35 and perhaps 1.37+
Here is the chart at the time of the trade recommendation.
And here is the chart after.
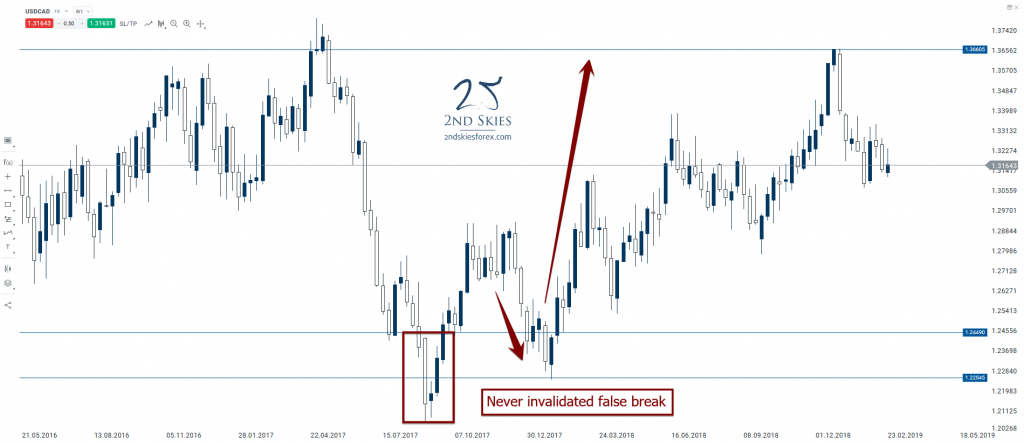
The Verdict: Overall, a win. The false break structure was never violated.
2018 Trade Idea #3: Alibaba Is Going to $300
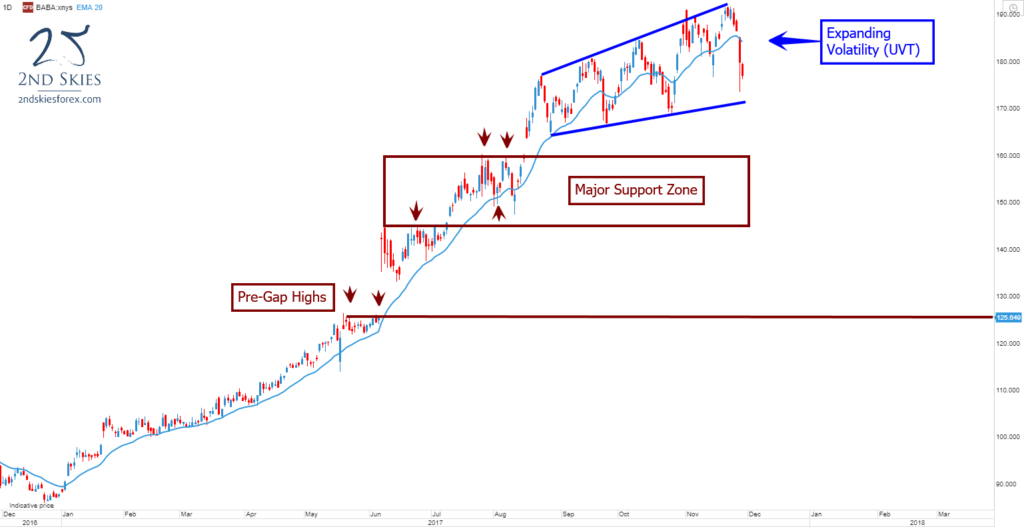
At the time of the post last year, I felt like the increasing volatility was suggesting an unclean volatile trend, but that overall prices should go higher towards $300.
Here is the chart I had from last year.
And here is the chart after.
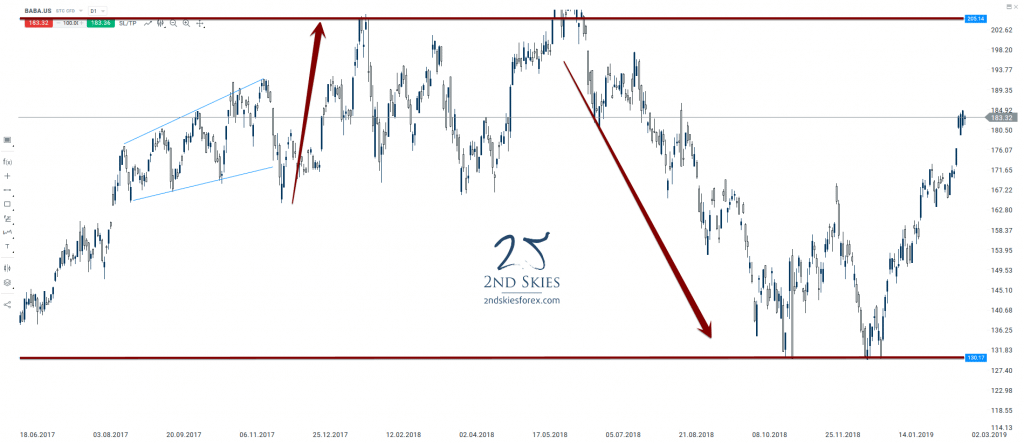
The Verdict: Definitely a loss. I was clearly wrong on this one.
Now that we’ve gone through the 2018 trade ideas, let’s move onto 2019.
Top Trade Ideas for 2019
#1 Facebook Has Peaked, Looking to Sell
A lot has happened for big tech this last year. While Amazon is coming under greater scrutiny, along with Google, Facebook has been the bad apple causing the biggest problems for big tech.
Scandal after scandal has come out, and IMO it’s really starting to weigh on investor sentiment, employee morale, and long term prospects for the company. I recently had a conversation with my friends daughter who is in High School. We talked about FB, and she flat out said, “Most people my age don’t really use FB that much anymore, and it’s not that popular“. So the newest generation of people are becoming less and less interested in FB. That is telling sign IMO.
When I look at the charts, I see a stock that had very little resistance or selling from 2013 (around $25 a share) to $212 a share. And then shit started to get real.
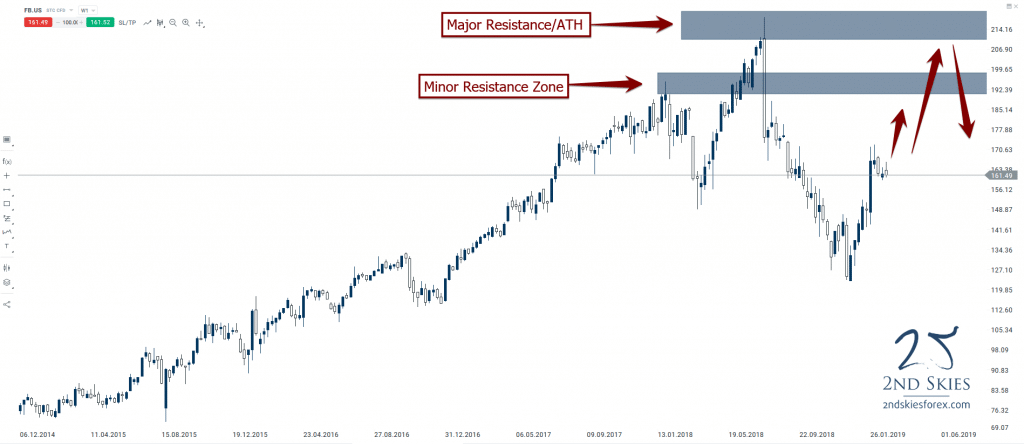
After spiking north of $212 to $218, Facebook had had its largest one week drop on record closing at $175. That one week of selling took out the prior 12 weeks of gains, and we haven’t seen $200 since. It sold off for 2 out of every 3 weeks right around the time the Cambridge Analytica scandal broke. It’s low last year was around $123, which is a whopping 43% drop in a matter of 5 mos. This peak to trough movement took out all the gains from 2018, 17′ and most of 16′.
The stock (like most indices) has rebounded well this year, but remember, when making all time highs year after year, there’s very little resistance on the way up. The 2nd time around, there will be resistance and sellers waiting.
Turning to the price action, and considering the above, I want to be selling on rallies. The earliest (and most aggressive) location I’ll consider selling, perhaps a small position, will be between 183 and 193 which is the first major resistance zone marked on the chart.
The second key resistance zone is notable the all time highs between 210 and 218. Downside I wouldn’t be surprised to see 150 and then 122 revisited. If more scandals break, and other big fines are levied on the Zuckerberg darling, we could be witnessing the peak of FB.
#2 ASX 200 – Approaching Major Resistance & ATH
Since the 2007 peak of 6877, along with the subsequent sell-off, the ASX 200 has never breached the 07′ peak, nor visited it once. However since 2008, the major Australian index has been climbing steadily, gaining virtually 2 out of every 3 months with a continuous building of higher lows and higher highs.
The index however is approaching some major resistance coming up with the 2018 peak ~6356, and then the 07′ peak of 6877.
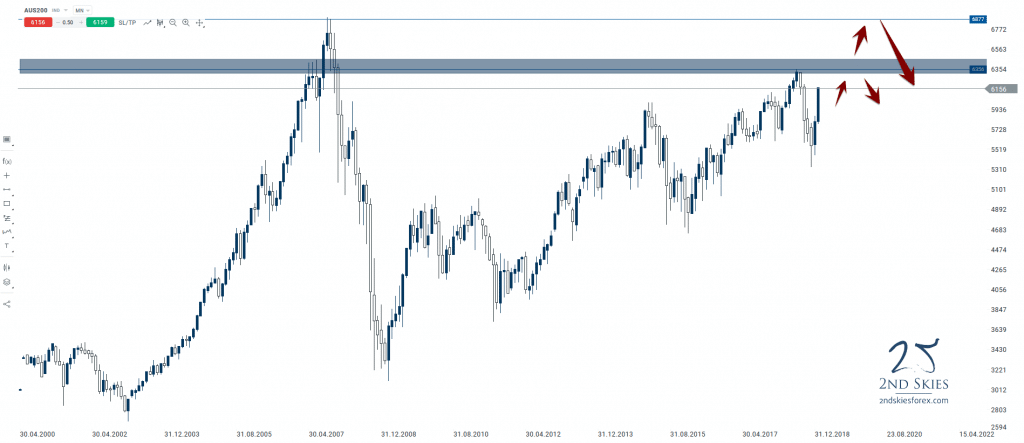
It’s hard to imagine a scenario where it just blasts through either the first, or second zone without finding some sellers, and thus presenting a short opportunity.
If the first zone on the chart fails, then I’ll definitely be looking to sell near the 6877 peak, targeting first the zone below it, and potentially a larger sell-off towards 5400, possibly sub 5000.
We’re getting into rarified air here, so hard not to look for a short opportunity. ST the index looks bullish and is posting a strong start to the year. But offers are likely parked above where I suspect we’ll see a real challenge to this ST bull run.
#3 USDJPY – Range Structures + Resistance Ahead
Since Feb 2016, the USDJPY has not had a weekly close above 118.45, and nothing above 115.90 since late 2016. 114.29, which is a major resistance level above has been tagged about 5-6x over the last 3 years, all resulting in 600+ pip rejections.
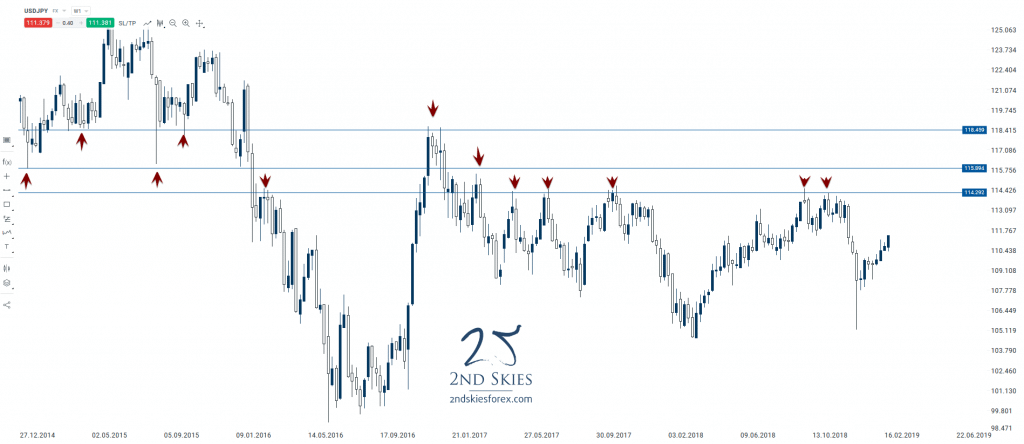
IMO, one of these levels is likely to present a solid level of resistance, and keep the range structures intact.
Hence I’m looking to sell, either at 114.29, 115.89. or 118.45. Shoot, I might even sell at all 3 levels, but my suspicion is one of these levels will hold, and present a great selling opportunity.
For the downside, I’ll be looking to target the bottom of the range structure which comes in initially near 108.75, then 105.
******
For our course members last year, we did a total of 10 top trade ideas for 2018. We’ll be doing the same for our members over the weekend in a video which I’ll post in the coming days.
Until then, I hope you enjoyed these trade ideas, and that you have a great end to your trading week and month for February.
