Intraday Price Action Trading – Reading Forex Price Action
Today had produced some interesting price action plays, so I wanted to share with you two trades that I took today. I am going to break down exactly what I was reading from a forex price action perspective, what my analysis was, how I took each trade, including the entries, stops and limits, and why I chose them based on what I was seeing in the price action.
While the NZDUSD has been stuck in a range for the last two days, I have been playing the consolidation range which has held up nicely. Being that the Kiwi tends to be a little slow at times moving at a tortuga pace, I noticed a few price action setups in Silver (XAGUSD) and took a couple of intraday plays. It is these two intraday trades I am going to be dissecting for you from a forex price action perspective. I am also going to be sharing how I used quantitative price action data on the intraday volatility for Silver to aid my trades.
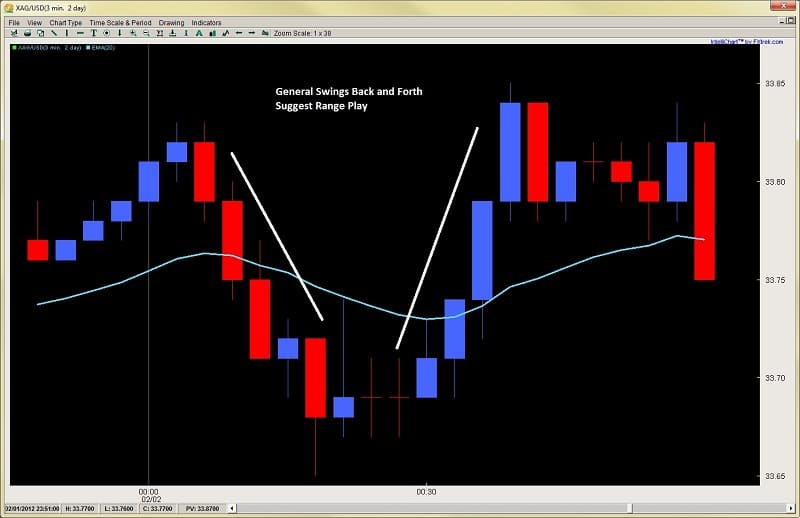
Taking a look at the chart below (3min on silver), following the grey vertical line which represents the London open, we can see price starts out a little choppy. For the first hour, price action stays within a $.20 range which is actually less than the normal volatility for this pair of $.30 for the first hour of the London session. This communicates to me there is actually very little directional dominance being a 33% lower range of volatility. If this continues, then I will look for a reversion to the mean play.
Why? Since no one dominant player is directing the market, there is still a tug of war going on with both sides being relatively equal. This means price will continue to revert back to the mean until someone takes control. Thus, I will look for reversal plays. As you can see by the price action, the small swing down was about the same strength as the small swing up.
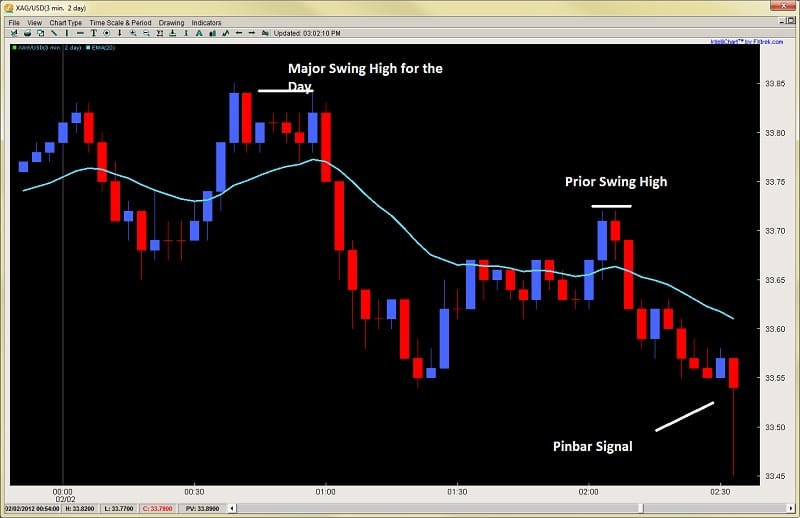
At about the 2.30 mark (2.3hrs into London session), I got a pinbar formation. This is a reversal signal and definitely leaves me the chance to make my reversal play. However, I hold on the trade for two reasons;
1) If I took the trade on the open of the next candle, my stop would have needed to be about $.10 and my target to the last swing high would have only been about $.15 for a 1.5:1 Reward to Risk ratio.
2) The market structure has not given me a HL (higher low) which would have confirmed to me the market structure was changing and that I had a reversal buy in play.
These two things combined told me to put the trade on hold so I passed. Look at the chart below to see the resulting price action.
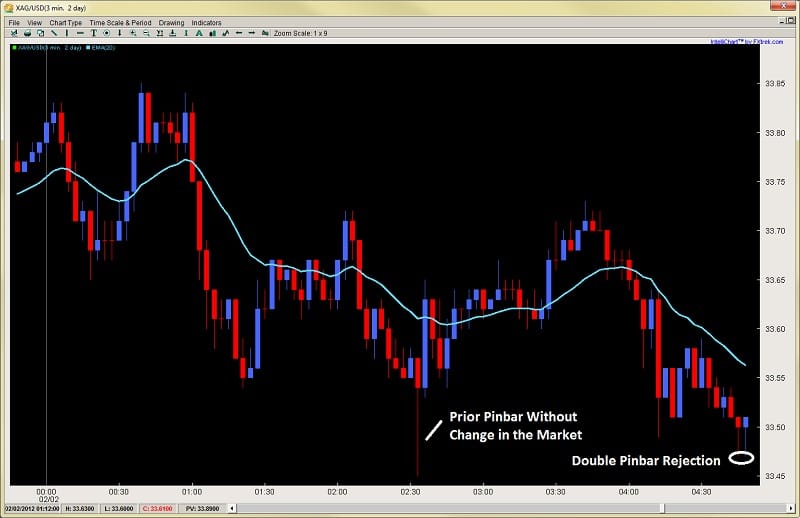
Initially, when the price action hit the prior SH (swing high), it sold off at a steady pace. But noticed how it picked up with a very large red bar toward the end, making a quick rejection low. This increase in the size of the bar communicated stronger selling participation. But it also had a small rejection to the downside followed by a gentle pullback (perhaps exhaustion). This was a small clue there might be orders close to the lows of the prior pinbar, so I watched for the price action to give me a lower low.
As you can see at the very end of the chart, it did, forming a double-pinbar. This double-pinbar formation communicated to me from a price action perspective two things;
1) not only was the first pinbar rejection a likely higher low offering me a good R:R play, but…
2) the second rejection was telling me after price made the first pinbar rejection, the market tried a second attempt to make a new low and failed. It failed at exactly the same price yet this time closed up on the bar.
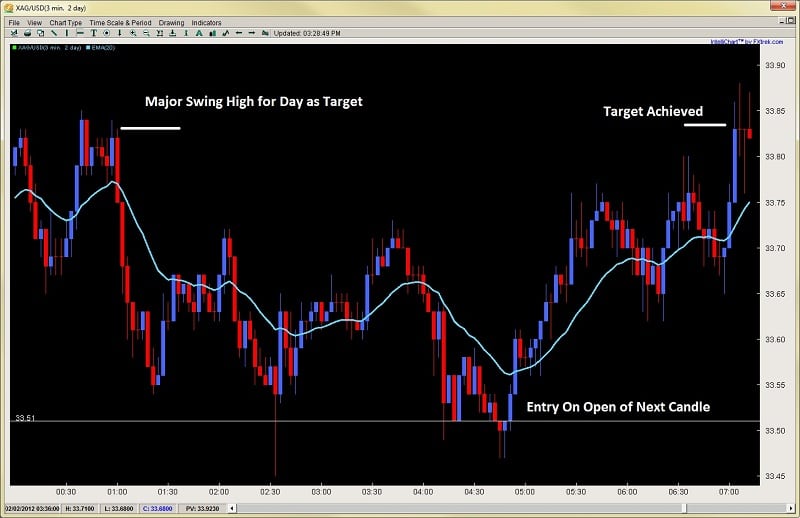
Combine this with the fact price was still staying below its normal intraday volatility levels, and I had all the ingredients for a nice reversal play. All these together suggested a high-probability buy on the open of the next candle with a tight stop of less than $.10 while targeting the major swing high for the day at $33.85 (over $.33 away for a +3:1 Reward to Risk ratio).
Below is how the trade played out. It broke the prior swing highs, made a HL (higher low) and then shortly after went on to its target at $33.85. Keep in mind my entry was $33.51 with a target of $33.85 ($.34) and a stop of less than $.10 so over 3.4:1 R:R ratio.
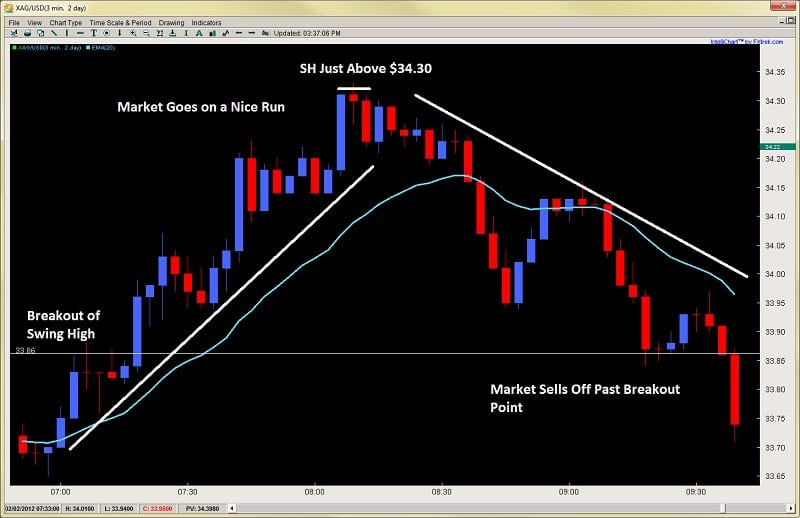
After hitting the first play on silver, it started to go on a run as it broke the SH (swing high). After breaking the $33.85 swing high, the market climbed over $.50 in less than an hour. Using my quantitative data on intraday volatility, this was approximately 20+% higher than the normal volatility ranges for this hour of trading. I’ll confess, I did not catch this upmove, but looking at it, I had two choices:
1) look for a market structure change to reverse the pair short as it may revert to the mean after the larger than normal surge in volatility, or…
2) look for a pullback to a prior value/support area and look for an entry to get back long.
I honestly didn’t know which of the two was a better play, so I watched the price action for clues. I want you to take a look at the next chart which shows the rise and fall of the shiny metal and take a look at the key difference between the two moves. See if you can spot the two subtle clues which communicated to me what I wanted to play.
First, notice how the angle of the two moves and the subtle difference. The buy up was a pretty sharp angle, while the sell-off, although impulsive in nature, had a flatter angle. This flatter angle communicated to me there was less strength in the selling then there was in the buying.
Secondly, look at the nature of the buying and selling. The buying was almost straight up with very small pullbacks telling me the buyers were quite dominant. While in the pullback, there was a see-saw type action, telling me the sellers were a) less dominant, and b) there was a fight going on between the buyers and the sellers unlike in the upmove. This all communicated to me via price action the market was likely going to reverse back up so I should look for a long after seeing a market structure change.
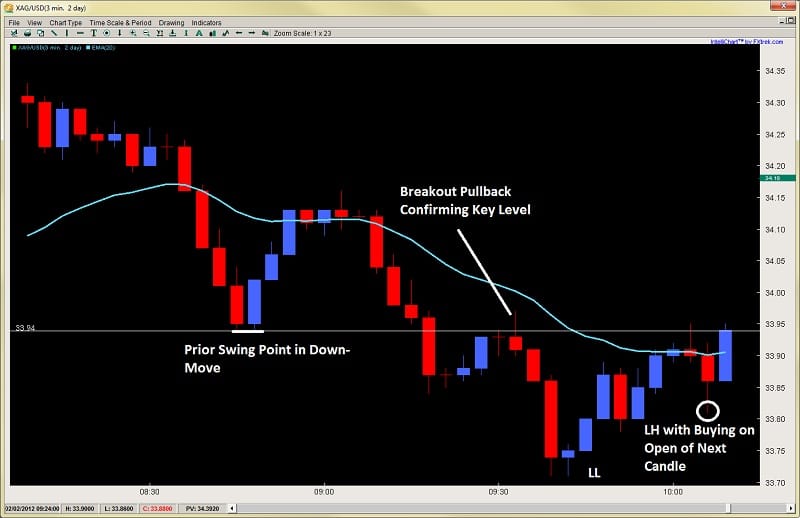
On the next chart below, shortly after the bottom, I got my market structure change. After bouncing off the low, the price actually bounced back into the prior range of the last pullback suggesting the buyers were starting to wrestle control from the sellers. Looking at the major swing low at $33.94 in the downtrend, if you look at the last two bars in the chart, you can see there was a rejection to the downside, followed by buying on the open of the next candle which went up to this key $33.94 level.
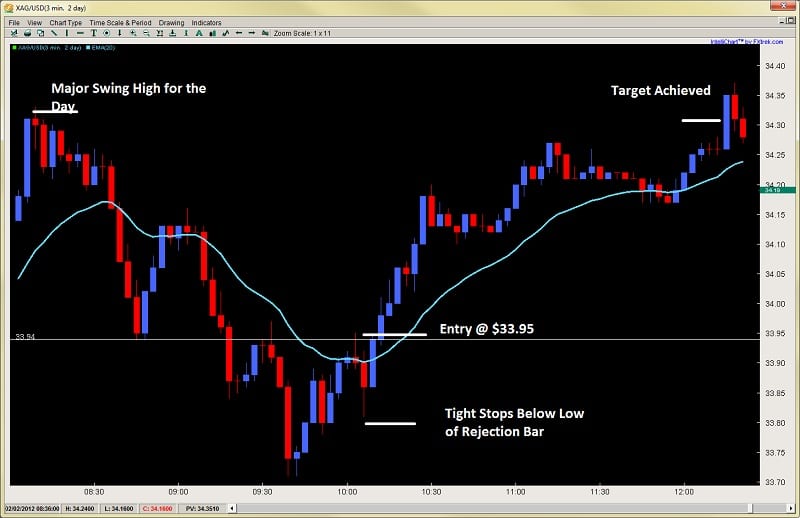
This rejection + the buying from the open was communicating to me the buyers were likely making their move. When I see that, I am going to buy that. I took a buy 1pip above this swing point at $33.95 with my stop below the low of the rejection candle prior, while targeting the SH for the day. This gave me a $.35 target and a $.15 stop for 2.33:1 R:R which was fine with me.
The market then climbed for the next 5 out of 6 candles suggesting the buyers had come in just before my move and I was riding the momentum of their buying. After a small rejection, the market went sideways, so since the bulls were still in control and had not conceded it, I stayed in.
Shortly, after a little further buying and small pullback, the target was achieved taking out the Swing High for the day as you can see in the chart below.
This is exactly how I took each trade, found my entry, stop, and limits – all using pure price action analysis, combined with favorable R:R ratios. This should give you an insight of how you can trade price action. By learning to read the market structure, looking for changes and subtle clues, then taking the most favorable plays that present themselves.
I would like to add that even though I am trading on a smaller time frame, I am not necessarily looking to be significantly more active. I am exploiting the same price action setups I see on the 1hr, 4hr and daily time frames. In fact, my methodology is really the same – wherein I am looking for a couple really high quality setups with very favorable R:R’s. These can be found every day, whether you are trading the 3min time frame, or the 1hr, 4hr and dailies. Your ability to read price action and all the clues will help you to spot the best opportunities, where the big players are driving the market, and how to find high quality setups.
For those of you looking to trade price action, visit our Advanced Price Action Course where we teach rule-based systems for trading Price Action.
If you appreciate our price action commentary and insights, please make sure to click the ‘Like’ button at the top of the page.

Great article Chris. I learned from the best.
Gracias amigo, now its your turn to start making plays like these.
CC
Hi Chris,
Your trained eyes (result of thousands of hours of screen time) see what most of us don’t yet. That gives you an edge. How do you tell “price action” from “noise” in the market on lower timeframes ? Often times, one gets whipsawed by the noise on the lower timeframes.
thx,
pliu
Tis an important question. Noise rarely has consistency to it, therefore you are often going to find a lot of wicks and choppy movements.
I simply look for patterns that i’d be trading on the 1hr, 4hr and daily time frames, and trade them virtually the same.
Nothing different, if you do not see the pattern, then don’t trade it, but if you look, you’ll find them soon enough.
Hope this helps
CC
Fascinating, this is just brilliant. sometimes it seems like it takes enormous amount of time to be able to trade with this much of insight…
Hello Baback,
Like all things, with practice and time they will come naturally.
Kind Regards,
Chris
I want to say thank you for this nice post and good luck.
Thanks Jiri,
Glad you liked the article.
Kind Regards,
Chris
this is the best article i hav read on price action. thanks
Hello Tony,
Thanks for the positive comments and glad you enjoyed it.
Kind Regards,
Chris Capre
hi
Thanks for great article about price action trade setuo
Hi chirs this is really really amazing but I have a doubt about one thing in chart number 6 as that looks liked a very interesting opportunity although it failed but still I would have taken it. I am not a course member but I follow only you i educate myself from all your free articles and free videos and I have been wanting to join from ages but its just not happening but I hope to join soon and I highly admire your trading style and perpespetive the way you trade is really very amazing and professional standard.
In chart Number 6 when the price made a lower low(LL) you can actually see that after that the price started a corrective move which took a total of 8 bars (7 blue,2 red) to reach approx near the prior swing point in down move( which you have marked on the chart )
Now as this is a corrective move due to the fact it took 8 candles to reach near the high of the previous pin bar which resulted in those final impulsive move while this same previous pin bar including itself took a total of 3 candle(impulsive move)
Now if you notice the 8th bar in the corrective phase that started forming after making a lower low the 8th bar is actually itself a bearish pin bar just happening at the middle of 20 ema and just a little low below the prior swing high of the previous pin bar.. I would have definetely taken a short trade there seeing the overall market context although it didn’t work out and I want to know the reason you didn’t consider that as a selling opportunity to enlight myself. thank you
Hello Criss Sir,
I am reading your teachings regularly one by one.I am feeling elevated after each lesson.Excellent content in very simple language.
Kind Regards
ravi shankar
Hello Ravi,
I am glad you are going through the teachings and finding them elevating your perspective on trading price action.
Hope to work with you soon sometime in the course.
Kind Regards,
Chris Capre
Hi Chris, brilliant PA article 🙂 Thanks. Would you recommend these same PA principles to scalping the 5 min chart?
Hello Jac,
Our core PA models work on any time or instrument.
Thanks Chris. Whats your opinion on scalp trading?
It’s like any form of trading – has to be done with the right math and a high level of skill. Also requires the right mindset and natural disposition towards it.
What you say makes sense. I would like to at least give it a try. Do you teach any form of scalp trading ?
The models of price action we teach can be taught on any instrument, time frame or environment. Hence if you want to scalp with our methods, you certainly can.
Kind Regards,
Chris Capre