Moving Average With Trend Setups pt. 2
We have gone over one method to use the 20ema for getting into trends after they have materialized and gotten underway. In this article, we will talk about another common setup trends often form giving us as traders another method to get into trends.
The EMA Failure – With Trend Setup
As mentioned before, trends will often oscillate and provide minor pullbacks before resuming another leg of the trend. These moves can pullback to the 20ema, touch it and then continue trending. Another method is the EMA failure, where the trend will pullback to the 20ema, break it briefly, and then resume the trend. We will talk about this method and gives some examples.
It stands to reason the institutions are watching how price action responds to these moving average touches because the market so often responds to them in such a clear and undeniable fashion. If a moving average has acted as support (or resistance) during a trend, then when it breaks it, the market should or could reverse. However, more often than not, the institutions will often use this as an opportunity to get back in the trend. It is often the case after breaking counter-trend the 20EMA, it will shortly after slam back above (or below) it to resume the trend. Lets look at a few examples and talk about some common characteristics when this happens.
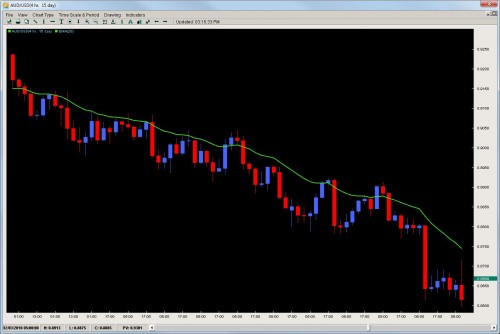
AUDUSD 4hr Chart

Moving in a solid consistent downtrend, the pair has had several touches off the 20ema treating it as resistance and a trend continuation signal.However, look at the middle of the chart where it breaks it for 2.5candles.Usually when something is treated as resistance and gets broken, the buyers come in thinking the trend is over or reversing.However, the market never did this as the price action after it barely gained ground only to slam back below the 20EMA and start another run.It did this a total of three times with the behavioural pattern the same each time.
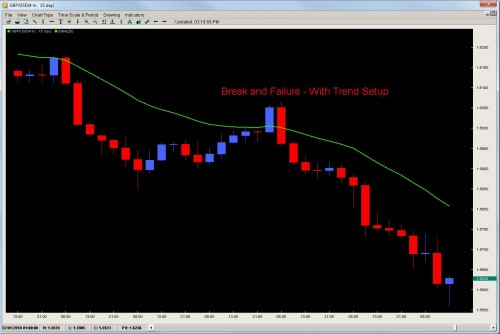
GBPUSD 4hr Chart
Already in a strong downtrend, the pair pong’d off the 20ema once and sold off for another 28hrs straight, dropping 300pips in the process.However, take a look at what happened when it actually broke the 20ema for the first time and closed above it.

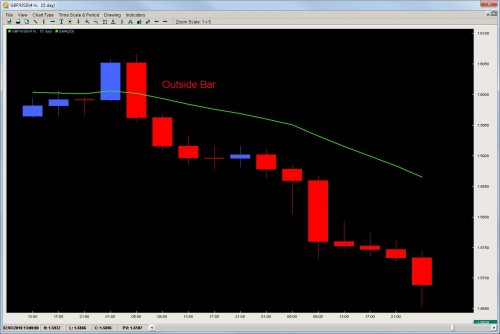
After closing above it, some traders might have gone long and quickly gotten trapped in this move after the pair on the following candle formed an outside reversal candle and then sold off 350pips in the next 48hrs.Not all EMA breaks are created equal and its important to realize when they are the real deal and when they are with-trend setups.
2 Key Points
The market will often exhibit two key characteristics when the 20ema break is a failure or a with-trend setup.
- Time – the market spends a short period of time (3-4candles max) above the 20ema on the other side of the trend before breaking back above (or below) it in the direction of the original trend.This is the market showing with time that trend is still alive and about to start another leg
- Reversal Slam – after breaking above the 20ema counter-trend, the market comes back with a vigor slamming back below (or above) the 20ema with trend to show their renewed energy to continue the trend.The strong price action move is confirmation with a lot of money from the institutions the trend is going to resume and this move is often highlighted with a reversal pattern of sorts as in the case below (outside bar)

When you have the combination of the Time and Reversal Slam together on a counter trend 20ema break, it gives us traders a with-trend setup that is usually low risk and high reward but more importantly, a way to trade trends after missing the initial move.
To learn more advanced price action setups, check out the Trading Masterclass course.
