Our Trading Performance
In this page you will find our trading performance for the entire 2020 year. We’ll break our performance down into the equity curve, core numbers, trading strategies, holding times, and largest winners.
Equity Curve
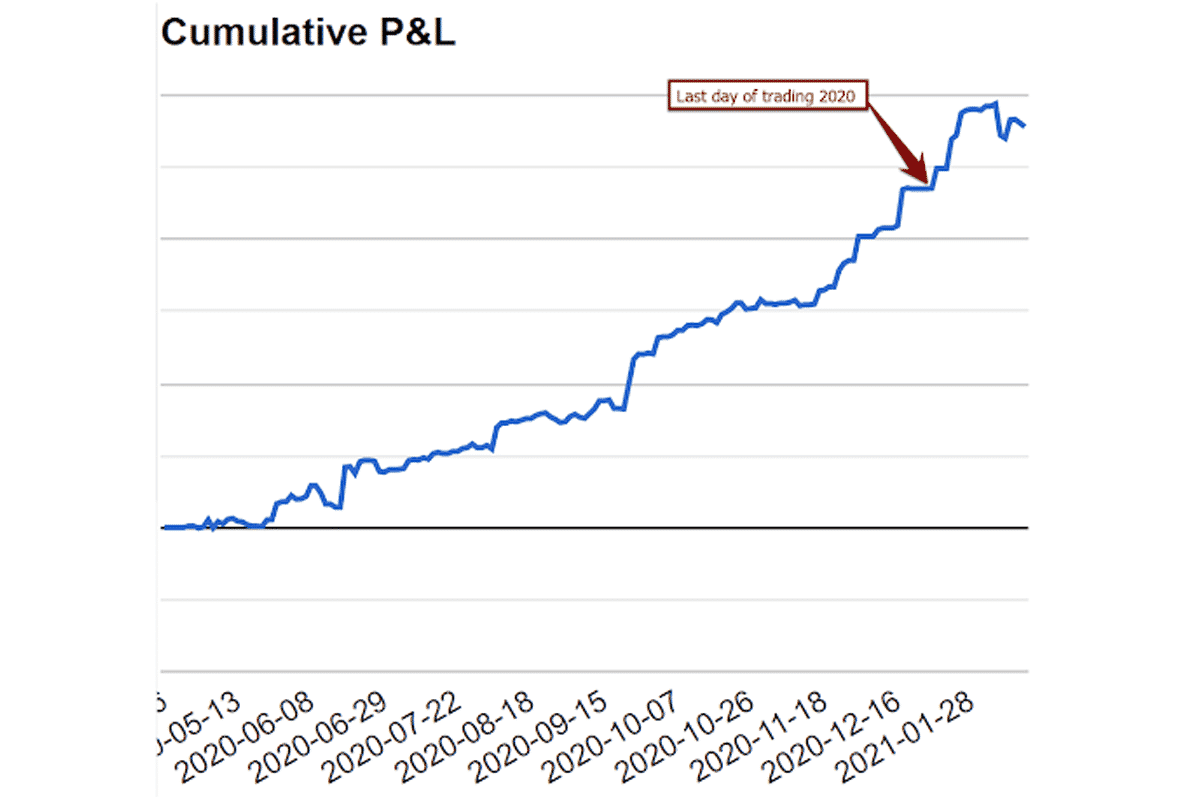
Using a combination of strategies from our Trading Masterclass and Options Bootcamp, we posted about a +72% return in 2020 from the day our account first opened (April 16th) to Dec 31st 2020. Hence we did this over a 9 month period.
You can see the equity curve and performance from our live trading account in the image below.
Looking at the chart above, we not only made money, but we did so consistently while having very little drawdowns (i.e. controlled risk).
Core Performance Numbers (accuracy, # of trades, month by month)
You can see from the chart below we posted an accuracy of 61.5%, meaning for every 100 trades, we won 61 of them.
You can also see from the graph below this performance is over 500+ trades with our month by month breakdown below in terms of how many trades we took.
In April (when we opened the account) we started in the middle of the month so only posted a few trades, but by May we did over 50+ trades with our peak number of trades happening in June with over 80 trades.
Hence we were actively trading the market in 2020.
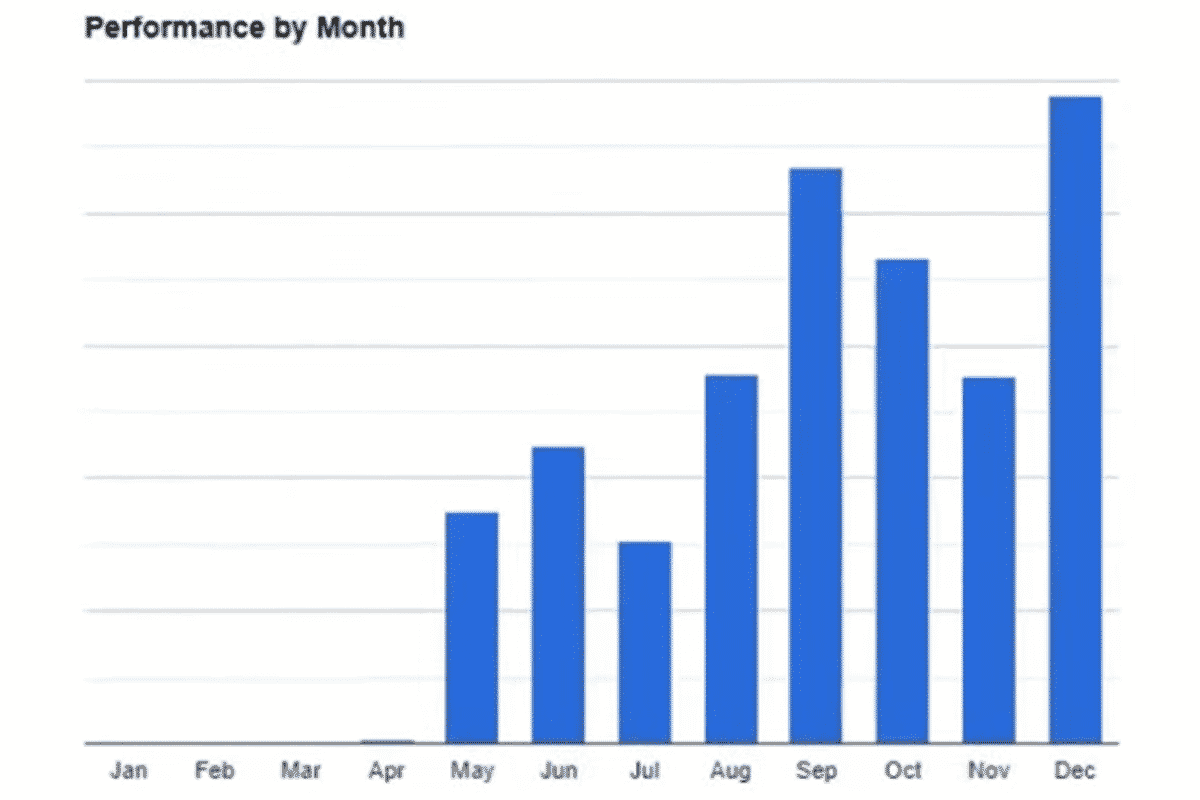
In the first chart below, you can see our 2020 trading performance on a month-by-month basis.
As you can see, we were profitable every single month of trading with September and December being the strongest performing months.
The Trading Strategies
To achieve this ~+72% return, we used a combination of day trading strategies, swing trading strategies, and long term trading strategies.
You can see the distribution of trades and holding times in the graph below with the x-axis representing the trade duration (in days), the green plots for profitable trades and red plots for losing trades.
As you can see from the data above, risk was consistently controlled as there’s very few trades going past the first line, yet in terms of winners, we have a fair amount of trades above the 2nd line, some above the 5th line, and our biggest winner above the 16th line.
For our largest winner, that means the profit from that winner alone eclipsed over 16 losses, hence it was over a 16+R winner.
You will also notice various clusters in terms of holding times with the majority of the trades held for 90 days or less, a fair amount of day trades (left side of the cluster) yet our biggest winner of them all was held for over 7 months.
The data above prove there are many false narratives about trading, such as:
- You cannot make money day trading (proven false)
- You should not take a lot of trades per year (proven false since we traded over 500x’s)
- Long term trading is less profitable then day trading (proven false as our biggest winner was one of our longest held trades)
What does the trading performance and holding times mean? That you can make money day trading, swing trading or through long term investing. All of these approaches can provide an edge if you learn how to do so. The key is finding which works best for you.
In terms of the actual trading strategies we used to generate this 72% return in 2020, we used a combination of long/short stock trades (over 80% long), buying/selling options (about 70% selling options, thus collecting premium), all based upon our core models of reading the price action context and order flow behind it.
We teach these same strategies in our Trading Masterclass (price action + order flow strategies), and our Options Bootcamp (buying/selling options based upon market maker gamma and order flow).
You can see our entire trading performance for 2020 in a video we posted here.


