Pin Bar Forex Trading Strategy – The 50% Retracement Myth
Today’s article is going to discuss and dispel the 50% retracement entry myth on the pin bar strategy. The goal today is to talk about why this entry by itself is a complete misunderstanding of price action, order flow, and the pattern itself.
During this article, I will share two key points on why this is a sophomore entry on this commonly used pattern, how you can find a more optimum entry, and what you should be looking for.
Key Pin Bar Point #1
By itself – the 50% retracement entry is a completely arbitrary method. For those of you unfamiliar with this pin bar forex trading strategy, the idea is to take a fib-retracement of the pinbar itself, and enter on a 50% pullback into it.
Pin bars do not have some magical retracement level institutions and bank traders are looking at for getting into the pattern. The real power of the pattern is in both the trap and rejection of the price action.
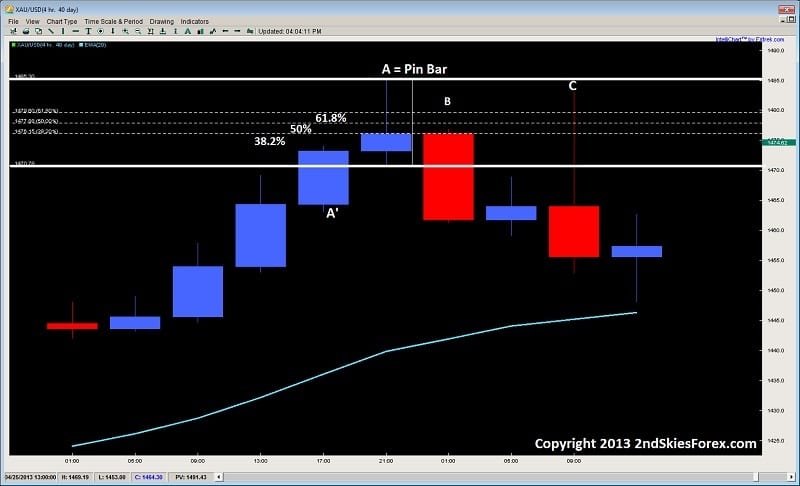
Looking at the chart below on the 4hr Gold chart, we can the pin bar at the top of the chart marked A, and how its body and tail stick out of the prior bars (A’) high & close. When the price breaks the high of the first bar (A’), this brings in new intra-day breakout trend traders to get long.
Now the tail and wick of the pin is formed by sellers rejecting the bulls advance, and reversing their gains intra-day.
Once the market breaks below the highs of A’, this “traps” and stops out those bulls who got long on a breakout of A’. This trap forces them to cover their longs with shorts, thus fueling the sell side even further. But a few details have to be pulled out of this chart first.
- The highs of A’ are at the open of the next candle
- The close of the pin bar A is parked on a 38.2% fib retracement
- Neither of the above line up with a 50% retracement, so taking a long at the 50% retracement is completely arbitrary, and ignores the most recent price action
Now in relation to the first bar after the pin (B), we can see it never makes it to the 50% retracement, and stops right on the 38.2% level which was the most logical conclusion, as that is where the more active order flow was.
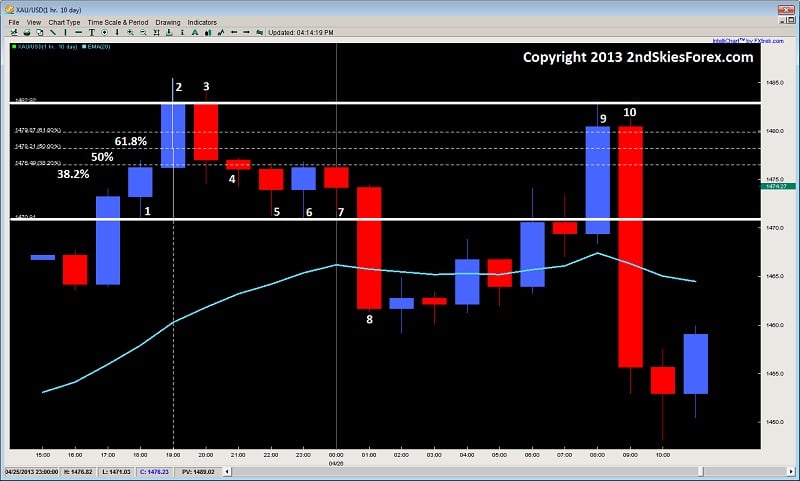
Taking a more detailed look with the 1hr chart below, we are looking at the same intra-day price action from the chart above, but with a little more detail using the 1hr chart.
Now the numbers 1-4, represent the 4hrs in the pin bar from the first chart. Even looking at this chart, do you see where the more dominant price action formed? You should be seeing it at the 38.2% fib retracement.
We can easily see this as the high of 1, the open and close of 2 and 3, the entire body of 4, along with the highs of 5, 6 and 7.
So as you can see, the 50% level has no meaning here, and is thus irrelevant as it ignores the most recent (and thus most important) price action.
Even the bars 9 and 10, blow right past the 50% retracement without even looking, and touch the close/open of bars 2 and 3.
This illustrates why the 50% retracement entry is a complete myth, and a sophomore understanding of both the pin bar, and how price action works. Thus, basing your entry on such an arbitrary play makes no sense and at all, and completely ignores what price action is about.
Key Pin Bar Point #2
If it’s not obvious by now, what you should be doing is basing your pin bar entry on the most recent price action around the pin bar.
This would mean using the prior bar at a minimum, along with the pins high, low, open and close.
The most ideal entry is not some arbitrary 50% retracement, but the actual high/low of the pin bar, or where the nearest key level comes in at.
Before all this, you need to understand price action context first.
Are we in a trend, or in a range? The difference between the two can have a significant impact on your entry.
From here, after you have assessed all this, you can see get a good gauge of where to place your entry.
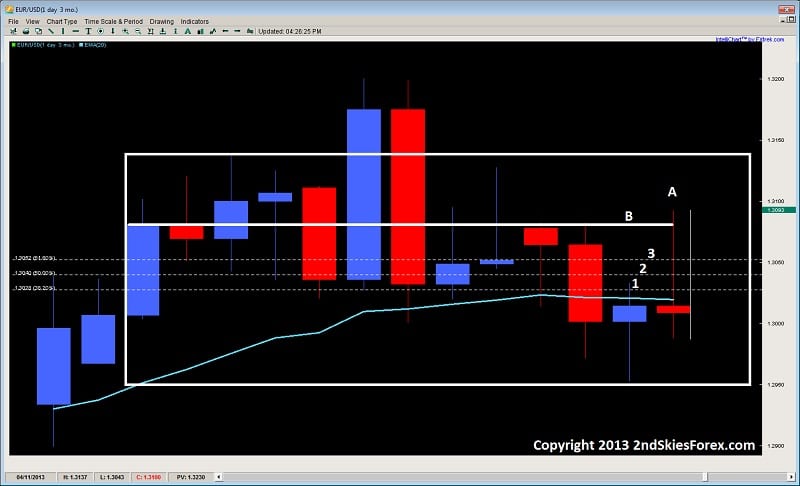
Using another example from a proponent of the 50% retracement entry, the EURUSD recently formed a pin bar on the daily chart. The suggestion was to get short on a 50% retracement. Below is the daily chart of the EURUSD, and the projected entry.
Now first thing we have to do is ask ourselves what kind of price action environment are we in?
Are we in a trend or a range? It should be obvious we are in a range. Thus the golden rules apply, that when in a trend, trade it like a trend, and when in a range, trade it like a range.
Now using this chart above, we can see the range outlined by the box.
The pin bar is marked A, and the fib levels are 1, 2 and 3, for 38.2, 50, and 61.8% retracement levels. Now, although there is some decent price action around both the 38.2%, and the 50% retracement levels, the bottom line is we are in a range – so selling at the arbitrary 50% level is selling in the middle of a range!
Do you really want to sell in the middle of a range? I didn’t think so.
If you really look at this chart, you will notice a ton of rejections around the key resistance level line at B, so your minimal entry should be to get short at B. But, since its a range, we don’t want to consider getting short till the upper regions of the range.
This would mean the pin bar high at a minimum. The more premium entries would be above this in the last 10-15 pips (i.e. upper end of the range).
So hopefully you can see how the 50% retracement entry is not only arbitrary, but a complete myth, and a huge misunderstanding of price action and the pin bar.
Going for a 50% retrace entry each time will get you a retail traders entry, not a professional one.
What we need to be doing as traders is
- Knowing what environment we are in
- Looking at the most recent price action, and
- Then determining our entry and how to trade the price action.
But, it has to be asked what was the end result of this 50% play?
The Euro naturally went above the pin bars top, stopping just under the range high, and thus stopping out those who entered on the 50% entry.
In Summary
When you breakdown this arbitrary entry method to trading the pin bar, and start really paying attention to the most recent price action context, along with how PA really works, you will begin get a better understanding of how to trade both pin bars, and price action as a whole.
This skill works for any pattern, environment, pair, time frame, or instrument.
Thus, I hope you found this article both challenging & provocative, but more importantly – insightful on how to trade pin bars, and price action as a whole.

Most important thing which point out by you is “when in a trend, trade it like a trend, and when in a range, trade it like a range”.
It is decision point, as long as we follow that we can hope for good results.
Thanks for the article Sir.
Hello Eklavya,
Yes, this is a very crucial point, so glad you picked up on it.
Kind Regards,
Chris Capre
This clears up a lot Chris – pin bars in ranges are often different animals – many thanks, Steve
Hello Steve,
Am glad you got those key points out of it and it cleared up a lot.
Kind Regards,
Chris Capre
hi chris can you please explain ‘what do you mean by the highs of A are at the open of the prior candle’. Is it mena high of A’ candle is withing the open and close previous candle??? If you can provide some screenshot that will be great.
Hello Bedayan,
If you look at the high of A’, it lines up almost identically with the open of the pin bar.
Hopefully that clarifies it.
Kind Regards,
Chris Capre
hi Chris,
Kindly explain”looking at the most recent price action”-does it mean we sell below the high,low,close or open of the most recent price action?
Hello Ishmael,
Looking at the most recent price action would translate into looking at the most recent bars before the pin bar, and how they relate to the pin bar itself.
Hope this helps.
Kind Regards,
Chris Capre
Great analysis Chris…
Hugo
Hello Hugo,
Glad you enjoyed the analysis.
Kind Regards,
Chris Capre
Hello Chris I found this article very useful, identifying the environment ,key resistance level followed by pinbar ,entering at appropriate level,I love it price action is king
Hello Dave,
Glad you found the article useful. And yes, PA is king.
Kind Regards,
Chris Capre
Thank you Chris.
So if 50% is too simplistic, what is the correct way of entering?
Hello Daniel,
The answer is in the article which I state clearly on what you should be looking for towards the end. So read the article again, and then let me know what you come up with.
Kind Regards,
Chris Capre
Hi Chris,
Excellent article. As I’m a relative newbie I have been trading Pin bars on the daily charts only. Does the 50% retrace on a daily pin not have a significance purely because that is the daily “pivot level” and therefore price is likely to retrace to that level and reject off the natural resistance in favour of the trade
Hello Steve,
It doesn’t have to being the DP. More orders are going to be placed around the levels where there was more prior activity by default first. So the allegiance should be to the most recent price action and order flow first and foremost, not a DP or arbitrary pullback level.
Kind Regards,
Chris Capre
I like the pin bar methods you teach, and thank you Cris for use EMA20 i like ema20 trend very much
I had my suspicions about this 50% retrace entry being quite arbitrary and not really making sense.
You have clarified my doubts as to why this method fails. Better to observe the order flow as to where the most likely stopping point is.
Great article and will be learning more from you.
Bonnie
Def a superior way to looking at how to trade the pin bars
as I looked for better entries than 50% retrace entry
you have just clarified my doubts and given me a much better way to trade pin bars in forex
Thank you sir. i am new to price action only a few weeks, but finding this site a really good resource. You have a good and different perspective than what i’ve seen out there.
will practice your methods on demo trading.
Happy trading sir
Without a doubt, you have changed my perspective on the pin bar strategy and entry technique. Will no longer blindly use the 50% retrace entry, or the trade entry trick, which is just some bogus ‘trick’ from the king of all ‘tricksters’
Letos M
Thank you for clarifying this issue about the entry. The fixed 50% retrace entry by itself did not make sense, and now I know why as your explanation is much more clear.
I see you share interesting stuff here, more in-depth price action that I have seen on the typical sites that claim trading patterns is price action.
You are the true professor!
Thank you for clearing this up. A 50% retrace tweak entry never made sense to me – seemed arbitrary and that there were better entries. You shed the light on other BS gurus.
Chris, on that first chart, “A” pinbar is not really a pinbar, right? It closes outside the range of the previous bar.
Hello Greg,
That is incorrect – a pin bar does not have to close inside the range of the prior bar. That is only one definition.
Kind Regards,
Chris Capre