Price Action Trading The Daily, 4hr & 1hr Charts
What’s Inside?
- Let’s talk about the Weekly, Daily, 4hr & 1hr chart entries
- What daily time frame forex strategies do you recommend?
- How can I utilize price action trading systems on the 4hr chart?
Tell me if this is true and has happened to you before:
You look at the weekly time frame, or perhaps the daily time frame, and the price action context looks bullish. However, when you look at the 4hr and 1hr chart, the context looks bearish. Now you’re not sure if you should go long at your trade location, or be worried about that seriously bearish trend on the 1hr chart.

Has this (or something like it) happened to you? Ever been confused trying to understand the price action trading trends on the daily, 4hr and 1hr charts?
If so, you’re not alone as many traders like yourself have challenges in learning this skill. The good thing is, you can learn how to trade price action on any time frame with the right training and skills.
In today’s price action forex strategy article, I’m going to share with you 3 tips on how to do price action trading on the daily, 4hr and 1hr charts (or any time frame).
If you want to trade like a professional trader, you’ll have to understand price action context across multiple time frames. Learning these three price action trading system tips will help you build a ‘framework‘ for how to trade price action on multiple time frames.
Price Action Tip #1:
How Do I Know Which Time Frame To Read the Trend?
One of the most important and fundamental ways to look at time frames is to understand them by the following photo below:

What do you see in these 3 shots?
Starting on the left, we have the wide lens (18mm) which shows this shore/side of the lake, trees on both sides, and a couple peaks near the top left.
In the middle, we have a 55m wide lens which only shows the short on the other side of the lake. It also shows a 3rd peak which is more easily seen to the upper right.
On the right side, we don’t see any lake, only one major peak, with a well defined white strip of snow and lattice structure on the mountain.
3 lenses, same piece of land.
Now let me ask you this question: Which one is ‘right’? Which one is the ‘most accurate‘? The answer is neither, or better yet, ‘whichever is most important to your needs‘.
And that is how you need to think of price action on the weekly, daily, 4hr, 1hr or any time frame for that matter. Each time frame is it’s own ‘lens‘ (perspective) about the price action and order flow. Hence each time frame has it’s own trend. The key is to pay attention to the time frames most relevant to how you’ll trade.
Do you have a full time job and can only trade a few hours after work? Unless you have some solid experience in trading or reading price action, I’d recommend the higher time frames.
For our discussion, here is what I consider the ‘higher time frames‘:
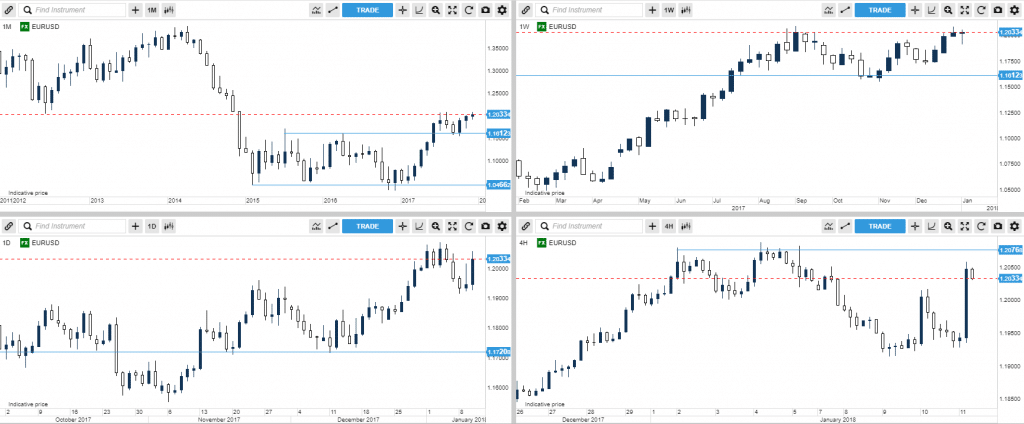
Monthly/Weekly/Daily/4hr on EURUSD

The overall guide on how to relate to this is:
1) Look at the monthly time frame chart if you are looking at several years+ worth of price action, and want to hold trades for about a year or more (often called ‘position trading‘).
2) Look at the weekly time frame chart if you are looking at just a few years worth of price action, and want to hold trades for several months at a time, perhaps close to a year
3) Look at the daily time frame chart if you are looking to do ‘swing trading’, and want to hold your trades for a couple days, up to a few months (perhaps quarter)
4) Look at the 4hr time frame chart if you are looking to do swing trading, and want to hold your trades for a couple days up to a few weeks (perhaps a month)
NOTE: These are general ‘guidelines‘. They are not perfect rules.
A few months of price action on one chart may have more meaning/information/key levels/etc than another forex pair for the same amount of time. You cannot bottle price action context and time into perfect rules. Hence use these as ‘guides‘, not fixed rules.
If you are someone who has the capacity + interest to trade price action intraday (which we support), then I’d recommend the 1hr down to the 5 minute charts. A lot of professional traders day trade.

I have in my trading course several videos showing me trading price action live with my own money on the 1hr, 5 minute, 3 minute, and 1 minute charts. Hence remember this:
Price Action as a ‘skill‘ can be used on any instrument, time frame or environment.
If what you’re learning only works on specific time frames, then it’s not a real skill of price action trading. Just like good footwork in basketball works in high school, college or pro, from offense to defense, it works in all aspects of the game because it’s a ‘core skill’. The same goes for trading price action.
So the first key skill to understanding multiple time frame context is: The trend is based upon time frame.
Price Action Tip #2:
What Daily Time Frame Forex Strategies Do You Recommend?
Many traders (perhaps like yourself) want to trade the daily time frame and are wondering what forex strategies you can use. There are many strategies we teach in our trading course, but one I’d recommend is a role reversal setup (or breakout pullback setup).

This daily time frame strategy is best used when you are trading with trend. Below are 3 major components for a breakout pullback setup:
1) find the overall price action context and trend on the daily time frame
2) find a key support level (for bear trends) and resistance level (bull trends) that has been touched two times before (at a minimum)
3) wait for the market to breakout and pullback to the level
If you’ve done those 3 things, you’ve likely found a good role reversal – breakout pullback setup.
There is more to this strategy, (what type of trend you are in, which are key support and resistance levels, what is the best price action context to trade breakout pullback setups, etc.), but you have the basics.
NOTE: If you want to learn more about this strategy and how to trade it, check out my Trading Masterclass course where I teach you exactly how I use this strategy with my own money.
Now you’ll want to practice this daily time frame forex strategy and learn how to spot these profitable trade setups. So start with a trading simulator, then demo, then live.
Price Action Tip #3:
How Do I Trade Price Action On The 4hr charts?
If you’re primary time frame for trading is the 4hr charts, then most likely you’re doing ‘swing trading‘. In essence, you’re trying to capture larger ‘swings’ in the market.

Without a doubt, you can use the breakout pullback setup on the 4hr chart (or any time frame for that matter). Here are a few tips you can use when swing trading the 4hr charts:
1) Have the daily chart as your ‘higher‘ time frame context. When in doubt, try to trade with this the most.
2) Don’t expect the market to go straight to your target.
NOTE: It may require a few pullbacks before it gets there. Eventually with enough skills in reading the price action context, you’ll learn when those pullbacks are part of the trend, or leading to a major reversal.
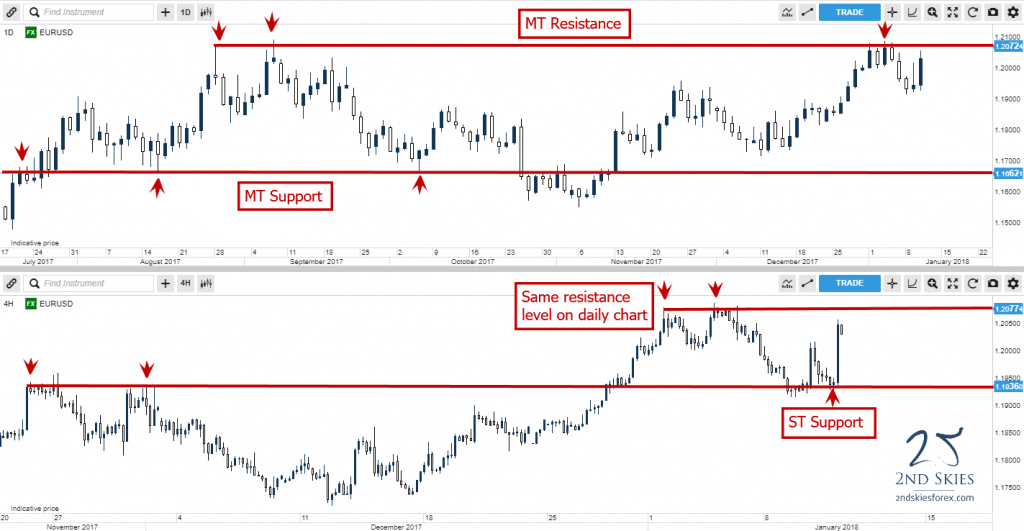
3) Mark your support and resistance levels on the daily & 4hr charts.
I’ve provided an example below:

In Summary
You’ve now learned 3 price action trading system tips for trading the weekly, daily, 4hr, 1hr or any time frame chart. They are:
1) The trend is based upon the time frame
2) You can trade the breakout pullback setup as a daily time frame strategy
3) Trade price action on the 4hr chart in conjunction with the daily time frame chart
When you start to approach trading price action context with the strategies and guides I’ve outlined above, you’ll build a framework of skills for trading price action on a more advanced level.
Now Your Turn
What did you learn about trading on multiple time frames from my article above? Do you have more answers or questions, and if questions, what are they? Share your thoughts and comments below.

Thanks for the article. I think this is the common problem faced by most Traders.
Cheers.
Hello Jun Jek,
Yeah, I think this is a sticky point for many traders. It just takes time, practice, and not over-thinking things. Hopefully we can continue to help struggling traders get past this hurdle and increase their trader profits.
It’s crazy that this article pops up literally in a matter of minutes after the question of the importance of different time frames came to mind. Your comment “over-thinking things” may have hit the nail on the head, as this is something I continually struggle with, making things harder than they need to be. You have no idea how valuable sharing these tid-bits of information are for the unexperienced trader. Thanks for sharing!!
Hello Roger,
Yes, many people have had the question about time frames and understanding the trend. Most traders over-think things to begin with, and without proper training, will definitely over-think price action and trend trading. This leads to making things much harder than they need to be.
So am glad I was able to help you with this important subject!
Thanks, Chris,
It’s enlightened me.Very nice article.
Hello Ronaldo,
Am glad you found it useful.
Kind Regards,
Chris
Chris, can you explain, what means MT or ST? Thanks.
Hello Maxim,
Yep.
MT = medium term
ST = short term
Hope this helps.
Excellent article Chris. I have learned from the best, you, and always find your refresher articles informative and very helpful. I use all TF’s to pinpoint a better entry for my strategy. Works very well and prevents me from jumping in right at a major support /resistance level. Before I took your course and learned what patience is all about and how much more profitable one can be by being patient, I’d jump in it seemed at always the “wrong” time. My winning trades were pure luck, my losing trades were deserved. Now that I have the right attitude my winning trades are not pure luck anymore and my losing trades were just the market doing what the market does. Thanks Chris! You are truly appreciated.
Hello Cherie,
Thanks for the positive comments. Yes, when you start to understand multiple time frame context, it becomes much easier to trade price action and understand how to work with key support and resistance levels.
Seems like you’re really getting it, so keep up the hard work.
Hi.I am so grateful to u for answering my all life trading period
question (that the trend is based upon time frame) that in my opinion
nobody answered it directly maybe they themselves dont have a clear
understanding of that.so this article was really fruitful for me dear
chris.u solved my problem of overthinking about it.
Hello Maryam,
Yes, trend is based upon time frame. Once you start to understand that, and build your core skills of price action context, you’ll start to see things differently.
So what are the rules for entry and exit using multiple TFs?
Hello Fwallinder,
Wouldn’t we first need to determine the price action context?
After we establish that, what would be the next step?
Sorry, that’s not an answer. A valid answer is something like (for buy) price above 100EMA 4H TF, price crosses 50 EMA 1H TF from below and vice versa.
Hello Fredrik Wallinder,
Hmmm, I think there is a misunderstanding here.
First off, I’m well aware of what my answer included (and not-included). I’m also well aware of what specific entry conditions are.
I answered this way for 2 reasons:
1) Many of those specifics are for Price Action Course members. Hence it would inappropriate for me to share here.
2) I used this as a teaching opportunity.
Why?
Because you cannot get entry/exit conditions until you’ve established the price action context. Once you’ve done that, that will include specific entry methods and strategies while excluding others.
So the context does determine entry/exit conditions beforehand.
Hopefully this clarifies it further.