Reading Price Action – Key Price Action Elements to Breakouts Part 1
One of the questions I get most often about reading price action has to do with breakouts.
How to spot them?
How to know when it is a false breakout?
How to get in after it’s already broken out?
Ok, i’m in one now, how do I know it’s for real?
It is the last question we are going to focus on – how to determine if the breakout you are in is for real.
Over a series of three articles, we are going to cover 3 key elements to a breakout, dissecting the anatomy of a breakout such as;
what they should look like
what you will want to see
and what are the key characteristics of them.
By learning to read these price action patterns or elements inside a breakout, you will get a more unique grasp of how to understand breakouts. This can be done on any time frame as the price action pattern is the same.
From an Order Flow Perspective
Before we get into what a breakout bar should look like, let’s explain what is happening from an order flow perspective in a breakout.
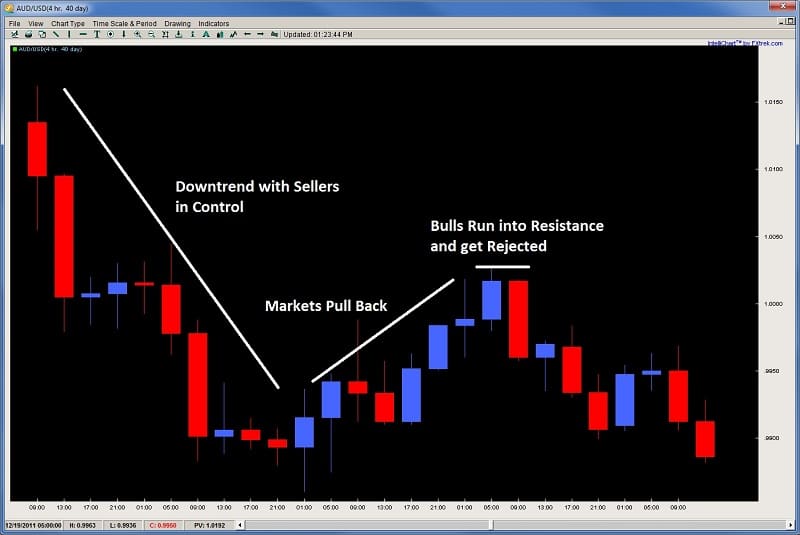
Using an upside breakout as an example, a resistance level has been established, with a minimum of one rejection, perhaps 2 and possibly more. This rejection in price denotes sellers over-powered the buyers and wrestled control of the market. The rejection could be slow, or it could be violent, but nevertheless, the bulls were in control, failed to break above a level, and the market pulled back.

Since they were successful in doing it before, there is a good chance previous or new sellers will be parked at the same rejection level to short the market again. Naturally, their stops will be placed just above the key rejection level. This is critical to know, because it is these stops when they get tripped which can help accelerate a breakout.
Why?
If there are players short at a key level, to exit they must buy back the pair which in turn, helps the bullish breakout get more steam. Keep this in mind for later while we start to discuss the first key element of a breakout.
Key Element #1 – The Breakout Bar
When witnessing a breakout, the first bar (or breakout bar) should be given the most scrutiny. This bar should be anything but timid in nature. Keep in mind, when a breakout is forming, there is a fight between the bulls and the bears which creates a tension. Sellers have placed a lot of money believing the market will reverse, while the bulls believe it will clear the key resistance above.
Thus, when the bulls are trying to break a key level, if the price action and bar approaching the key level is timid in nature, say with a small body, perhaps a wick on both sides, this will only give the sellers confidence they (the bulls) do not have enough dollars, buyers, or both, to break the key level. The sellers will sense this weakness and push back with a vigor if they really want to defend that level.
So the breakout bar should be strong in nature, signifying;
a) the buyers are putting a lot of force (either dollars, number of buyers, or both) into the breakout
and
b) they were able to clear out the sellers by tripping their stops
What does a strong breakout bar look like?
It should minimally be large in nature, meaning it has a large body (larger than usual). This large body demonstrates strong buying power and participation from the bulls. The stronger the force in a breakout, the more momentum it will likely have as it tries to make new ground. A large body shows commitment and force on the buyers part.
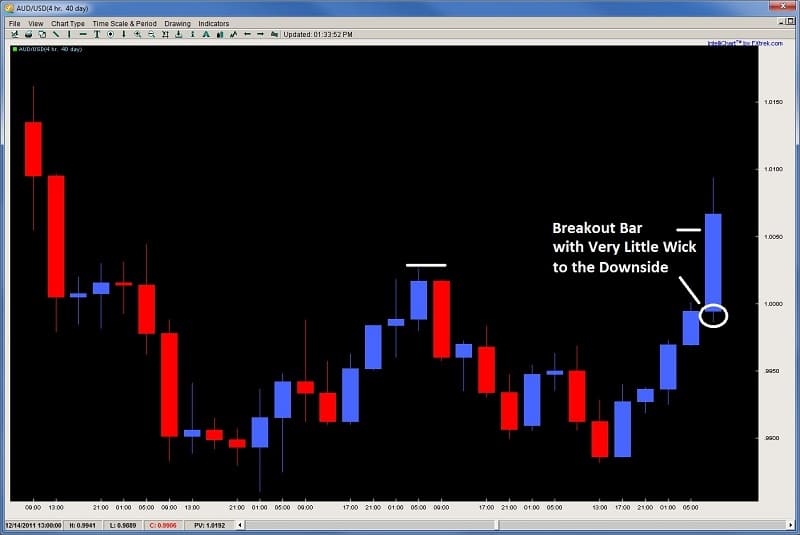
Another important element of a good breakout bar is it has little or no wick to the downside.
Why?
A bar that opens and has few or no pips to the downside, communicates to us the buyers were present and strong in the market from the open of the candle. They wasted no time buying from the open giving the sellers no time to enter. Their strong buying from the open suggests commitment to drive prices up and establish control from the beginning. Thus, look for little or no wick to the downside on the breakout bar such as in the example below.

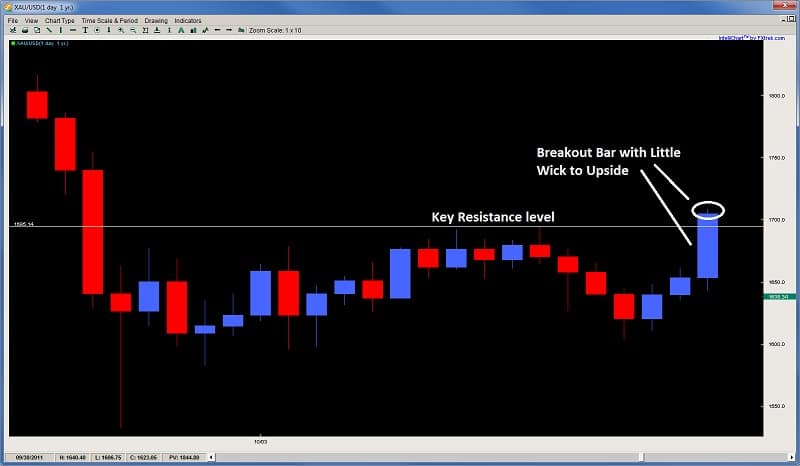
Thirdly (and consequently), the breakout bar ideally has little or no wick to the upside as well. The presence of a little wick suggests the buyers maintained control going into the close, thus not taking profits, and likely communicating they think there is more upside to be had, thus staying in the market. This will also deter sellers from entering as they are reading the strong close from the bulls, thus, they will be hesitant and likely wait for a better price action trigger. Take a look at the example below.

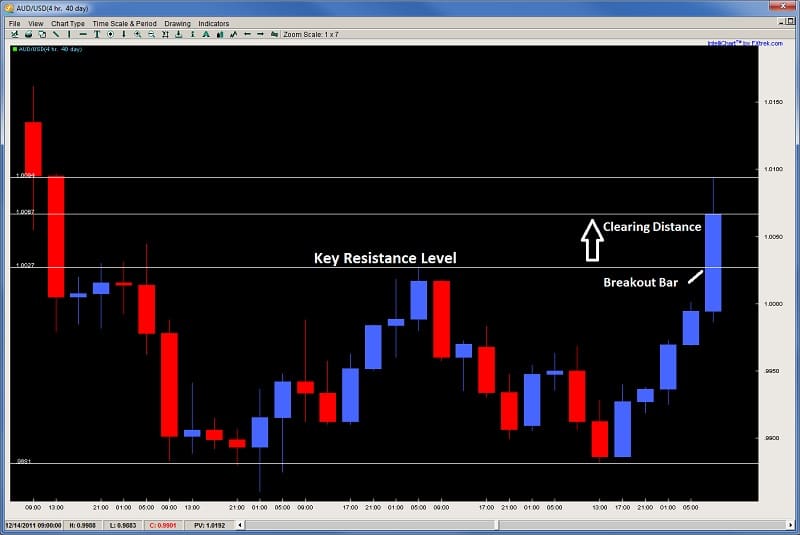
Lastly, a good breakout bar will have clearing distance. This is the distance the bulls have cleared from the previous resistance level which was containing the upside. If they only clear the resistance level by a small amount, its possible they did not trip any stops, thus failing to add steam to their breakout play. This could also suggest to the sellers the bulls do not have a strong punch, so the bears may see a weakness, and thus enter the market.
However, if the breakout clears the resistance level by a good distance, then stops were almost certainly tripped, thus adding to the upside break. This will also communicate to the bulls they have taken out all the barriers and thus can push for higher ground with less orders from the bear side.
To be specific, the clearing distance is the distance in pips from the high of the resistance level broken (or low in a downward break), to the close of the breakout bar. The high of the breakout bar is useful as it tells us how far the bulls were able to push (and clear) from the resistance level in the breakout bar. However, if it pushes really high, but gets rejected strongly and barely closes above the lows, this would communicate to us sellers did not accept the value of the pair that high above, and rejected it strongly, taking control from the bulls (who were in control during the breakout). So the key is how far does it close above the high of the previous resistance level. This is known as the clearing distance and is demonstrated in the chart below.

In Closing
We have just covered 4 critical characteristics to what a strong breakout bar would look like. They are;
1) Large Body
2) Small Wick to Downside (for upside breakout, while a small wick to upside for downside breakout)
3) Strong Close
4) Clearing Distance
These four things communicate to us from an order flow and price action perspective why they will likely lead to a strong breakout.
This is part one of a three-part series on reading price action and how to identify key elements to a breakout. Stay tuned as next week we will cover the second aspect of a strong breakout and how this communicates the breakout will likely continue.
Please remember to leave your comments below and to ‘Like’ and ‘Tweet’ to share the article.
Also make sure to check out our most recent article on Awareness, Negative Habits, and Concentration in Trading.

Hi Chris!
Very informative article. Just a question though….
How many pips is your ideal clearing distance from the resistance level for it to be considered a real breakout?
Good question,
there is no ideal pips because each pair has its own volatility ranges. NZDUSD is far less than GBPUSD, and even then, within a pair, they fluctuate throughout the hours of the day, month, or year. On top of that, it also depends upon how big the formation is that is being broken. Obviously the larger the formation, the larger the breakoutso how could I have one pip level for it to be ideal for all breakouts, even within the same formation?
Try not to think of everything as being completely fixed. Its easy to want rules for every single detail. Its psychologically more comforting, but some elements of price action trading, just have to be done with judgment.
Try to think of one way you can come up with a decent way to gauge it and then let me know what you think of.
Kind Regards,
Chris
I don’t know how to gauge it Chris. Every trade and pair is unique. Thanks for your straight answer though.
try and think outside the box here. what would be one possible way to feel like it cleared it by enough…think of an indicator
ATR and BollingerBands adjust for volatility.
Very Good Jerry.
Yes, one alternative is to use a multiple (or fraction) of the ATR based on whatever time frame you are using.
This would be one way to gauge if the market has moved a solid amount in relation to normal volatility.
Well done
Chris Capre
Hello Chris
Awesome article. Awesome website. Awesome Advanced PA Trading course.
Question: Have you written the second and third parts of this series? Is there a list of like type articles and videos? With all the free information on the site its a little hard to navigate. I see the articles are separated by month but not type.
Wow there’s a lot of great info on here.
Thanks Mike
Hello Mike,
Am working on the second part – i have a lot of articles in the queue so have to follow the list but getting back to part 2 soon.
There is a link to a page which has the articles and videos separated by category or topic which you can find here;
https://gammalevelcorp.wpengine.com/new-to-forex/
Hope this helps and thanks for the kind words.
Chris
Wow that is a heck of a lot of information. That link makes it easier to navigate by far
Thanks for getting back to me so quick and for all you do
Mike
Hey Chris,
great article! I just have one question regarding this quote from the article:
“A bar that opens and has few or no pips to the downside, communicates to us the buyers were present and strong in the market from the open of the candle. They wasted no time buying from the open giving the sellers no time to enter. Their strong buying from the open suggests commitment to drive prices up and establish control from the beginning.”
Why is timing so important. How can you be sure most of the buyers are using the same charting as you do, maybe their broker has a 2h shift on the 4h chart, which can mess up with our theory about the trade. Time is relative, it does not matter if I start measuring it now and you start measuring it in 30sec, what maters is what really happens. Would you have any suggestions how to filter this kind of time shifts because using different plotting parameters (which in terms should be the same, but is not the case in reality a lot of times)
thanks for the answer in advance
keep up the good work!
Peter
Hello Peter,
Glad you enjoyed the article.
In regards to your question about time, I have a few responses;
1) The largest market of all the regions is the London/UK market which dwarfs all the others combined. Second place (US) is not even half the size of the London/UK session/market in terms of volume, so time does matter. Currencies are more volatile during specific hours and less during others. With that being said, since the largest volume and transactional order flow comes out of london, you’ll want to be ideally matching up with their hours (since that is what they will be using) which is generally set to GMT, and the 4hr candles starting at 0, 4, 8, 12, 16, 20, 00.
I have quantitatively tested price action patterns and the server time does make a difference whether the same pattern with the same parameters makes money or loses money – hence…time does matter.
Between all the server times, two tested really strong and one weak. One of them I already mentioned (GMT server time). The rest of that info is for my course members.
So in regards to the ‘time is relative…‘ as you can see, its quite the contrary.
2) One short-circuit to filter this is the 1hr chart which is the same for all server times with the only differences being price feeds.
Hopefully this answers your questions.
Kind Regards,
Chris
Hi Chris,
I’m a newbie who is tring to estabish my own trading style and am leaning towards intraday price action on EUR/USD and USD/AUD at present. I enjoyed your article and particularly explaining time frames. Can I assume that the charts you were using as examples were all GMT based and hourly candles?
Many thanks and looking forward to part 2 & 3
Mike
Hello Mike,
The charts i was using were based on NY time, however hourly price action should be the same regardless of server time.
But in our price action course we actually go into how server time actually affects each systems performance along with intrday price action.
Hopefully this answers your questions.
Thoughts?
Kind Regards,
Chris
Hi Chris,
Such clear and important explanation for this small feature.
Thanks …
Hello Maxim,
Glad you liked it and found it a clear explanation of a key trading subject.
Kind Regards,
Chris
Greeting Chris,
Great article!
You mentioned 3 key elements to a breakout here. One is the breakout bar, 2nd I think is pre-breakout characteristics which you covered in another article already. I wonder what is the third one?
Thank you for help.
Bin
Hello Bin,
They are listed in the article with a bonus;
1) Large Body
2) Small Wick to Downside (for upside breakout, while a small wick to upside for downside breakout)
3) Strong Close
4) Clearing Distance
Hope this helps.
Kind Regards,
Chris Capre
Hi Chris,
Thank you for your quick explanation. From your article here I think 1) large Body, 2)small wick to downside, 3)strong close and 4)clearing distance are great characteristics for healthy breakout bar which is one of three key elements of breakout.
In beginning of this article, you mentioned ” Over a series of three articles, we are going to cover 3 key elements to a breakout…”. In addition to the breakout bar you talked in this article, I wonder what are the rest of 2 elements of breakout? I guess they are pre-breakout and breakout pull back. Am I right?
I am fascinated in learning breakout from your great articles in your website here and try to dig a bit deeper for more.
Thank you.
Have a nice weekend.
Bin
I’ve been having trouble with breakouts for some time now. But after reading this and testing it out for few weeks back testing and simulation testing, this helped increase my accuracy on breakouts to over 60%! amazing.
thank u for the great price action content
joining ur course soon as I have heard a lot of good things from traders about your course, so can not wait