Tag Archive for: corrective pullback

New to Forex? Then check out my FREE Learn Forex Trading Course with videos, quizzes and downloadable resources

Top Trade Review: Check out this Top Forex Trade Review with Itayi profiting +1100 Pips on the NZDJPY (AMAZING PROFIT!)

Want FREE Forex Charts? Check out our top charting provider Trading View.

Did you read my ‘Is the Stock Market Going to Crash‘ article? If not, make sure to read it for trading tips.

Forex Trade Idea: EURUSD – Approaching Base Of Support & ATL (weekly chart)

Price Action Context

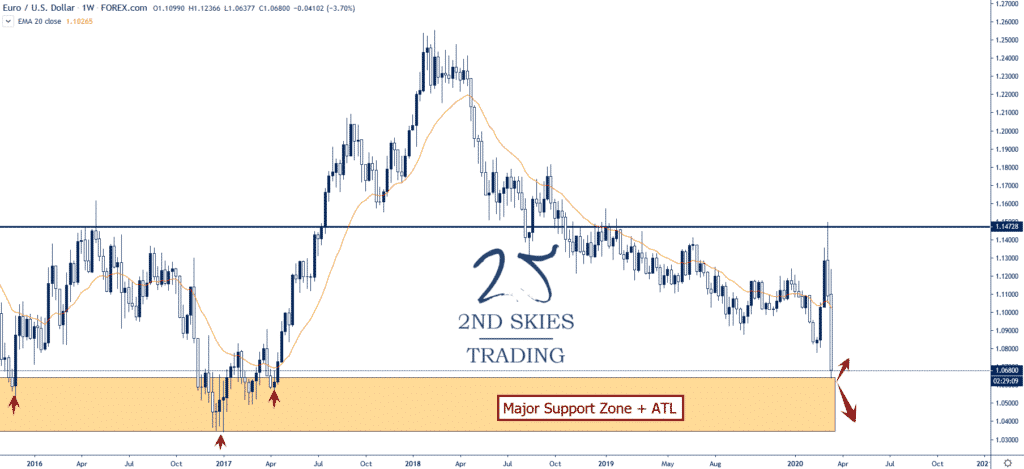
After a brutal V-shaped sell off from the two week rip up, the Euro has been punished dropping almost 8 handles in the last two weeks.

The forex pair is currently approaching a large base of support and the all time lows (ATL) between 1.0680 and 1.0348.

Right now there is a shortage of USD’s out there and thus a major reason why the USD is performing well now, so I’m expecting this support zone to be penetrated and tested.

If we break the ATL mid 1.03’s, then I’m expecting some technical stops to be tripped at 1.01 and a potential attack on parity so look for a weekly close below.
Trending Analysis

ST bearish and MT neutral while above this zone.

Key Support & Resistance Levels

R: 1.12, 1.1472

S: 1.068, 1.0345

Stay tuned to our members market commentary for updates.

******

Stock Trade Idea: Zoom Video Communications ($ZM) – Should Benefit Long Term (weekly chart)

Price Action Context

With a lot of companies having their employees work from home, video conferencing is set to benefit.

Now while many of these companies are seeing their stocks surge, I don’t think its going to evaporate when the corona-virus subsides and life goes back to normal.

I am thinking many companies will be realizing they can function just fine with large portions of their workforce working from home.

Hence I’m suspecting that even when life normalizes after this virus, more and more companies will be embracing video conferencing.

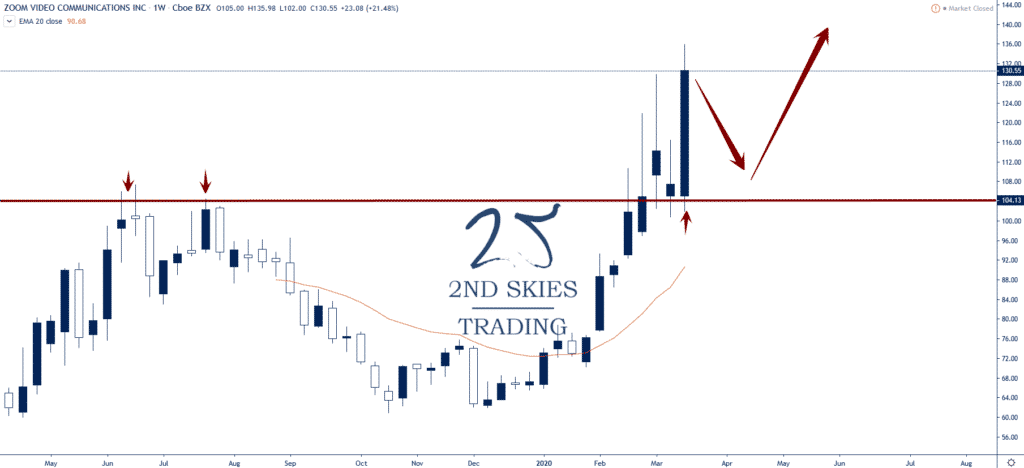
Enter Zoom (which we use) whose stock is up an impressive 68% since the beginning of Feb.

I think if we get a decent pullback in the stock, I’m looking to go long for a long term bet video conferencing will thrive in the coming years and Zoom will be a big beneficiary of that.
zoom stock

Trending Analysis

I’m watching the role reversal level around 104 as a potential buy point, ideally on a corrective pullback.

Key Support & Resistance Levels

R: 135, 150

S: 104, 75.67

******

Commodity Trade Idea – Gold ($XAUUSD) – Likely Sold To Fund Losses, Potential Support (weekly chart)

Price Action Context

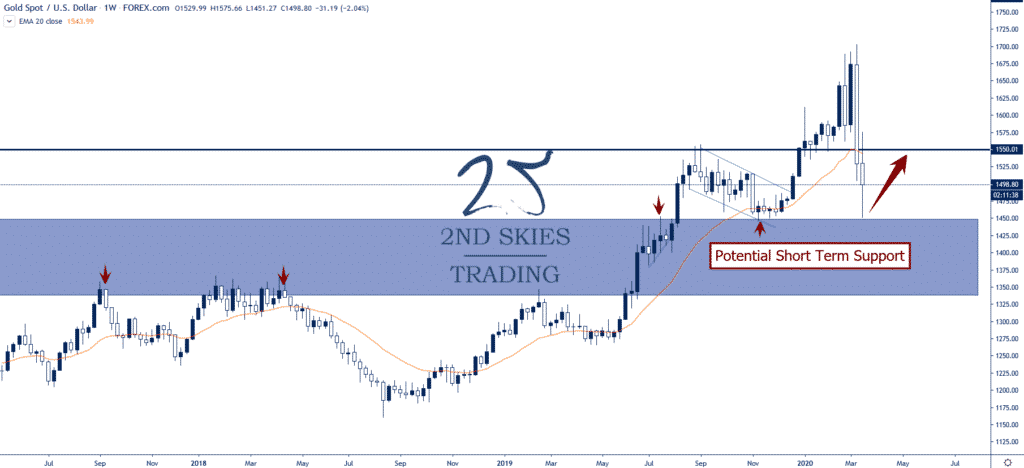
In the last two weeks, gold has been selling off aggressively.

A lot of traders have been associating gold with a risk off in this case, but if that was the case, why didn’t it start selling off earlier in the market crash?

I think gold has been sold recently as a ‘funding‘ trade to offset losses in other aspects of their portfolio.

Hence I think gold might be trying to bottom around 1450, and there may be a potential short term trade setup here.
                                              

Trending Analysis

ST bearish but MT bullish while above 1450 on a weekly closing basis.

Key Support & Resistance Levels

R: 1550, 1675

S: 1450, 1350

******

Chris current open positions: EURUSD, GBPUSD, USDJPY, USDMXN, BIR, TL

NOTE: Not sure what to work on as a trader to get better, or how to progress? Read my latest article The 4 Stages of To Becoming A Millionaire Trader

EURUSD – Holding Below Multi-Year S/R Zone (Weekly chart)

Price Action Context

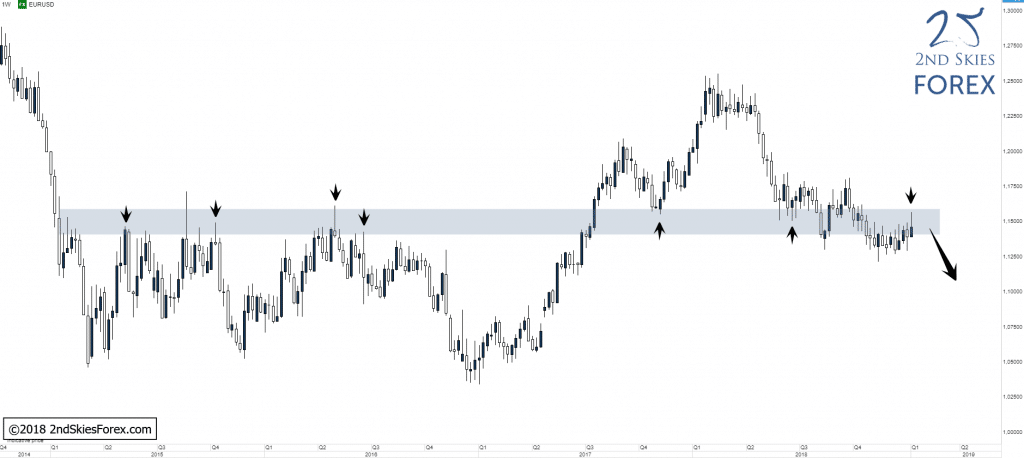
Long term, not much has changes since we covered the LT context on this pair on the 18th of November last year . Price did break out to the upside of the MT corrective structure we mentioned on the 8th of January, pushed deeper into the LT resistance, only to get rejected heavily within the LT resistance, with price quickly selling off 100 pips again before markets closed for the week.

forex-eurusd-technical-analysis-2ndskiesforex

Trending Analysis

LT bias is bearish and bears can look for possible trading locations around the LT resistance, alternatively look out for potential LTF structures and/or reversals forming that can be used to get involved in a likely move lower.

Key Support & Resistance Zones

R: 1.1400 – 1.1580
S: 1.0350 – 1.0530

Stay tuned with our members market commentary for updates.

******

CADJPY – Massive False Break @ Key Support (Daily chart)

Price Action Context

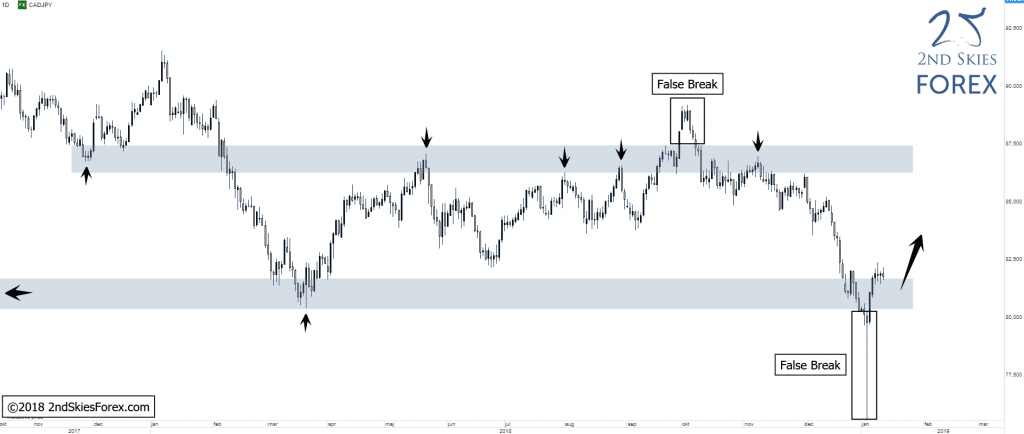
The recent flash crash across currencies took the pair all the way down to 75.00 and a major multi-year support at which price got heavily rejected, taking price back above the LT key support level again which goes back to early 2017.

forex-cadjpy-price-action-2ndskiesforex


Trending Analysis

LT bias is neutral at this point IMO with the LT support offering potential buying opportunities to get involved in a likely move higher towards 87.00.

Key Support & Resistance Zones

R: 86.30 – 87.40
S: 80.40 – 81.70

******

CAC40 – Pulling Back Towards Broken LT Support, Now Resistance (Weekly chart)

Price Action Context

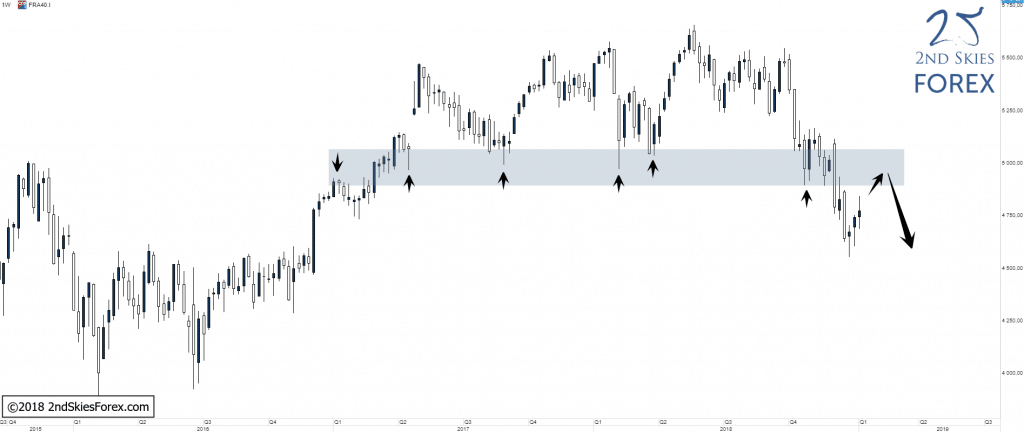
The multi-year support ultimately failed as more bears piled in, taking the index to prices not seen since late 2016 and over the last three weeks, price has been in a CT corrective pullback, heading towards the broken support zone which now should act as resistance.

cac-40-technical-analysis-2ndskiesforex

Trending Analysis

LT bias is bearish and sellers can look for potential shorting opportunities on pullbacks into the resistance.

Key Support & Resistance Zones

R: 4 900 – 5 070
S: 3 800 – 4 070

This week I want to share a few price action trade setups from one of my students, along with some of my personal live trades. Although I had several trades that were highly profitable, my student actually had some really impressive trades, so he’ll get the top nod for the week.
Here they are below, including one I just completed less than a few hours ago.

Live Trade Setup #1: EURGBP +130 Pips
eurgbp live price action trade 2ndskiesforex 30m chart oct 15

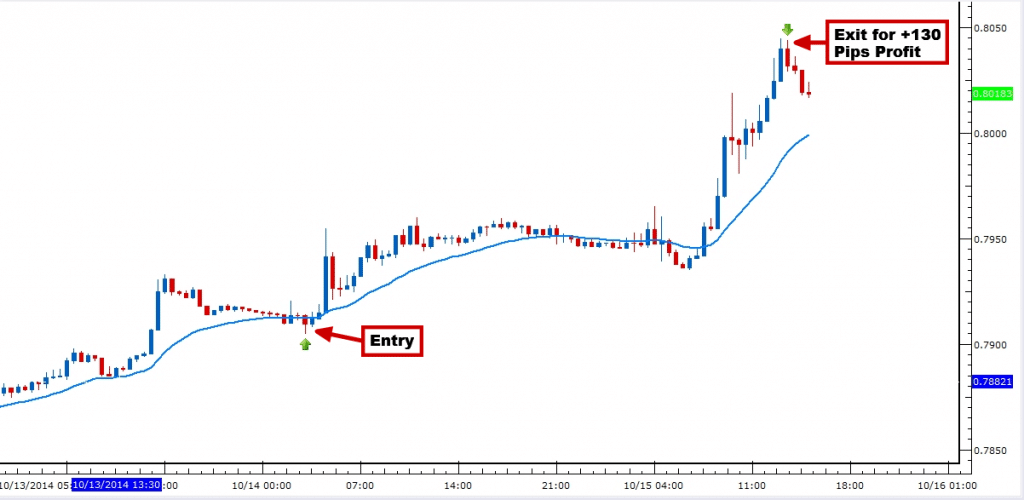
This is one of my personal live price action trades on the EURGBP. On October 13th, in the private member trade setups commentary, I told the members that I was flipping from short to long on the EURGBP, and suggested looking for a pullback between 7908 and 7890.
The pair pulled back to 7908, and as you can see from the chart above, this was an excellent trade location as the trade literally never went negative.
My entry was based on corrective pullback anticipating the trend would continue (not a price action signal or pattern), with me entering mid candle as price hit my limit order.
Literally just a couple hours ago, I took profit, and this seems like the prudent move as the pair has since sold off from the highs.
Total profit was +130 pips with a 28 pip stop, for a +4.65R profit in less than 1.5 days.

Live Trade Setup #2: Dax Trade Profits +3.5R
live trade setups 2ndskiesforex dax

This trade comes from a student, who probably like you, has been struggling with their trading. Right away, he got to work, training hard with our course strategies and lessons.
The result is his performance now taking a seriously good turn as of late.
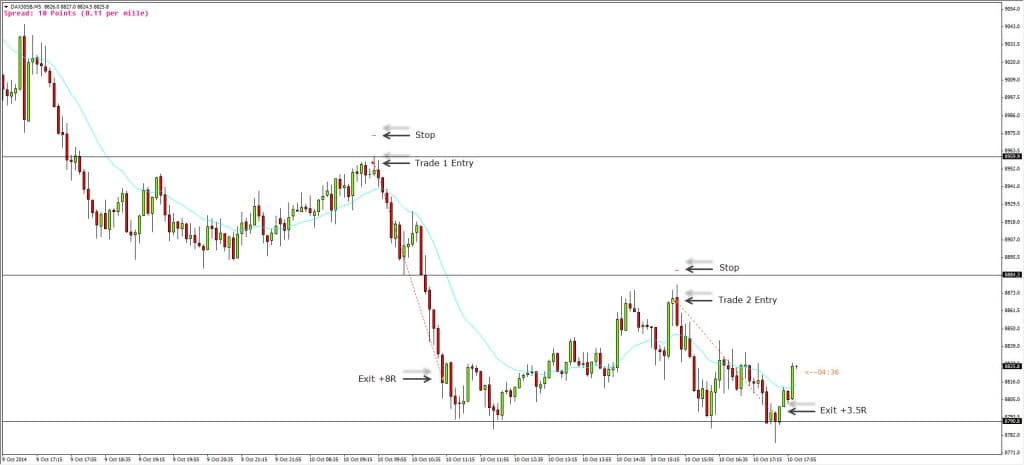
In this trade above, you can see his trade entry, stop loss and take profit. He was viewing the corrective pullback + double top as a great opportunity to trade with the trend.
He targeted the bottom of the range, which was a prudent move as the index bounced heavily, grabbing +3.5R in less than 2 hours.
NOTE: We’ll discuss his other highly profitable trade shortly, which he made just a few hours earlier.

Live Trade Setup #3: $CAD +170 Pips & +3.77R
usdcad live price action trade 4hr chart 2ndskiesforex oct 14

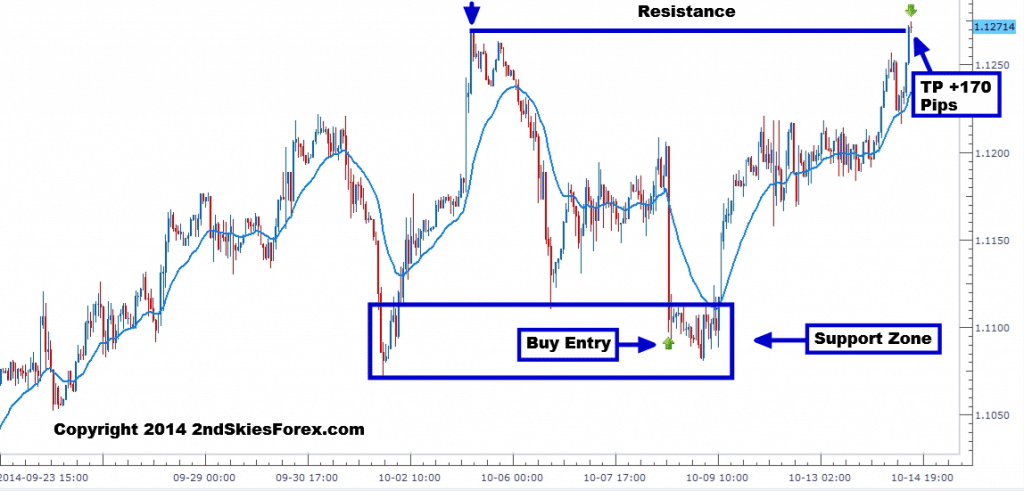
On October 7th in our daily member trade setups commentary, we suggested looking to buy the USDCAD between 1.1120 and 1.1070 to get long and trade with the trend.
Looking at the chart above, we traded this play, buying at 1.1100 with a stop at 1.1051 and a targeting the prior resistance at 1.1270 for +170 pips and +3.77R.
Had you been looking for a price action setup, you would have missed this trade completely. Food for thought.

Live Trade Setup #4: 2nd Dax Trade for +8R!
live price action trade 5Min DAX 8R

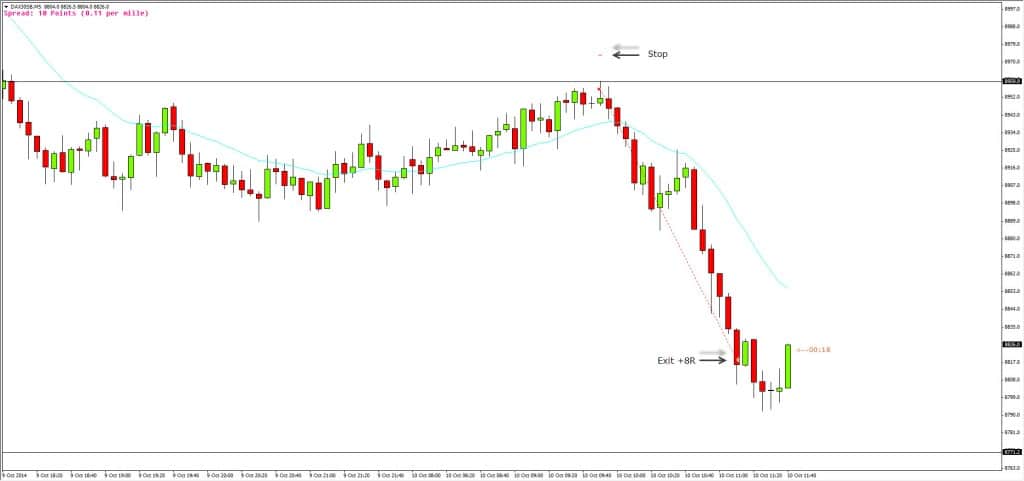
Remember that student who had the +3.5R trade on the Dax we showed earlier? Well this is the trade that came just hours before.
Trading off the 5 minute intra-day chart, this student spotted a good with trend trade following a corrective pullback.
Selling just below 8957, he literally called the top of the day (within a few points), grabbing +140 points on a 17 point stop for an amazing +8R in 2 hours!
Hence between those two trades, he put +11.5R of profits in his account within 4.5 hours, all using the 5 minute chart.

In Closing

As you can see, we don’t just give vague trade recommendations about what the market ‘might do from here‘, or occasional trade ideas 3-4x per month. We actively trade the markets, sharing many of our live price action setups (and give more in-depth commentary to our private members).
Also by now, you should clearly see the power of learning to trade price action beyond your ordinary price action signals (which would have missed all these trades).
If you’d like to learn more about becoming a member and making profitable trades just like the above, click here.