Tag Archive for: engulfing bar

albert einstein not following the crowd
This article is going to be a tad ‘controversial‘ to many developing traders out there. It is not meant to be negative in tone or start arguments.
It is to get you to question what you’ve been told about price actionIt is to open up a dialogue, about another way of approaching PA beyond the typical narrative.
The general price action story spun out there goes something like this;
To make any buying/selling decisions and pulling the trigger, it ultimately comes down to one final piece of the puzzle.
This final piece comes in the form of a ‘confirmation price action signal‘. And said ‘signals’ only arise in the form of a 1 or 2 bar combination.
They come in many names, such as pin bars, inside bars, fakey/false break setups, or engulfing bars.
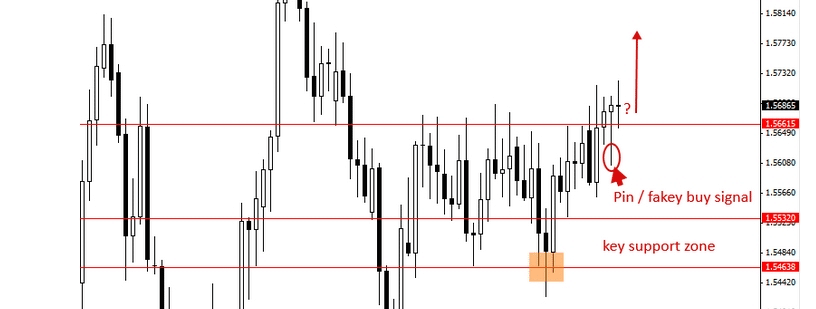
pin bar fakey price action signal failed
And the follow up to this magical fakey pin bar signal…
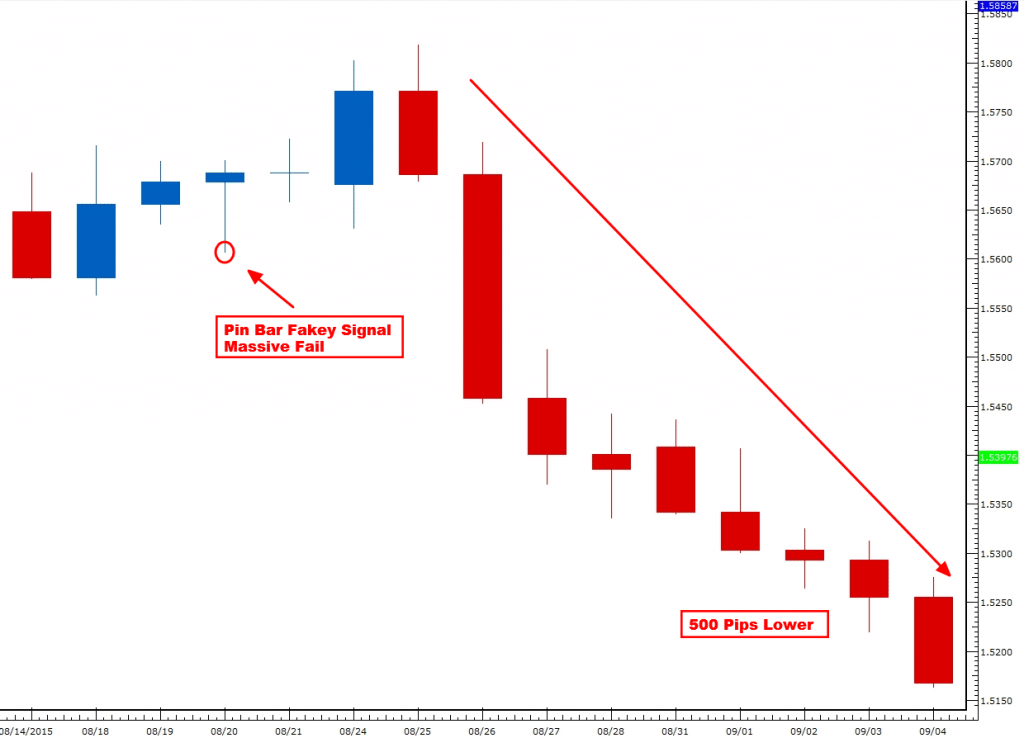
pin bar fakey price action signal failed 2ndskiesforex
Regardless of the name, the idea is the same. You should not enter the market till you see one of these famed 1-2 bar price action patterns.
Thus far, everyone spinning this narrative are derivatives. What do I mean by this?
Those who preach confirmation price action signals, copied all they knew (with minor adjustments) from someone else.
Many of them were students of one individual (Nial Fuller). A little investigation will reveal Nial Fuller’s price action strategies are also derivatives.
He was a member of J16 and copied all he knew from there, again with only minor adjustments.
If you look at most of the price action mentors, you’ll see the overwhelming similarity & repetition. Now you know why the narrative around PA sounds the same.
Essentially, they are either a derivative (copy) or a derivative of a derivative (copy of a copy). What you’ll also notice is none (or almost none) of them have institutional experience.
What’s really being sold here is a ‘green light buy/red light sell‘ methodology. It’s targeting easy prey who don’t want to do the work, who want understanding price action to be easy, who want to be lazy traders (in their own words).
Yes, with just three simple setups that are easy to find, you too can make profitable buying and selling decisions! Or so you are told…
The reality is far different from this (especially in institutions and hedge funds). By the end of this article, I’m guessing you’ll start to see why.
Below are my 5 reasons why hedge funds don’t trade confirmation price action signals.
 

Reason #1: Paying 5-6 figures To Train Their Traders?

smb training
photo: smbtraining.com (does it look like he’s sitting there just waiting for daily pin bars to form???)
The skill and time required to identify pin bars, inside bars, fakey’s and engulfing bars is minimal (a few months max). Shoot, you can even build an algo to do this for a few hundred dollars.
Bank traders on average will make 2000-4000 trades before they can trade the bank’s money. Hedge funds will also spend large amounts of money and time either training or finding talented traders.
If trading is as simple as finding these three patterns to enter the market, why spend so much to find/train traders what a $300 algo could do?
There is a reason for this.
Because reading and trading PA goes beyond confirmation price action signals. Because buying and selling decisions aren’t as simple as these 1 and 2 bar patterns.
If they were, there would never be the need for such expensive and exhaustive training programs. Would you ever spend that much training someone to trade daily pin bars?
My guess is no.
 

Reason #2 Macro + Technical

prop tradinng firms
 
If a fund is not trading algorithmically, most likely they are incorporating a combo of macro (read fundamental) + technical analysis.
I talked about this in my article Book Review: Cultures of Expertise in the Forex Trading Markets. The author (Leon Wansleben) is a sociologist who followed forex traders at a top-10 German bank desk for over a year.
Never once are the words ‘pin bar’, ‘engulfing bar’, ‘inside bar’ or ‘fakey’ mentioned in the book.
What you do find is traders working a combination of macro/fundamentals + technical analysis into how they trade.
They also discount the ‘lower time frames are noise‘ meme pretty quickly. Why?
Because most bank traders have to be reading the intra-day price action (due to flow trades, which accounts for about 70% of their trades).
By the end of the book, you realize entering the market goes way beyond pin bars, engulfing bars and inside bars. You realize they aren’t even trading those to make their buying and selling decisions.
 

Reason #3 Confirmation Decreases Accuracy and Profitability

 
“I was in (insert derivative name here) price action course and quickly realized how weak it is compared to yours. 
I’ve made over 20% in the last few months using your methods. I’m glad you poked giant holes in his price action strategies. 
Otherwise I’d still be waiting for pin bars and inside bars, missing hundreds of pips.
After posting my video How A Typical Pin Bar Entry Is A Retail One, many struggling traders started to see price action differently.
They realized how many times they were sitting on the sidelines doing nothing when others were making money. They also realized how waiting for ‘confirmation signals’ decreased their accuracy and profitability.
To learn why this is the case, watch my video below.
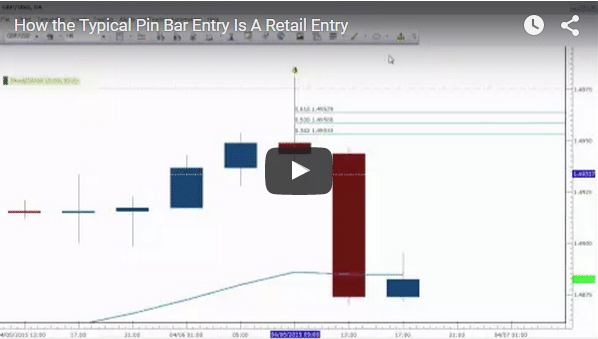
pin bar entry is a retail entry


Reason #4 Waiting for Confirmation Price Action Signals is Passive Trading

 
Hedge funds and bank traders are (if anything) passive when it comes to entering the markets.
Institutional traders would not (and could not) be making trading decisions once a daily pin bar has formed.
If they were doing this so consistently, they’d be picked off by HFT’s or predatorial funds who could see their entries a mile away.
This is on top of the fact they’d all be competing for the same liquidity and relative price, which would only mean a worse entry and lesser profits on the same trading idea.
A little investigation into how predictable these entries are will change your perspective on trading.
 

#5 The Pepsi Challenge

pepsi challenge
Ok, let’s say you are a devout believer the real way to trade price action is via confirmation price action signals.
Let’s say the above 4 reasons didn’t convince you. We can simplify this through a pretty simple test – The Pepsi Challenge.
Your challenge, should you choose to accept:
Walk into a dozen or two hedge fund offices, bank trading desks and prop trading firms. Then ask them these two simple questions:
 
1) If you don’t see a daily pin bar, engulfing bar, or inside bar, are you staying out of the market?
2) If you do see a daily pin bar, engulfing bar, or inside bar, are you loading up on your position even more than usual?
 
I’m willing to bet the answers to the above questions will be a resounding NO.
More likely, you’ll get several laughs, along with someone perhaps escorting you out of the office.
 

To Date

waiting 2ndskiesforex
As it stands right now, nobody has taken me up on this litmus test (let alone proven otherwise). I’m still waiting as I posted this challenge many months ago.
I am confident(while open to being wrong) that after you take this test, you’ll look at price action differently.
Once you let go of the current narrative, you’ll be forced to examine how order flow and the balance/imbalance between buyers and sellers is reflected in the price action. You’ll begin to see how liquidity impacts the PA and volatility.
And you’ll start to trade contextually, meaning through the price action context.
That is when your real training in PA begins, when you let go of the freshman narrative. You’ll also realize trading those 1-2 bar patterns does not build your trading skills.
If trading pin bars really built PA trading skills, then bank traders would be going through thousands of reps on those alone.
It takes no skill to find those signals and spend your time looking for them. And doing so discounts all the other candles in the process.
 

About All Those Other Candles…

 
All those other candles is what forms a structure. This ‘structure’ is (by and large) a representation of the order flow.
The order flow gets reflected in the PA, and this PA forms the price action context.
This is where your study should be.
 

In Conclusion

 
Looking for 1-2 bar patterns doesn’t make you a price action trader. It makes you candlestick trader, and that is a different approach to the markets.
When you investigate it, hedge funds aren’t trading via confirmation price action signals. And when you stop waiting for confirmation, you’ll find yourself getting better trade locations and higher + R per trade.
Looking at the market contextually will change your mindset. You’ll start trading and thinking in probabilities.
You’ll also discover how waiting for confirmation is a retail traders mindset.
With all that being said, do you agree or disagree with these forex confirmation price action trading misconceptions? Can you see how hedge funds aren’t trading price action signals this way?
Even if you don’t agree, please do comment and share below (in a non-negative tone por favor).
Regardless, I’m hoping you’ll really open up to other ways at trading price action.
Until then – may good health, trading profits and success be with you.

Key Talking Points:

  1. False Breaks Offer Great With Trend Trade Setups
  2. Trading the False Break with Pin Bars
  3. Trading the False Break with Engulfing Bars

In my prior article on trading the false break strategy part 1, I shared the basic definition of a false break, covered what is the price action and order flow behind false breaks, and how we can trade them.

In this false break forex trade strategy article, I will discuss how you can trade them using pin bars and engulfing bars, along with entry, SL and TP techniques.

To Recap What A False Break Is
I generally define a false break as one of the two following scenarios:

  1. A break above/below a prior candle that fails to close above/below that candle
  2. A break above/below a key level, quickly reversing that level, and sparking a counter-trend move

Below is another example of a false break:
forex price action false break strategy 2ndskies c2

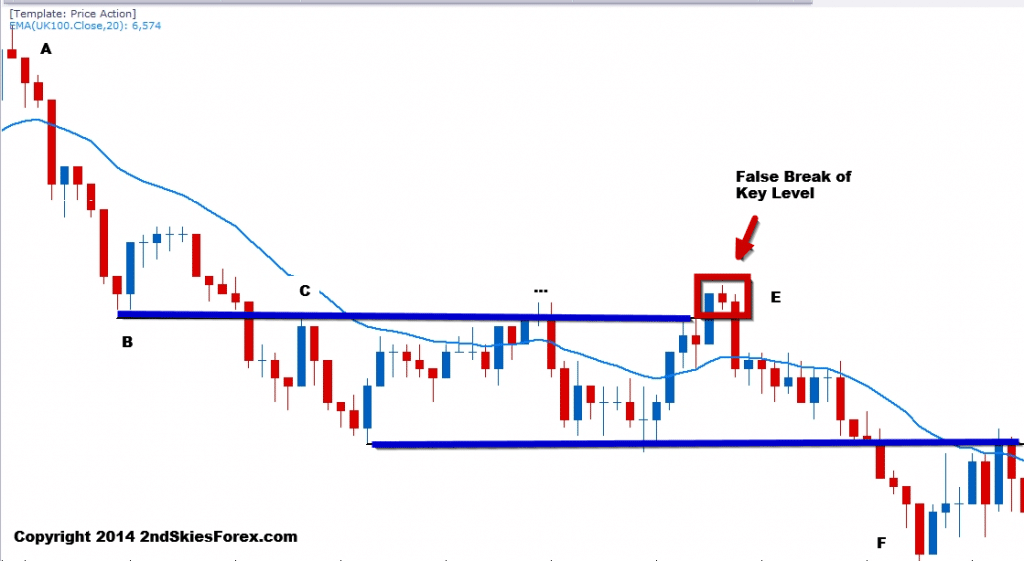
Looking at the chart above, we can see a clear downtrend, starting with A in the top left of the chart. The sell-off finds support at B, which eventually becomes a role reversal level at C.

Further along at E, we can see the textbook false break setup, just like we defined in the prior article. The pair breaks up above the key level CT (counter-trend), stalls, then sells off again breaking back below, and offering a great false break setup.

This sell off heads all the way down to F for a nicely profitable trade, and is a great example of a false break setup.

Now we will discuss how to trade the false break setup with a pin bar.

The Pin Bar + False Break Setup
Another type of false break setup is using the pin bar reversal pattern. In many ways, the pin bar by itself, can be a type of ‘false break’.

This is true if the body of the pin bar itself is housed within the prior bar. The breaking above/below the prior bar, and then closing back within that bar, is in and of itself, a type of false break.

What we are going to discuss is how we can use this to trade the false break strategy in combination with the pin bar.

A Pin Bar + False Break Example
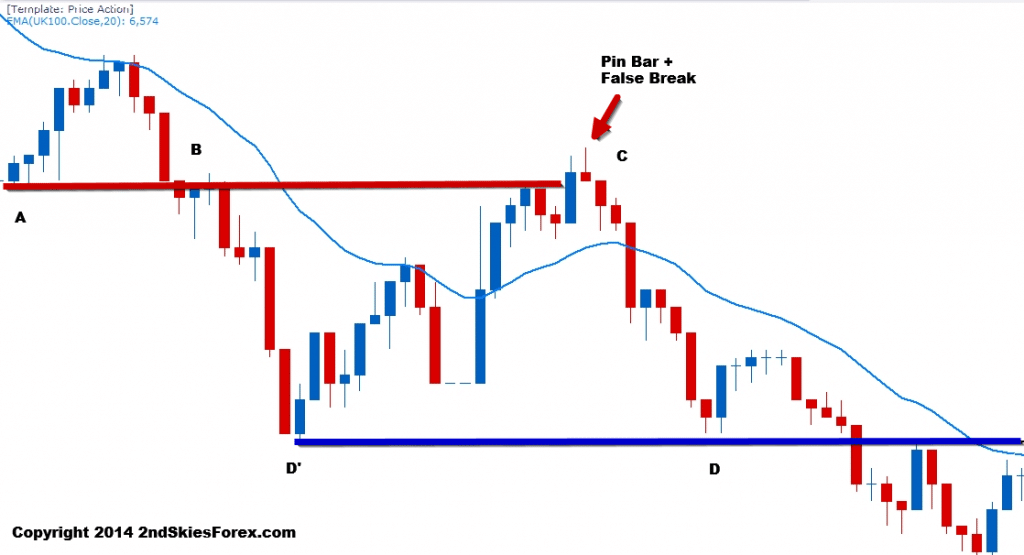
false break pin bar price action 2ndskiesforex c1

In this chart above, we can see at A (top left), there is a bullish move to the dynamic resistance (20 EMA). The sell off from the dynamic resistance to B only takes 3 bars, which means it was over 2.5x faster then the buying pressure at A.

From an order flow perspective, the sellers are stronger, since it took them less time to cover the same distance.

After breaking below the support level at B, the pair bounces at D’ towards C, (very same support level at A), hence a role reversal level.

Now notice at C how the pair briefly broke above A. If the buyers were really in control, they would have kept pushing prices. But the pin bar formed a false break above the highs of the blue bar (or prior bar).

This breaking above then back below, suggested a likely false break and more selling. The pair sold off from C to D, re-affirming the pin bar + false break setup.

NOTE: Observe how the support level at D and D’ formed another role reversal setup just after? This is a great example of trading with the trend.

Entry, Stop & Limit
If the pin bar represents a real false break, then the with trend direction should continue. Assuming I have read the price action context correctly, I generally like to enter using one of two methods:

  1. On a few pip break back below/above the key level
  2. On a pullback setup to the key level

The first entry method (more aggressive), can protect you from missing the move, as sometimes the false break never offers a second chance to enter.

For those wanting more ‘confirmation’, then I’d recommend the second entry method.

Now assuming the pin bar is the high/low in the move, I’ll put my stop just above/below the pin bar. For my take profit, if there is a prior level which caused the bounce/sell-off leading into the pin bar, then I’ll target that. One can use that as the only target, or as a first TP holding for a deeper move.

Trading the Engulfing Bar + False Break Setup
In reality, the engulfing bar + false break setup is not much different from the pin bar false break. I am still wanting to trade them with trend as much as possible, looking for a false break followed by an engulfing bar.

An Engulfing Bar + False Break Example
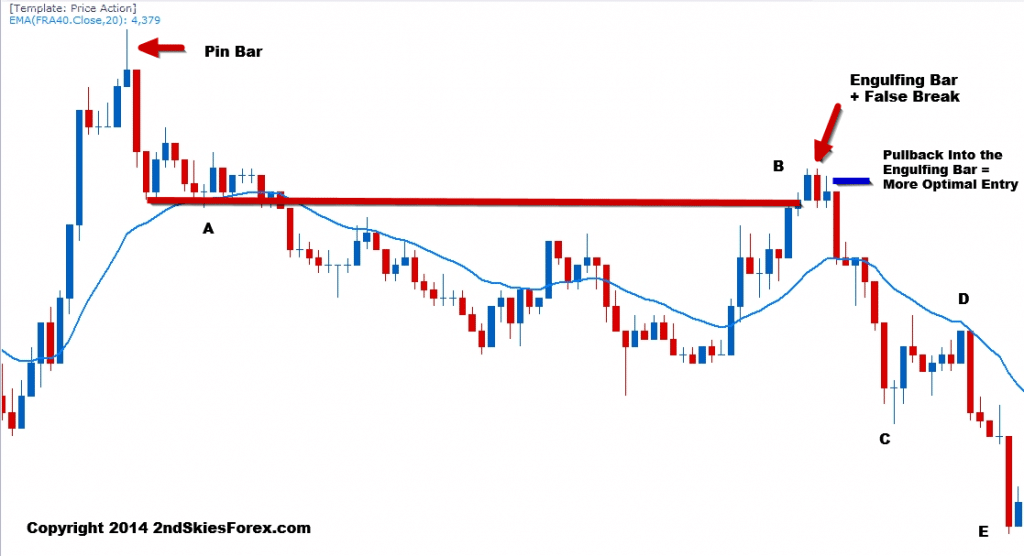
engulfing bar false break price action 2ndskiesforex c3

Turning to the chart above, we can see the strong selling stops at A. This forms a price action squeeze, which leads to a breakout and further selling.

The pair pulls back to B (the support level at A), and forms a false break. This is immediately followed by an engulfing bar.

Now ask yourself, if the bulls were truly in control, why did the price action immediately reverse after taking out A? This should have been a clue to watch for a false break.

You’ll notice right after the engulfing bar was an inverted pin bar. This is a failed attempt to rally, suggesting the buyers tried to push higher, but failed. What results is heavy selling from the open of the next bar down to C, and eventually E, resulting in a nice profit.

NOTE: Take a look at the move from C – D. This is a corrective pullback following an impulsive move. The corrective pullback went into the dynamic resistance (2o EMA), and then sold off heavily after.

This would have represented a great pullback setup, and is a good example of how impulsive and corrective moves manifest.

impulsive and corrective price action 2ndskiesforex
Entry, SL & TP
The entry, stop loss and take profit techniques are the same as the pin bar + false break. The only variation, would be if the engulfing bar closes back below/above the key level.

If it does, I’ll look to take a pullback into the engulfing bar, which is far more optimal entry as a whole. For more information on why the pullback is a more optimal entry for the engulfing bar, click here.

To Recap
In today’s false break forex trade strategy article, I talked about how false breaks offer great with trend setups. I then went into two more examples of the false break strategy, showing how you can trade them with pin bars and engulfing bars.

I shared entry, SL and TP techniques, along with explaining the price action and order flow behind these great setups.

These are just a few of the false break techniques available. If you want to learn more about trading the false break, along with other forex trading strategies, you can read more about my Price Action Course & Daily Members Commentary here.

While my trading team and I are mostly on vacation for the month of July, I wanted to write a brief article giving 2 key clues to understanding forex support and resistance levels, which is also a follow up to my prior article the best support and resistance levels part 1.  If you can learn to understand these two key points, you will be able to detect key levels, when they are more likely to hold, and when they are more likely to be broken.


1) Prior History, Time Degradation, & Reactions to Key Levels in the Past
When analyzing to see if a level is one where traders are more likely to place trades around, we have to see how price reacted to those levels in the past.

Did price react very strongly to it in the past, say approach it one time, then reverse sharply off of it?  If so, then its very likely the next time it approaches that level, traders will place orders around there expecting a similar reaction.


Why?

If price produced a very violent or strong reaction to it in the past, this was because a large amount of money was put on the line stating ‘this is the line in the sand, this is highly over-valued or under-valued and we are placing a large bet here’.  When this happens, its the first institution to get in that has the highest chance for profit, because they are the first to try and reverse the pair, thus getting the best price. But they also carry the most risk.

Regardless, if their reversal attempt works, other institutions will catch wind of this, and attempt to get in as close to the rejection level as possible.  It really becomes a race between the institutions who can get the best price so many vie for it.  This helps to further fuel the rejection and create a stronger reaction.

Smart traders take note of this level producing such a strong rejection and will more than likely take a play off of it a second time expecting it to hold.  If an institution placed a large amount of money at a key level, they will likely defend it a second time (along with others as well).  So expect this level to hold.

But…the reaction the second time around is usually not as strong.


Why?

Because more people are aware of it the second time.  If it was a support level that produced a violent bounce, the second time around the sellers heading into that level will take profit.  This means there is less of an opposing force on the sell side, so when the market bounces, there are less sellers who have to exit and thus fuel the counter trend play.

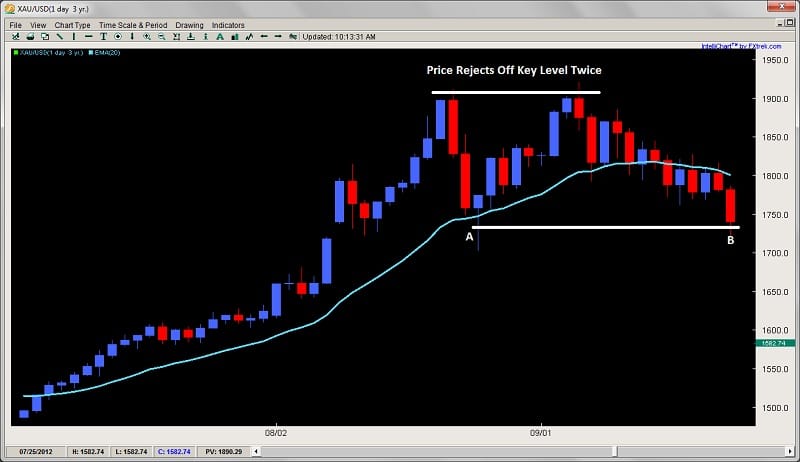
A good example of this is below in the daily Gold chart


Chart 1.1 Gold Daily
2 key clues to understanding support and resistance levels 2ndskiestrading.com july 20th

Gold was in a strong uptrend for all of 2011, eventually reaching $1900 an oz after climbing 3 out of every 4 days from July into mid August.  Looking at the chart above, gold sold off quite heavily after reaching the $1900 level, selling off almost $200+ in 3 days.

Notice how the second time it approached this level, it held, but took over 13 days to sell off the same $200 amount.  The first reaction was far more violent, while the second more tempered.  The level held just fine, but when you see these situations, expect the response to be not as violent but still providing a great trade opportunity.

So anytime you see violent reactions to a level, look to place a trade at that level, expecting it to hold and produce a similar measured move.  Obviously, if the reaction happens on a higher time frame, there is a greater chance it will produce a similar reaction.  Whereas on a lower time frame, this will probably be less likely so be a little more choosy when looking to make a play like this.

Other factors to consider besides the strength of the reaction when understanding support and resistance levels is if the level produced a breakout pullback setup, has held several times in the past, and how much time the market spent at those levels.  All of these factors will determine if there is a good setup there at that level.


2) Current Price Action
So often when people talk about levels, they only focus on the past and seem to forget to look at how the price action is behaving in the present.  Just because a level held nicely in the past doesn’t mean it will this time and you’ve probably experienced this, expecting a level to hold only to watch it get broken.

By learning to read the price action in real time, you can see if the market is approaching it with strength or weakness, impulsive-ness or corrective-ness, and then use this information to determine if a level will hold the oncoming assault or buckle forming a breakout or trend continuation.

Levels are just areas where traders place orders, but if the defenses of those levels are weak, they will not withstand the attack, so it is crucial you are always watching price action in real time to determine if this will hold.

Although I place my orders at key levels I think will hold, if the market is approaching it with several signs of strength, then I will consider waiting for a price action trigger at this level, or for it to hold before placing my order.

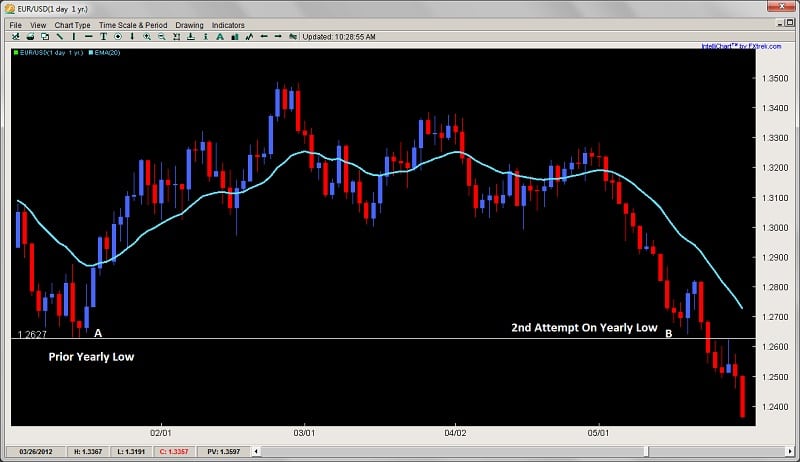
Below is an example of a key level that held in the past, but completely failed the second time with the market showing strength and signs it was going to fail.


Chart 1.2 EURUSD Daily
key clues to understanding support and resistance levels 2ndskiestrading.com july 20th chart 2

When the EURUSD started its massive sell off in late April, it did so in impressive fashion shedding over 600pips in 13 days with only one bull candle in the entire selloff.  When it was approaching the yearly low (at B on the chart) around 1.2627 in 2012, notice how the selling started to pause going from really large impulsive candles to two small doji-like candles.  The transition or change from large candles to small suggested hesitation on the sellers part heading into a key level they suspected might hold.

This weakness and hesitation was a good real time price action clue the market was likely to produce a bounce from the yearly low, and bounce it did, forming an engulfing bar which bounced about 150pips in two days.  Many of our price action traders got in on this one, not only reading the weakness, but also using quantitative data on price action specifically for the EURUSD which communicated a likely reversal.

But notice what happens after a two day bounce – price then sells off aggressively again taking out the prior days lows and eating into over 75% of the two days’ gains.  This communicated to us in real time the sellers came back in force and were making an aggressive attempt to take out the level.  So this was a good price action clue not to place another buy order at this level.

Notice how after it broke, the level served as a key role reversal level which gives us an opportunity to get short and join the trend.

There are many other clues one can use to read the price action in real time to determine if the level will hold or break, but these are just a few hints you can look for, along with looking for price action triggers off these key levels and quantitative data to support your level as well.


In Summary
So these are just 2 key clues you can use to understand forex support and resistance levels.  It is critical to understand specifically how the market responded to a level in a past to determine first if it is a good level to make a play on.

But, so many times I hear traders talking only about how the market reacted in the past, and not paying attention to how the price action is developing in the present – which is a real time communication to the underlying order flow behind the attack on the support or resistance level.  By learning to read this, along with level 2 quotes, you can greatly increase your ability to understand and place trades around key levels, either using them for reversal plays, breakout pullback setups, or looking for potential breakouts around these key levels.

For those wanting to learn to trade price action and understand resistance and support levels, get access to the traders forum, quantitative data on price action, lifetime membership & more, visit my forex price action course page.


Today I am going to give a lesson on how to find some of the best support and resistance levels in the market.  If I had to say – I think there are three types which are the best support and resistance levels you could find.  But it would take a long time to go into each type, what are the characteristics of each, what they mean from an order flow perspective, and how to trade each type.

So I am going to cover in today’s lesson, what are some of the most critical variables to look for when evaluating support and resistance levels.  If you can learn to spot these levels, read the price action and key variables before the market reaches these levels, you will greatly enhance your trading, by finding better entries, knowing how the market is likely to react off a level, and how to increase the probability of your trades.

By first learning to read these key variables which I will list below, they will provide you with a lot of information in terms of;
-how the order flow is relating to them
-how these levels will improve the probability your trade or rule based price action system
-how you can trade these key levels 

Note: I want to hear your feedback on this lesson, like what key points stood out for you, what you found useful, how you can apply this to your trading, or…even if you want to throw tomatoes at me, I want to hear your comments 🙂

I will start this lesson by talking about what are some key things to look for when evaluating support and resistance levels.  I will then describe with some details how each variable informs you of the order flow behind the price action.  Then I will go over some basic methods of how you can trade them.  I will also give examples to demonstrate how these elements work, then end with a brief overview of what we covered.


Key Things To Evaluate Support and Resistance Levels

If I had to list what are the key things I use to evaluate support and resistance levels, it would be the following;

1) How price reacted to this level in the past (held, became a breakout – pullback level, bounced violently or timidly off of it)
2) How significant is it (lower time frame, higher time frame, held for how long?)
3) How is price reacting or responding to it now
4) What is the speed or impulsiveness price is approaching it now
5) What is the price action context prior to this level

All of these things communicate information to me about the uniqueness of this level, how the buyers/sellers reacted towards this level in the past, how likely they will respond to it in the future, and what they are most likely to do at this level.


Zones & Areas

It should be noted that I do not consider support and resistance levels to be lines in the sand, but more of a ‘zone‘ or ‘area‘.  That means I do not consider a resistance level to be one price, but likely several pips on either side.  This could be due to differences in price feed, server time, what other traders think of that level, and how they would play it.

A scalper will more likely get as tight to the level as possible, but scalping orders rarely are large in volume or market movers.  However, a swing trader or large institution will likely be getting in at several levels, and the level you might be spotting may be one of them they are placing a large order at.

Because of this and all the different ways institutional players relate to these levels, support and resistance levels for me are zones or areas which could be anywhere from a few pips wide to 10+, maybe more depending upon the time frame the level relates to.

Obviously a level from a weekly time frame over years would have a little more play then an intraday level on the 1hr chart so take this into consideration.


What Each Variable Communicates

Although I could spend an entire treatise writing about all the things each variable above communicates, I will go over the key points here.

1) How Price Reacted To This Level In The Past – this is a big one as it tells me what the major players thought of this level.  Was the pair highly over/under valued here and it produced a violent reaction in the past?  If so, then the first time it comes back to this level, we can expect a strong reaction.  Why?

If the reaction off a level was fast, that translates into heavy buying/selling with some large player initiating the rejection.  This is followed by other players quickly rushing in to get as close to that price as possible, essentially chasing for the best price, but agreeing with the initial rejection.  These levels are defended with a lot of money, and if price does not come back for some time because it traveled fast and furious off this level, then the next time it gets there (especially if it’s the first time back), expect a strong reaction.

Exhibit A – Gold Daily Chart
best support and resistance levels gold chart 1 2ndskiestrading.com

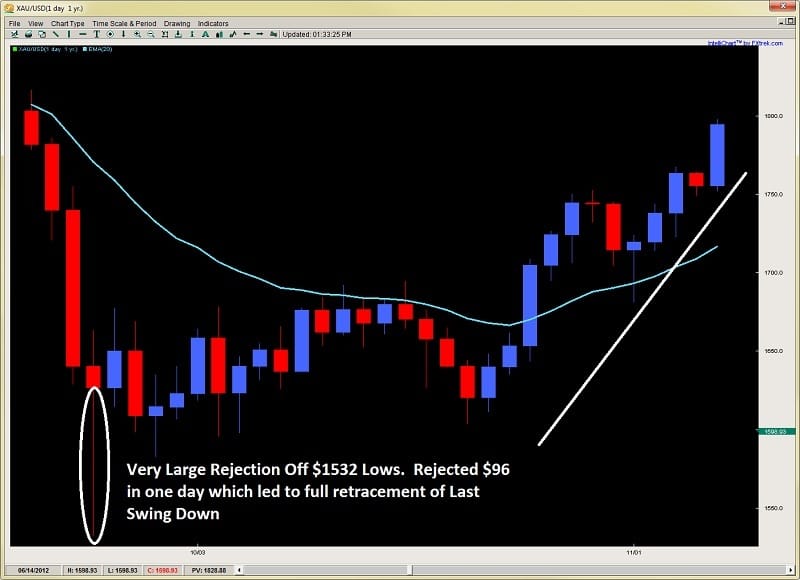
When gold sold off massively due to huge margin increases by the metals exchanges, it crumbled hard and everyone was wondering where the bottom was.  It found it eventually at $1532 where in one day, it opened at $1640, jumped up $23, dropped $130, then bounced $96 from the lows which was quite an amazing rejection inside one day.  This is a violent reaction, so traders were definitely taking notice of it the next time it approached this level.  Can you guess what happened when it got there again?


Second Approach Gold Chart
best support and resistance levels gold chart 2 2ndskiestrading.com

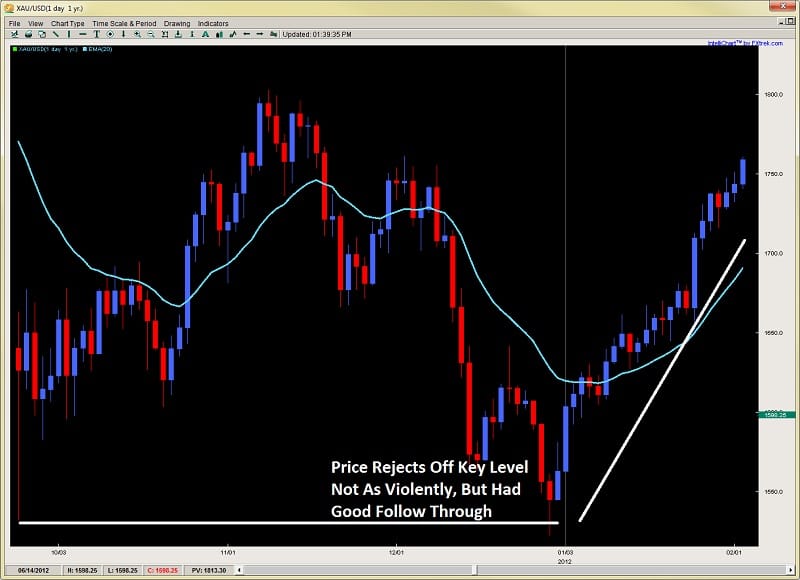
As you can see, price held this level with a tiny breach, then bounced the next 4 days in a row, suggesting strong follow up buying on this rejection.  The first time back usually is a slightly lesser bounce since many know of the level, and thus less traders are trapped (or surprised) from a violent rejection the first time around.  But usually, this level will hold.

Remember, this is one scenario of how price has related to it in the past.  All the other types of reactions communicate a different story.

2) How Significant Is It (lower time frame, higher time frame, etc) – this really has to do with time as all support and resistance levels have what I call a ‘time degradation‘ to them.  Simply put, traders have a memory, but they are more inclined to take recent information as more valuable then information a while ago, especially if they are short term traders.  Generally, higher time frame levels will dominate and last longer than lower time frame levels.  Also, when possible, I’m more interested in drawing levels that are more likely to maintain the trend as that is the more probable scenario.  I particularly relate to these when reading the impulsive vs. corrective moves in the market.

For more information about understanding impulsive vs. corrective moves, make sure to watch the video here.

But once you have established the trend according to the impulsive vs. corrective series, look for breakout pullback level where the trend continued, or major swing highs/lows where the trend paused and pulled back to.  These will often present great opportunities to get in with trend.

3) How Price is Reacting To It Now – Is price closing on a support level, and just sitting there, with smaller and smaller bounces off it? If so, a breakout through the level is more likely as there is no strong buyers able to push back, and the sellers continue to squeeze them out of the market.  Was there a strong pin bar reversal off this level?  If so, it could be telling you it will likely hold on a second attempt and start a reversal, hence look for an entry close to the level.  How price reacts to the level in the moment can tell you if it’s likely to hold or not, but this analysis should be done before it reaches the level.

Often times the market will demonstrate a price action reversal signal at these levels.  Keep in mind, this is the ‘effect‘ of how players responded to the level, not the cause.  Order flow was the initial cause, and the level was the location.  Everything else was a response to the initial reaction off this level.  Hence these price action triggers are often ‘secondary entries’ (or sub-optimal) regarding the level.  Sometimes a price action trigger, say a pin bar on a 4hr chart can be an engulfing or piercing bar on a 1hr chart.  So sometimes it helps to look at a lower time frame to see what the more micro responses off this level are, or what the price action context was leading up to it.

But no matter what, there will always be clues as to what the major players are doing at this level, and what the more likely scenario is.  Look for impulsiveness (strength) off the level, or weakness (corrective price action) off this level for initial clues.

4) What Is The Speed Or Impulsiveness Price Is Approaching The Level – this will really tell you a great deal of information whether a level is likely to hold or not.  If you are trading with trend, and with the move when it is approaching a level, how strong the move is heading into it, and what is the underlying characteristics behind the price action (speed, acceleration, etc), will tell you what is more probable.

If a level is an intraday level, or one from only a day ago, a really impulsive move is likely to break through it. If it’s a daily low or high, or a level that held for a week or longer, it will have a better chance of holding. Think of it like a moving object.  Consider the size of the object in relationship to what the obstacle in its way is.  Normally, force x acceleration (& mass) will tell us whether the obstacle ahead will cave or not. Unfortunately, we do not have exact information about the orders at a level, such as the number and size of them which would equate to mass and volume of the object.  Level 2 quotes would help in this fashion, but if you don’t have that, then what?

Why not use the other principles above, such as;
-how did price react there in the past
-how significant is it
-how is price reacting to it on first touch

Weigh those against the force, or impulsiveness of the move, and you’ll be able to get a better idea.


A good example would be the following chart below of the AUD/USD on the daily time frame
best support and resistance levels 2ndskiestrading.com AUDUSD chart 1

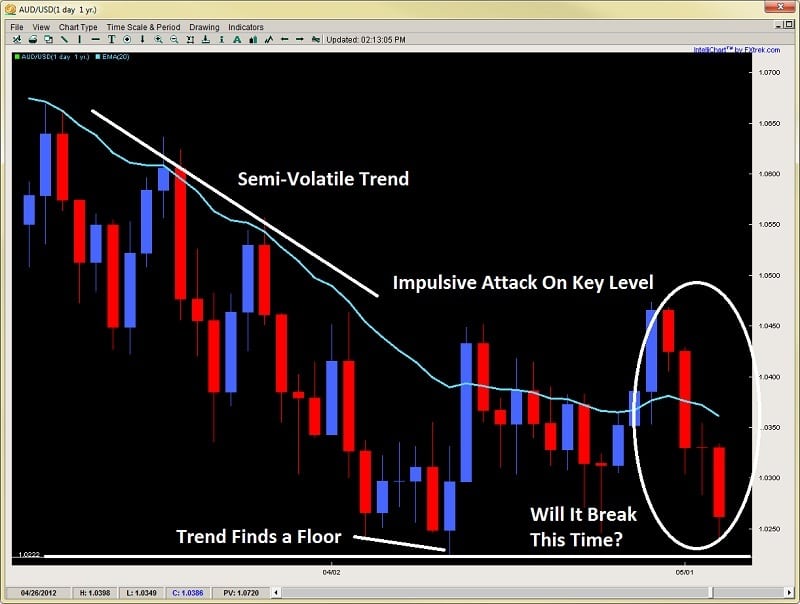
Price approaches the level with some volatility, as there are solid moves on both sides of the fence with bears maintaining control on the way down.  Price bounces off the level with a piercing pattern and then a second attempt forming a pin bar reversal.  But then after a small retrace, price attacks the level with vigor, selling off 4 days in a row, taking out the last 13 days gains.  Does this resonate strength to you?  Do you think it will break?  See the chart below

Exhibit B
best support and resistance levels 2ndskiestrading.com AUDUSD chart 2

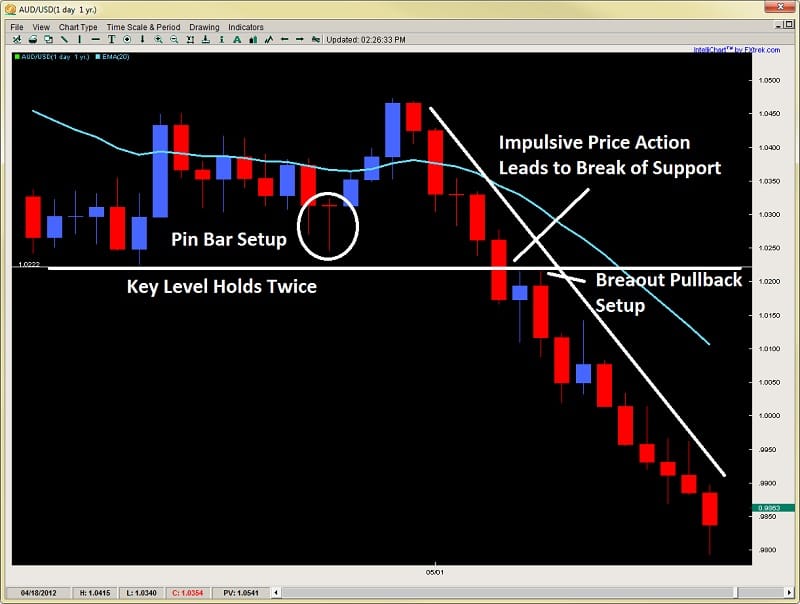
As you can see, price was exhibiting a lot of strength and impulsiveness heading into the support level. There were definitely some clues ahead of time this was going to break.  Such as how price barely lifted off the level each time, and attacked it twice without ever gaining much ground to the upside.

Keep in mind, the trend was already down leading up to it, so with trend traders used these pullbacks to get back in the trend.  The last time they said enough is enough, and went to take out the barriers at this level.  The buyers at the support level likely exhausted themselves on the first two rejections which failed to gain traction.

Putting all these components together would have communicated a breakout was likely, which would have helped your current short, or give you a second opportunity to get back in on a textbook breakout pullback setup for a high probability-low risk trade.


In Summary

So there you have a few key variables to look for in finding the best support and resistance levels. Remember, price action patterns form at these levels and are the ‘effect‘, not the cause of the move. They do communicate information to us as traders, what we are looking for is the price action context before we reach these key support and resistance levels.  Hence, it is these key levels where orders are being placed first.

Thus, by learning how to read the price action and the key variables I listed above, you can greatly improve your ability to spot good setups, improve your entries, placing trades where weak players are getting in, and the stronger players are looking to enter.

Please make sure to comment below, and click on the like buttons to share this article 🙂

For those wanting to learn to trade price action, get access to the traders forum, lifetime membership & more, visit my price action course page here.