The learning process never ends for a trader. The market is always evolving and you have to adapt. Algorithmic trading was about 3% of the FX market in 04′. Now 28% of it is just HFT’s alone! Think that has changed the intraday price action? Absolutely!
Thus, you must always be learning, evolving and challenging yourself. There are always refinements and greater depths to what you are doing, whether you are trading price action, ichimoku or other rule based systems.
Regardless of your skill level in trading, you are going to make mistakes. I make mistakes, but I learn from them with alacrity. I quickly analyze what I did wrong, visualize what I would do differently, clear my mindset and get back to business. The difference between a professional & beginning trader is usually two-fold;
1) they make less of the typical mistakes beginners do
and
2) they rebound much faster, control the damage quicker and get back to business
Analyze your last year of trading in your journal. I’m willing to bet if you eliminated just one or two mistakes you continually repeat, your current losing year would have been a profitable one. If you ended the year break-even, then it likely would have been highly profitable.
Eliminating mistakes is one of the fastest ways to profitability. The sooner you discover, eliminate and transform them, the faster your equity curve will climb.
Thus, in the spirit of this, I will share my top trading mistakes for 2012 in the hopes you can learn from them.
1) Trading and Investing are Two Different Things
I am a trader first and foremost, but I also am invested long term in physical gold.
To ‘invest’ in physical gold, you constantly have to understand what is happening in the physical AND paper market. It helps to study central bank buying of gold, physical supply, how it is used as a safe haven against bad governments, etc.
However, I also trade gold using intraday price action strategies, and sometimes my methods/opinions on one get mixed with another. Long term I am a bull on gold, and have been since 2004/05 back at the $400 levels.
Many times in the last 3 months, I was long paper gold. Yet intraday price action would be screaming for me to get short. My broker allows hedging – so why wasn’t I shorting physical? Because my long term investing bias was interfering with my short term trading methods.
One of my top trading mistakes for 2012 was forgetting that I am a trader first and foremost, and to not let my bullish bias or investing strategies interfere with an obvious price action setup.
A good example is I bought paper gold at $1633, which I blogged about as a high probability breakout. At one point I was up 51x my risk, meaning for the 300 pips I was risking, I was up about 15200 pips.
By the time I walked away from the trade, I was only up 6500 pips. I didn’t follow exit rules because of my long term investment bias.
Remember, a trader and investor are two different things, and you must understand the difference.
2) Trading Against Impulsive Price Action
One of the base models I use for trading is understanding impulsive and corrective price action.
To sum it up briefly, impulsive price action moves are when the institutional market is heavily buying or selling and driving the price action directionally. With training and practice, you can learn to read the order flow behind price action, particularly by identifying these impulsive price action moves.
A few times this year I traded completely against these moves. Case in point – meet exhibit A, ironically on……wait for it……Gold!
Gold 4hr Charts
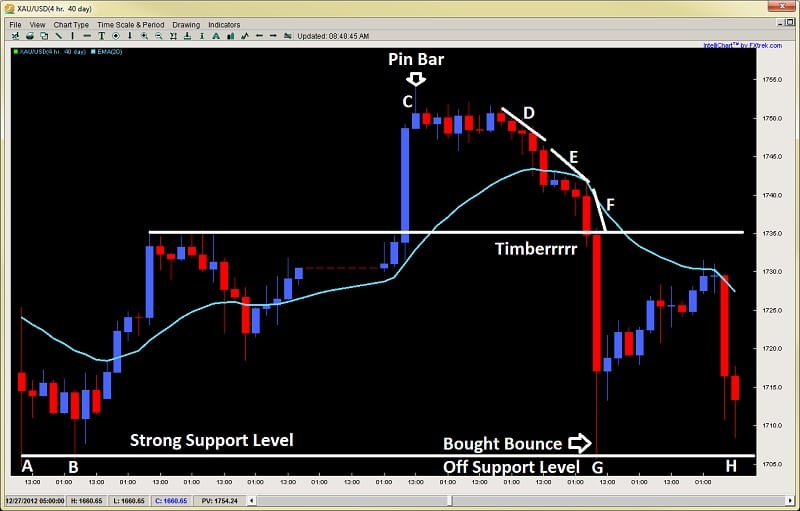
Looking at the chart above, you will notice on the bottom left points A and B which showed strong price action rejections. Buyers stepped in at this level, driving prices almost $50 higher in about 6 days.
At C you will notice the pin bar at C which was the second sign the bullish move was ending. Any idea what the first was?
Regardless, after the pin bar, price action failed to make a HH (higher high) and started with selling off impulsively at D, then more sellers came in at E, and by F, once it broke the role reversal level, price got monkey-hammered dropping $30 in 4 hours.
I had a buy order at the support level at G, so made some profit on the bounce, but missed the fact the market was still showing impulsive price action selling.
So at H what did I do? I bought some again, hoping for a similar move. The result is below, but you get the idea.
Gold 4hr Chart Exhibit B

At the support level where my first long worked out, I went long again at H and the same level. Shortly after I was stopped out.
Instead of realizing I was trading against the trend and impulsive price action, I was looking for a reversal. I consequently missed the obvious breakout pullback setup at the same level I was looking to get long, which then became a role reversal level. This is what happens when you trade against the trend and your system.
Not only do you miss several good with trend setups, but after you get stopped out, you usually miss the follow up trade from your price action system to take advantage of the move.
3) Let Your Trade Run Until Your System Tells You To Exit
Barring any extreme or black swan event, I usually just let my trade run until my rule based system tells me to exit.
However on a recent buy on the GBPJPY, after getting a great entry and banking about +300 pips, I exited the trade, even though my system was still telling me to hold long and hadn’t given an exit signal.
Looking at the chart below, you can see on the top left at B a critical resistance level which started the massive 300 pip sell off.
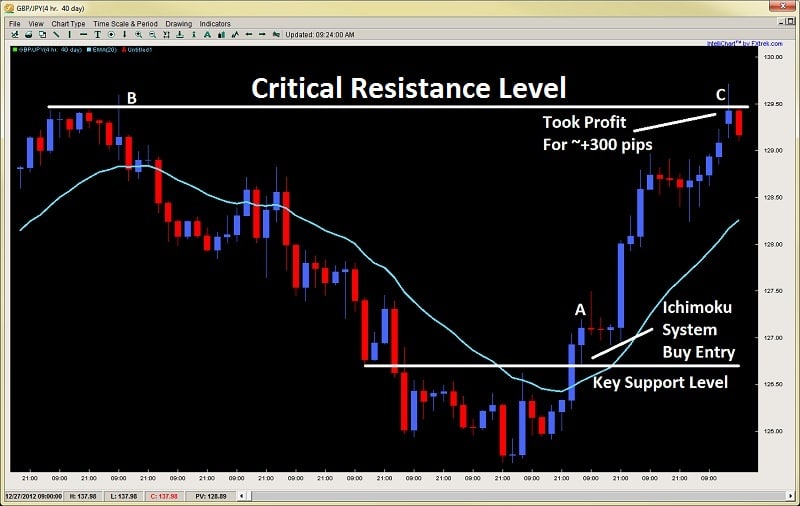
Price started to show signs of exhaustion, and started a reversal. My ichimoku strategy picked up a buy order just above 126.60. Shortly after, price climbed rapidly gunning it for the same resistance level at 129.50. After the weekend gap rejected, I took profit banking about +300 pips.
Not so bad you say…until you look at the chart below.
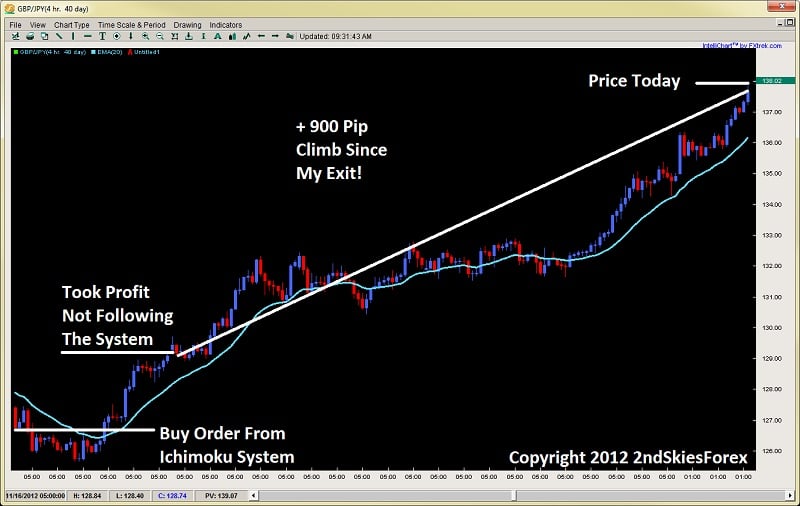
Not only did my system hold on for another + 300 pips, but it gave me a re-buy signal around 132 and is still currently long today. I missed that one as well from being ‘upset’ about exiting early. Needless to say this would have over tripled my profits. Even though my system never gave me an exit, I got out of the position.
Not letting runners run is one of the most costly mistakes a trader can make. Yes, it is important to understand what is a high quality signal, but I’m guessing if you let just 10 of your trades run until the system gave you an exit, you would have made almost double your profits on those 10 trades. For me, it was actually 2.4x more. Food for thought.
In Closing
Part of trading is making mistakes, but a key component of your success is learning from your mistakes and making less of them over time. Regardless of your skill level or how long you have been trading, you will make mistakes. Anyone who only posts their successes and doesn’t admit to their failures is hiding behind a wall of fear and a false reality.
I make mistakes and I’ve been doing this for 12 years. But I learn from them continually and make less of them as time goes on. This translates into more profits, smaller drawdowns, less emotions, and a smoother equity curve.
Eliminating mistakes is the fastest path to making more profits. But the first step is becoming aware of them. This is where the trading journal comes in handy. If you’ve made 300 trades last year, are you really going to remember every mistake you ever made? Unlikely, this is why you have a journal, to help you become aware of your mistakes.
The second step is to actively work on eliminating and transforming them. If you repeat a mistake over and over again, then the cause is likely psychologically, and something that can be re-wired through ERT training and developing a successful trader mindset.
But the bottom line is you can transform your mistakes into strengths, and most definitely into greater profits. In almost all cases, making less mistakes can be the difference between a winning and losing day, month or year. And in almost all cases – will lead to significantly greater profits.
Kind Regards,
Chris Capre
