While my trading team and I are mostly on vacation for the month of July, I wanted to write a brief article giving 2 key clues to understanding forex support and resistance levels, which is also a follow up to my prior article the best support and resistance levels part 1. If you can learn to understand these two key points, you will be able to detect key levels, when they are more likely to hold, and when they are more likely to be broken.
1) Prior History, Time Degradation, & Reactions to Key Levels in the Past
When analyzing to see if a level is one where traders are more likely to place trades around, we have to see how price reacted to those levels in the past.
Did price react very strongly to it in the past, say approach it one time, then reverse sharply off of it? If so, then its very likely the next time it approaches that level, traders will place orders around there expecting a similar reaction.
Why?
If price produced a very violent or strong reaction to it in the past, this was because a large amount of money was put on the line stating ‘this is the line in the sand, this is highly over-valued or under-valued and we are placing a large bet here’. When this happens, its the first institution to get in that has the highest chance for profit, because they are the first to try and reverse the pair, thus getting the best price. But they also carry the most risk.
Regardless, if their reversal attempt works, other institutions will catch wind of this, and attempt to get in as close to the rejection level as possible. It really becomes a race between the institutions who can get the best price so many vie for it. This helps to further fuel the rejection and create a stronger reaction.
Smart traders take note of this level producing such a strong rejection and will more than likely take a play off of it a second time expecting it to hold. If an institution placed a large amount of money at a key level, they will likely defend it a second time (along with others as well). So expect this level to hold.
But…the reaction the second time around is usually not as strong.
Why?
Because more people are aware of it the second time. If it was a support level that produced a violent bounce, the second time around the sellers heading into that level will take profit. This means there is less of an opposing force on the sell side, so when the market bounces, there are less sellers who have to exit and thus fuel the counter trend play.
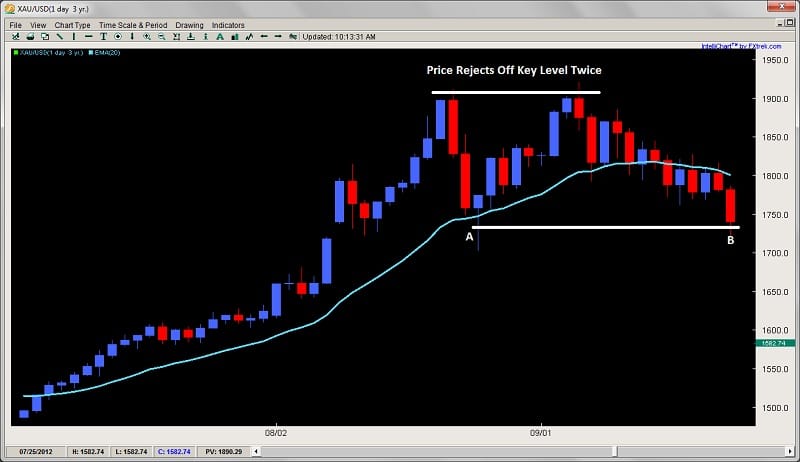
A good example of this is below in the daily Gold chart
Gold was in a strong uptrend for all of 2011, eventually reaching $1900 an oz after climbing 3 out of every 4 days from July into mid August. Looking at the chart above, gold sold off quite heavily after reaching the $1900 level, selling off almost $200+ in 3 days.
Notice how the second time it approached this level, it held, but took over 13 days to sell off the same $200 amount. The first reaction was far more violent, while the second more tempered. The level held just fine, but when you see these situations, expect the response to be not as violent but still providing a great trade opportunity.
So anytime you see violent reactions to a level, look to place a trade at that level, expecting it to hold and produce a similar measured move. Obviously, if the reaction happens on a higher time frame, there is a greater chance it will produce a similar reaction. Whereas on a lower time frame, this will probably be less likely so be a little more choosy when looking to make a play like this.
Other factors to consider besides the strength of the reaction when understanding support and resistance levels is if the level produced a breakout pullback setup, has held several times in the past, and how much time the market spent at those levels. All of these factors will determine if there is a good setup there at that level.
2) Current Price Action
So often when people talk about levels, they only focus on the past and seem to forget to look at how the price action is behaving in the present. Just because a level held nicely in the past doesn’t mean it will this time and you’ve probably experienced this, expecting a level to hold only to watch it get broken.
By learning to read the price action in real time, you can see if the market is approaching it with strength or weakness, impulsive-ness or corrective-ness, and then use this information to determine if a level will hold the oncoming assault or buckle forming a breakout or trend continuation.
Levels are just areas where traders place orders, but if the defenses of those levels are weak, they will not withstand the attack, so it is crucial you are always watching price action in real time to determine if this will hold.
Although I place my orders at key levels I think will hold, if the market is approaching it with several signs of strength, then I will consider waiting for a price action trigger at this level, or for it to hold before placing my order.
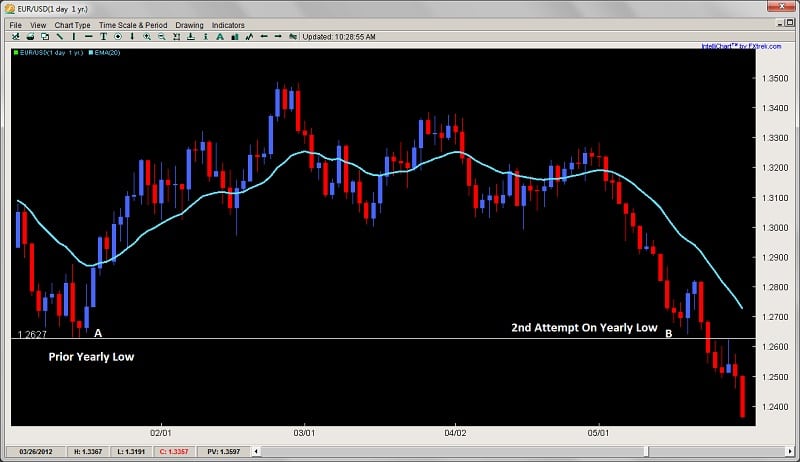
Below is an example of a key level that held in the past, but completely failed the second time with the market showing strength and signs it was going to fail.
When the EURUSD started its massive sell off in late April, it did so in impressive fashion shedding over 600pips in 13 days with only one bull candle in the entire selloff. When it was approaching the yearly low (at B on the chart) around 1.2627 in 2012, notice how the selling started to pause going from really large impulsive candles to two small doji-like candles. The transition or change from large candles to small suggested hesitation on the sellers part heading into a key level they suspected might hold.
This weakness and hesitation was a good real time price action clue the market was likely to produce a bounce from the yearly low, and bounce it did, forming an engulfing bar which bounced about 150pips in two days. Many of our price action traders got in on this one, not only reading the weakness, but also using quantitative data on price action specifically for the EURUSD which communicated a likely reversal.
But notice what happens after a two day bounce – price then sells off aggressively again taking out the prior days lows and eating into over 75% of the two days’ gains. This communicated to us in real time the sellers came back in force and were making an aggressive attempt to take out the level. So this was a good price action clue not to place another buy order at this level.
Notice how after it broke, the level served as a key role reversal level which gives us an opportunity to get short and join the trend.
There are many other clues one can use to read the price action in real time to determine if the level will hold or break, but these are just a few hints you can look for, along with looking for price action triggers off these key levels and quantitative data to support your level as well.
In Summary
So these are just 2 key clues you can use to understand forex support and resistance levels. It is critical to understand specifically how the market responded to a level in a past to determine first if it is a good level to make a play on.
But, so many times I hear traders talking only about how the market reacted in the past, and not paying attention to how the price action is developing in the present – which is a real time communication to the underlying order flow behind the attack on the support or resistance level. By learning to read this, along with level 2 quotes, you can greatly increase your ability to understand and place trades around key levels, either using them for reversal plays, breakout pullback setups, or looking for potential breakouts around these key levels.
For those wanting to learn to trade price action and understand resistance and support levels, get access to the traders forum, quantitative data on price action, lifetime membership & more, visit my forex price action course page.

