This is the third installment introducing details to subjects which are not really discussed or talked about when it comes to Ichimoku Trading, that of using Ichimoku Time Theory and Ichimoku Wave Theory. Remember, according to Goichi Hosada (the creator of the Ichimoku Cloud), the Ichimoku trading system is based upon three pillars, and they are;
1) Ichimoku Time Theory
2) Ichimoku Wave Theory
3) Ichimoku Price Theory
This Ichimoku trading system article will be focused on introducing the key principles to Ichimoku Price Theory. For those wanting a review of the other two, you can find those articles by clicking on the links above.
It should be noted to really understand and apply Ichimoku Price Theory, you will need an understanding of the prior two, particularly a good grasp of the Time Theory which is used quite extensively with the Price Theory.
The goal of this article will be to introduce the most basic components of the Price Theory, which may be considered the most complicated of the three. I will discuss the main price calculations, how to formulate them, give examples of each one and some helpful tips when applying the Price Theory to Ichimoku trading.
Introduction To Ichimoku Price Theory
First, it should be noted we do not want to see these price targets as absolutes. They are really guides to give us highly probable approximations as to where the market is likely headed during a particular wave or move. These methods take practice to learn how to use, so take your time with them, but never look at this as an absolute target.
In reality, there are 4 basic price measurement methods according to the theory, however the 4th is generally regarded as a low probability event and takes a considerable amount of skill to spot and use. So for our purposes, we will only use the basic three which are the most common and critical to learn.
The three main price measurements are known as;
1) The V Calculation = B + (B – C)
2) The N Calculation = C + (B – A)
3) The E Calculation = B + (B – A)
The formulas for them are listed above, but I will show you a diagram to better understand them which is below.
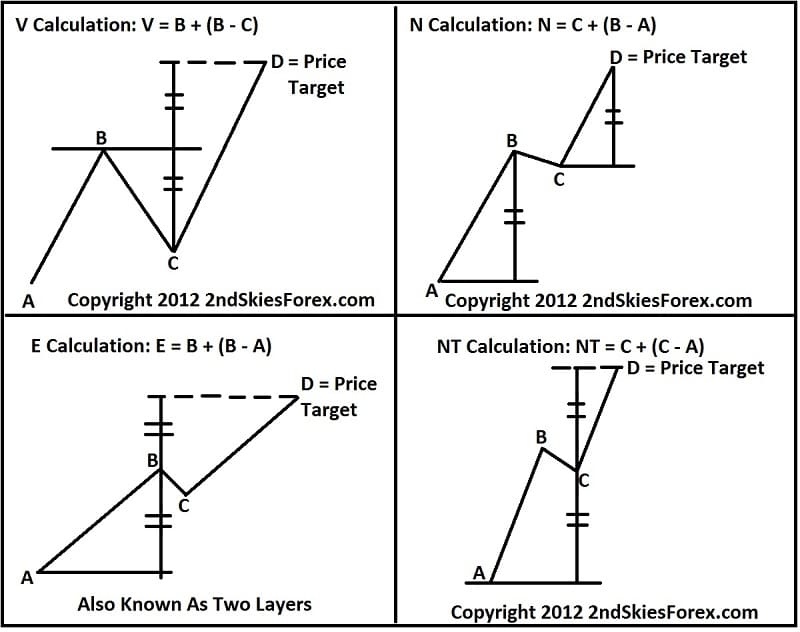
Although I listed the NT Calculation, for now just spend time understanding and practicing the first three price measurements.
The V Calculation
Looking at this general structure, we have a bullish move from A – B – C. You will notice the depth of the retracement of C in relationship to the A – B move, which is about a 61.8% retracement. If we were using Ichimoku Wave Theory, this would correlate to an N Wave.
The way to use this as a price measurement method is when price breaks the horizontal line at B for that is only when the V Calculation and pattern would be active. Of course we can make the calculation ahead of time, and that is the point of the price measurement methods (or ichimoku price theory in general). But the calculation actually does not become ‘active’ till the line at B is broken.
Once this does, we can expect an upside price target of D to be achieved (within a handful of pips) based on the V Calculation. An example is below.
V Calculation Using the NZDUSD 4hr Chart
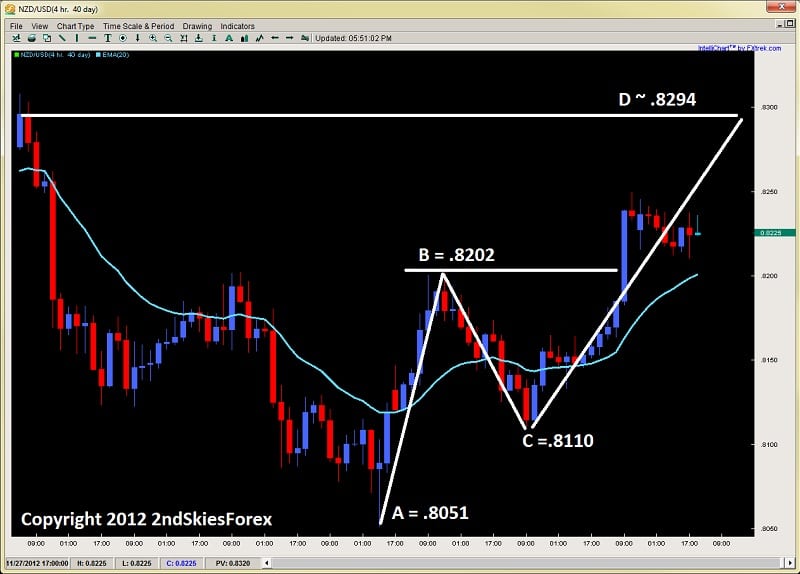
So using this chart and running through the math of the V Calculation, we take .8202 + (.8202 – .8110 = 92), or .8202 + 92 pips = .8294. As you can see, this matches up nicely with a current swing high and natural target for an upside continuation in the Kiwi (should it continue). This is a basic example of how you can use the V Calculation to gauge a potential target for the pair. An ichimoku trader using this calculation along with the swing high would only bolster their confidence in the upside target being hit.
Keep in mind this is a live chart and I have no idea how this will play out, but wanted to show it as an example.
Lets run through examples of the N and E calculations so you can see how they operate.
N Calculation = C + (B – A) Using the Dow Jones Index 4hr Chart
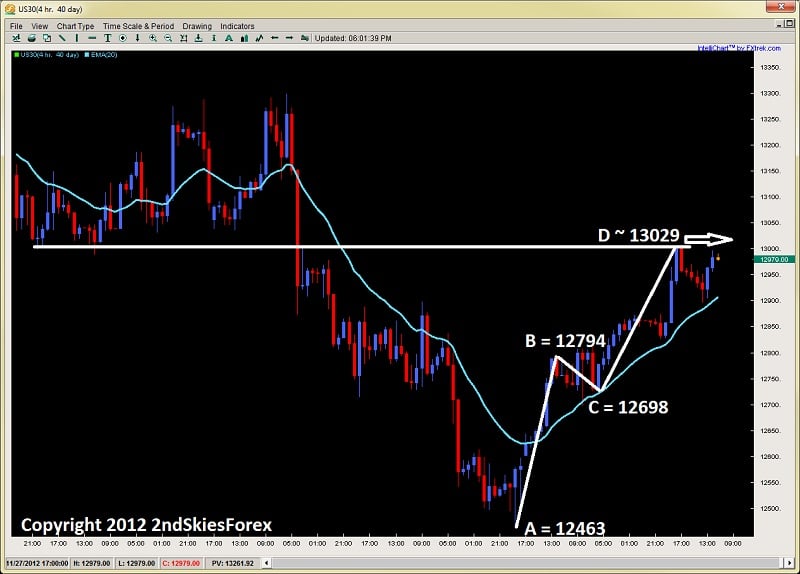
Now using this chart above and the numbers for the N Calculation, C (12698) + (12794 – 12463 = 331), or 12698 + 331 = 13029. So we would have a general target of 13029. Now if you remember, these numbers are not meant to be absolutes, only highly probably approximations of upside or downside targets. Considering the major role reversal level was at 13003, we can consider this to be a good target for D using the N calculation.
E Calculation = B + (B – A) Using GBPJPY 4hr Chart
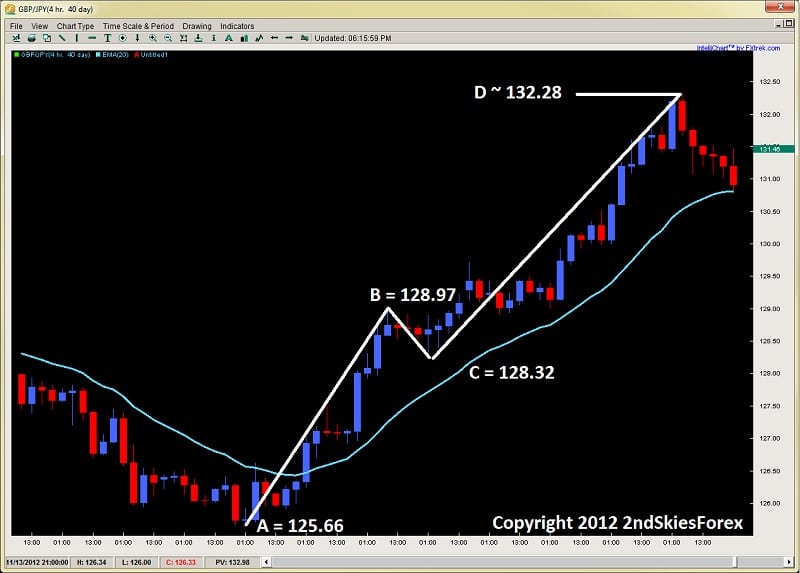
Using this chart above on the GBPJPY and the E Calculation, B (12897) + (12897 – 12566 = 331), so 12897 + 331 = 132.28. In this case, the market actually only got one pip higher than the D price measurement or target, showing a fine example of how the E calculation and price measurement theory can work.
Some Additional Notes
As I said before, ichimoku price theory should be combined with ichimoku time theory as they work in tandem. But the scope of this is for another article and far too large for an introduction to ichimoku price theory.
Another note in terms of deciding which price measurement to use is based on the price action of the actual moves you want to measure. You will notice all of the calculations have certain levels of impulsivity and correctiveness to the A, B and C moves. On a basic level, what you are doing is gauging the level of the retracement from B – C, along with the correctiveness of the pullback from B-C to determine which calculation you will use. Thus in essence, you need the A, B and C components to really apply any calculation at all. But how you read these moves and waves will determine which calculation you use.
A critical note as well, is when measuring bull or bear runs. The calculations you see in the first diagram are for bullish runs. For bearish runs, you will substitute the + for a – between the first variable and the set. Thus, using the V Calculation, instead of it being V = B + (B-C), it would be V = B – (B – C).
In Summary
This was an introduction into Ichimoku Price Theory which is by far the most complex and intricate of the three pillars of The Ichimoku trading system. The three basic calculations are critical and the foundation of the entire price theory, thus the most important formulas for you to learn. Eventually you will combine price theory with time theory, but for now, just practice the basics here. These price measurements are not to be considered absolute values, and Ichimoku was always meant to be used in combination with price action. In fact, many aspects of ichimoku and the formulas are interpretations and patterns often found within price action, so the two are really intertwined.
For a more in depth study and training on Ichimoku Price, Time, Wave Theory, and Ichimoku Trading, make sure to visit my Advanced Ichimoku Course where we explore these methods in great depth, along with giving rule based systems to trade ichimoku both intraday and a trending/momentum basis.
Tag Archive for: Ichimoku Clouds
This Ichimoku forex trading video is designed to provide an introduction to the Ichimoku Cloud, a popular Japanese trending indicator with high accuracy in all global markets. The video focuses on key elements that can enhance Kumo Break trades and show you how to spot them.
EURUSD
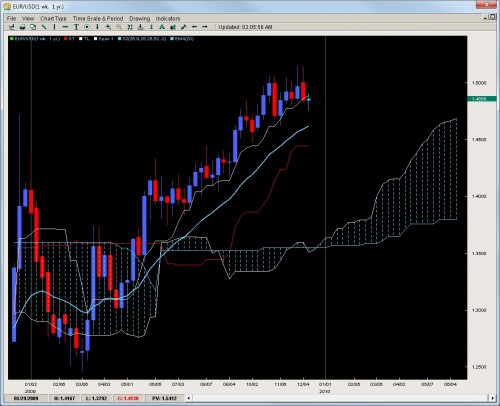
Finally breaking stride, the EURUSD has done something it has not been able to do for the last 7 months…have a weekly close below the Tenkan line. This line has held on dips and been quite a play in terms of getting into this trend. With the line being broken, there are two likely scenarios and a third unlikely one.
Scenario 1: The pair goes sideways into a consolidation or channel holding between 1.4615 (20EMA) and 1.5130 (basically the yearly high). This is the least exciting scenario but probably the most likely as heavy positions are probably not coming into the pair anytime soon. The pair simply struggled to make any new ground above 1.5000 and failed every time to have a weekly close above it. Does this mean the bulls are headed for the exit? No – but they are less confident in the short term and will likely not consider adding positions until the pair touches the 20ema.
Scenario 2: The pair starts a sell off as bulls take profits for the year and exit out of the pair. The failure to close on a weekly basis above 1.51 caused them to lose confidence short term and look for a lower/cheaper entry. If this plays out, the pair should move within 1-2 weeks towards the 20ema. However with liquidity drying up by the end of next week, unless the pair starts getting aggressive today or tomorrow, this scenario fades in likelihood as santa comes closer to visiting us through our chimneys.
Scenario 3: The least likely is the pair gets really bullish and makes new highs. We feel this is rather unlikely so if you are thinking of throwing on massive longs, caution is advised as we do not feel this is the time, environment or overall location to be putting on heavy longs. Best to wait till new year with fresh eyes and hopefully a lower price.
GBPUSD
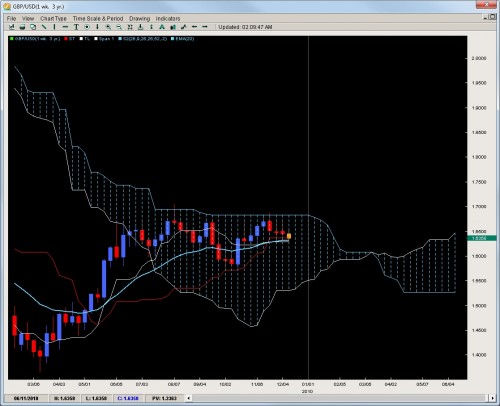
Failing once again to make a run for the Kumo Flat top and break it, the pair has now posted 3 straight weekly closes and is threatening an important base in price at the 6300 region along with the Kijun, Tenkan and 20ema. If we were to get a weekly close below this, we feel the pair would make a strong move towards 1.5700 which was the October low and launching pad for a 1300pip run. Keep in mind this was a perfect bounce off the Kijun which is not as stable now so any breakdowns this week likely lead to strong price moves once clear of 1.6200. It is becoming more likely GBPUSD will remain between 1.5700 and 1.6827 which is the flat Kumo top for the rest of the year so do not expect wild upside thrusts to end the year.
AUDUSD
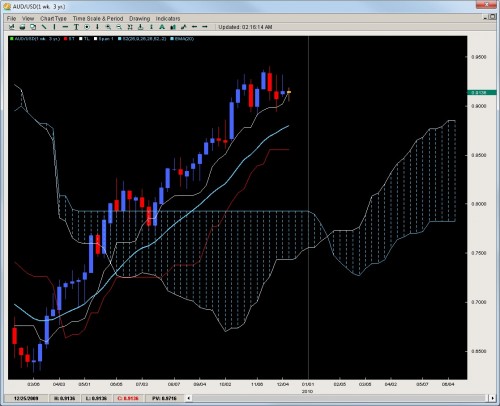
Virtually but a cigar short of closing below the weekly Tenkan, the pair is threatening a break below the white line which has held since July (only below for 1 week) and essentially since March. A weekly close below this will likely target the 20ema which is down at 8800 where the longer term bulls will be tested and tempted to add positions. Keep in mind a break of this line would likely start a drop towards 8500 and perhaps down to 8200 where there is a good price base and likely where the kumo would be in such a venture. Overall, we feel the pair is showing signs of being over-valued and may need to unwind a bit before another push up towards parity is attempted but its unlikely bulls have the gusto right now for an attack on the yearly highs or 9500 so we expect at best a sideways consolidation between 9000 and 9400 but would not be surprised if a strong sell-off occurs as there is not much to prop the pair up except for a small 3 week price base at 9000.
USDCAD
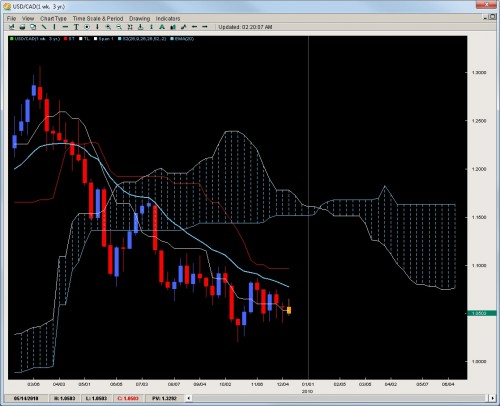
The drifter of the pairs, price action is getting less enticing every week as we are seeing multiple inside bars with little breakouts and a lot of wicks on the weekly charts communicating a lot of rejections and un-clarity about where price should be for this pair. Its forming a wedge and a rather small one so these are generally environments to be avoided. There is a small base which we mentioned last week in the 1.04’s and we mentioned if you wanted to get long, that was the place to do it. It definitely yielded some profit bouncing about 100+pips off that figure but each week such a move becomes more dangerous and less recommended. The only other base to go long is at 1.0200 (yearly low). Beyond this, we do not feel any other longs will enter until a break of the 20ema which has not happened since April.
NZDUSD
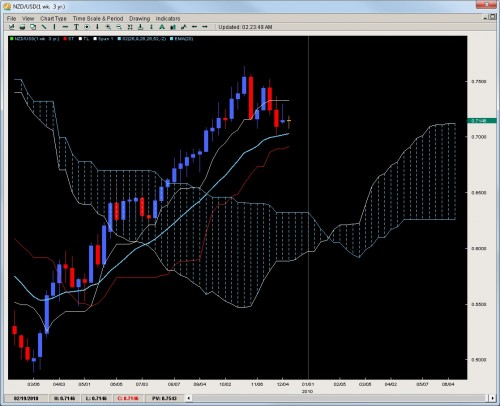
The underperformer of the trend pairs against the greenback, the pair has now formed a short term range of price action between the Tenkan and 20ema with two rejections at the Tenkan and one at the 20ema. The good thing about this price action is it gives us clear plays on both sides of the market and out of all the pairs, we feel this is one of the better ones to trade with the established rejections. The lines in the sand are more clear here than any of the others so plays (light ones) could be made on both sides. With all the lines starting to go flat, the chances of this range holding (at least to the upside) are solid. A downside break is the more likely scenario but the jury is still out on that one. Any aggressive selling today or tomorrow would bolster the downside argument. Ultimately, we feel any strong dips will likely lead to price basing around 6500 which we feel is a good value area to establish longs for another run up to 7500.
Chris Capre specializes in using Ichimoku, Momentum, Bollinger Band, Pivot and Price Action models to trade the markets. He is considered to be at the cutting edge of Ichimoku analysis along with building trading systems and Risk Reduction in trading applications. For more information about his services or his company, visit https://2ndskiestrading.com
