Tag Archive for: order flow

Want to Increase Your Profitability? Try this powerful approach

If you want to find high probability trades, and skip those with a low probability of working out, you’ll need to develop a core skill. Does this sound interesting? Then keep on reading. What is this skill you ask?

I am talking about trading with price action context.

Good Trading Decisions Are Based Upon Context

First, let’s define the word ‘context’. Context = understanding and approaching a situation based upon the ‘context’ (or environmental variables) around it.

In price action, the ‘context’ is a way of describing the overall environment, and using that to help you trade with the underlying order flow. We have 3 filters to understand the price action context in our Trading Masterclass Course. For the purposes of this article, we’ll talk about impulsive and corrective moves.

Impulsive and Corrective Moves

Now I’ve already done many videos and articles on impulsive and corrective moves. For a more in-depth study, you can watch this video on impulsive and corrective price action, or this article on impulsive and corrective moves. But to sum them up briefly:

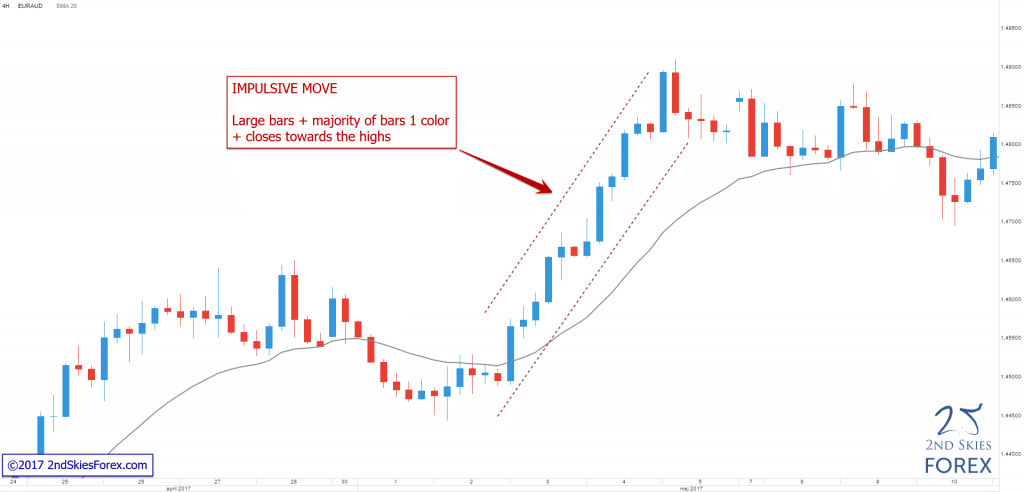
Impulsive moves = large bars + majority of bars 1 color + closes towards the highs/lows

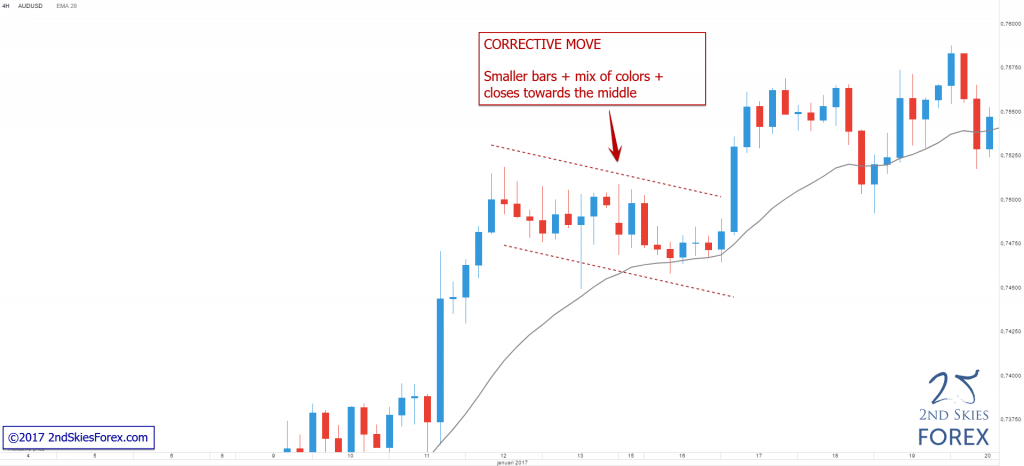
Corrective moves = smaller bars + mix of colors + closes towards the middle

An example of an impulsive move is below:

Impulsive move 2ndskiesforex

And an example of a corrective move is below:

Corrective move 2ndskiesforex

As a whole, impulsive and corrective moves communicate a lot about the price action context, such as the underlying order flow behind it.

During impulsive moves, the order flow is relatively ‘imbalanced’, meaning it’s dominant towards one side (buying/selling) which causes strong directional moves.

During corrective moves, the order flow is relatively ‘balanced’, meaning there is no strong winner between the buyers/sellers, hence the market goes mostly sideways.

Using Impulsive and Corrective Moves to Discover the Price Action Context

Now that we understand the basics of impulsive and corrective moves, we can use them to discover the price action context of the market.

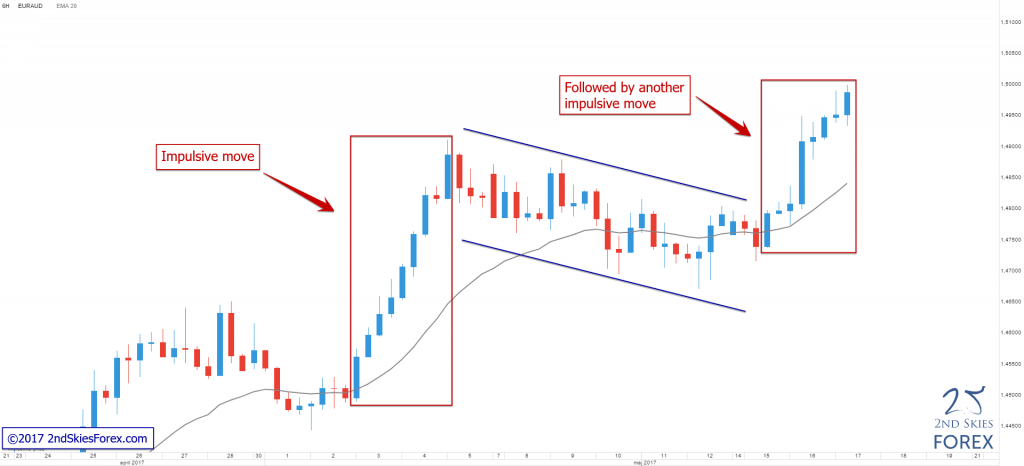
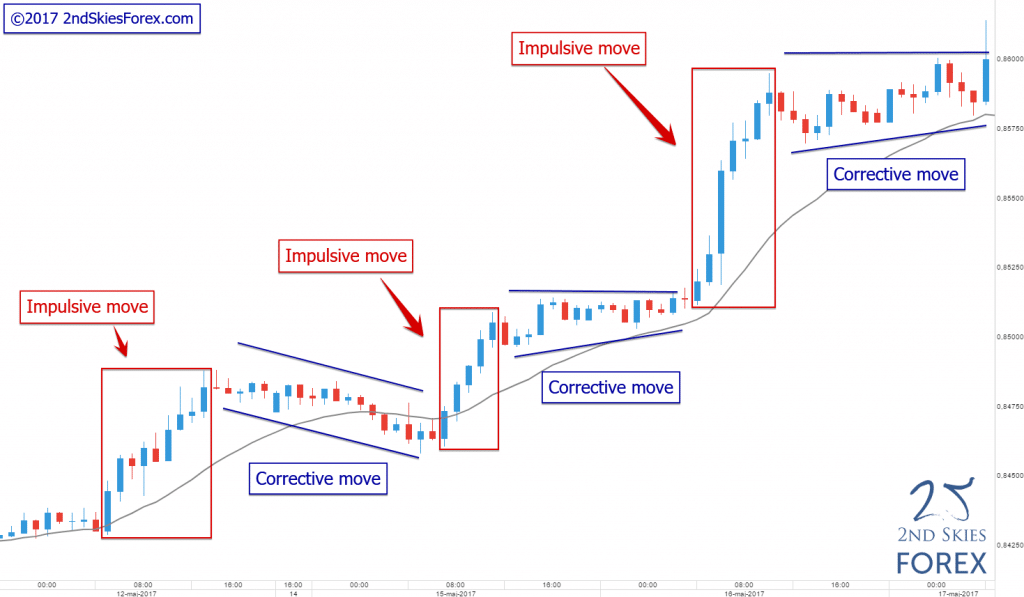
As a general rule, an impulsive move (the majority of the time) is followed by a corrective move. If the impulsive move is with trend, then the next move after the corrective move will more often be an impulsive move in the same direction.

Two good examples of this are below:

Example 1: Impulsive and Corrective Moves

Impulsive & Corrective moves 2ndskiesforex

Example 2: Impulsive and Corrective Moves

Impulsive & Corrective moves 2ndskiesforex

Now what do impulsive and corrective moves teach us about price action context?

They give us an underlying sense of what the dominant order flow is. If you see a potential trend in place, along with a good series of impulsive and corrective moves, then you can feel confident the overall price action context is bullish, and thus you should be looking to buy more often than sell.

Now instead of waiting for a pin bar, fakey or some other 1-2 bar confirmation price action signal, look at the impulsive and corrective moves for trade opportunities as they will often offer you many.

You don’t need a 1-2 bar candlestick pattern to know if the market is bullish – just determine the overall ‘context’, and trade with the impulsive and corrective structure as much as possible.

NOTE: If you want to learn how to find high probability trade setups using impulsive and corrective moves, check out our Trading Masterclass course.

The bottom line is – many of those 1-2 bar candlestick patterns (pin bars, fakey’s, inside bars, etc) don’t form that often. Yet if there is a strong trend in place, why are you waiting for a pattern that may never materialize, when the overall order flow is already bullish?

Get into that trend and make some money. Just make sure the price action context is in your favor. A great way to determine this is to make sure you can read the impulsive and corrective moves.

The most favorable situation is when you are trading in the direction of the impulsive moves (not against them) because you’re trading with the dominant order flow in the market. It also means you can make money faster because impulsive moves travel farther and faster than corrective moves.

Hopefully you can now see how price action context, particularly spotting the impulsive and corrective moves, can give help you find better trade setups.

Want To Learn More About Price Action Context?

While impulsive and corrective moves are a crucial part to determining price action context, they are not the whole. We have two other key factors to determining price action context and what the dominant order flow is in the market.

To learn more about these two, check out our Trading Masterclass Course where we teach you higher, lower and multiple time frame context with clear rules to understanding them. In fact, our entire 1st section of lessons is dedicated specifically towards understanding price action context.

To get access to these lessons within minutes, click here. Inside the course, you’ll also learn how to read other critical (or more advanced) price action structures and find more trade setups.

Keep in mind, trading with price action context is a skill that works on any instrument, time frame or environment. If you’re learning a price action strategy or approach that only works on specific time frames, then it’s a limited strategy that doesn’t really understand price action or PA context.

Until then – I look forward to your comments and feedback.

What’s Inside?

  • The 4 stages to becoming a millionaire trader
  • What is the most important stage to making money trading?
  • What trading and mindset skills you need to become a profitable trader?

Since February of 2018, I’ve been envisioning how I want to build a complete trader training program that will teach you the stages, skills and mindset you’ll need to build to become a highly profitable trader who can pull a million dollars out of the market. I actually started working on this article over 6 months ago, and it has finally come to fruition.

If there was only one trading article you could read on my site, this would be it, so grab the popcorn as it’s a heavy hitter.

The goal of this article is to teach you about the 4 stages to becoming a millionaire trader. It’s designed to be a roadmap and structure for how to get from where you are now (likely struggling) to becoming a professional trader who can make a million dollars trading the markets.

millionaire-trader 2ndskiesforex

Before I get into the stages and roadmap, I have to explain a fundamental component and basis for this article.

Buddhism And Trading?

For the last 18 years, I’ve been training in Tibetan Buddhism, particularly in the Nyingma tradition. One of the amazing components of training in Buddhism is the ‘structure‘ and ‘stages‘ they clearly lay out for you. And a fundamental aspect of Buddhist practice has to do with the following formula:

Base, Path & Fruit

To explain this simply, the ‘base‘ is the starting point and foundation you build everything else upon.
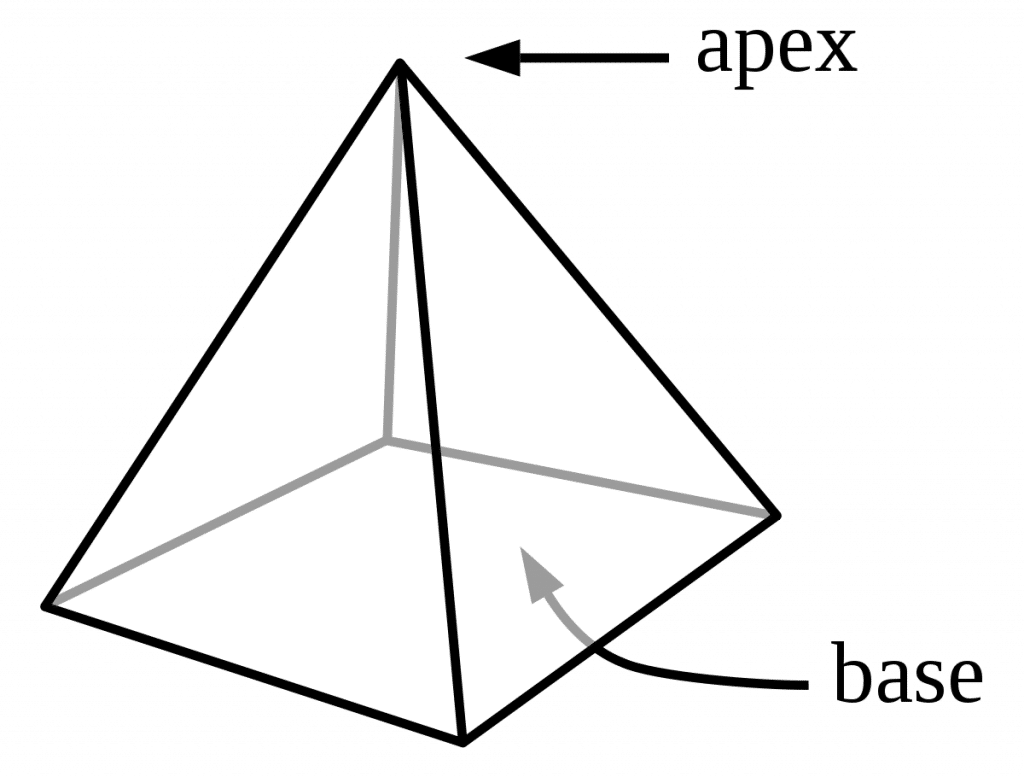
It’s a fundamental level of direct experience and understanding you need to have to complete a specific aspect of your training. It’s arriving at the base which is what makes any practice, training or method work. Without this, you’re just wasting your time.

Keep in mind, it is not something you can arrive at ‘conceptually‘. What I mean by this is, it’s not something you can just read in a book and understand. You have to have the actual direct experience before you can progress any further.

Think of it like this:

Who would you trust more? Someone who’s lived in Buenos Aires (Argentina) their whole life, and knows the city, streets, traffic patterns, restaurants, various barrios, how ‘corruption’ affects their daily business, local customs, etc? Or someone who’s spent the last several years ‘reading‘ about Buenos Aires, looking things up on google, and watched youtube videos about it?

I’m guessing every time you’ll take the former hands down, which you’ll notice has nothing to do with ‘intelligence’. The person who’s lived in the city has a ‘direct experiential‘ knowledge about Buenos Aires that cannot be read in a book, watched in a video, or learned ‘conceptually’. It has to be a direct experience!

The same goes for the ‘base’ in trading. If it’s not a direct experience, you simply cannot progress any further. This is what I mean by ‘base’.

The ‘Path‘ is the practice, methods and training you use to get you to the direct experience. It needs to be a specific path which takes you from point A to B.

The path needs to be very specific and clearly demonstrated to produce real results.

The ‘Fruit‘ is what you get when you fully complete the ‘path‘ by using those practices, methods and trainings. It’s the ‘result‘ of what you get when you do the work, and it also should be specific.

If you have the base in place, then you can begin the journey. If not, you’ll need to arrive at the base (just like you have to arrive at ‘base camp’ to climb Mount Everest), before you can proceed any further. There is absolutely no way to skip steps here.

This entire training and article is built upon these principles of Base, Path and Fruit. Simply put, if you follow the structure I’m laying out here for you, your progression will naturally follow and you’ll see the results in your trading performance, mental execution and mindset.

Each of the 4 stages to becoming a professional trader has it’s own ‘Base, Path and Fruit’. Before you can progress to the 2nd stage, you’ll have to complete the first. There is no way around this! So if your goal is to make a million dollars trading, you’ll want to go straight for the first stage.

Becoming A Millionaire Trader (Stage 1)

The very first stage to becoming a millionaire trader is what I call the ‘Stage of Discipline‘.

The ‘base’ of this stage is having the direct experience and realization that:

a) your brain is currently not wired to trade successfully
b) you’ve had the experience of how your mind, emotions, and skill-set are currently not sufficient to consistently make money
c) have a real passion for trading, and
d) a mindset focused on growth

If you have those 4 things in place, you have the sufficient ‘base’ to begin the first stage.

By now, you’ve probably witnessed how your emotions affect your trading decisions (FOMO, not pulling the trigger, fear of losing money, risking too much/too little, etc). You’ve probably also noticed how you’re not consistently disciplined in your approach (system hopping, changing instruments, not sticking to your trading plan, etc).

Sound familiar?

If you’ve realized what you’re doing isn’t working, and that you’re lacking certain skills + training, but still have a passion to make money trading + are focused on growth, then congratulations – you’ve arrived at the base of the first stage. You’ve accepted the fact you (by yourself) cannot make this work, that you need a trading mentor + build new habits to succeed.

If you’re here, then you’re ready to actually begin the first stage, which is the stage of discipline.

The only thing you need to pack in your bags from here on out is a commitment to getting past this first stage. You don’t need to have the commitment to become a billionaire trader. Just having the commitment and openness to train is the minimal requirements to begin the first stage. Consider this stage to be your ‘apprenticeship‘ in becoming a successful trader.

The ‘fruit’ of the 1st stage of discipline is ‘consistency‘. If you don’t have consistency, you’ll never a) succeed in trading, and b) make it to the 2nd stage.

I say ‘consistency‘ is the ‘fruit’ of this stage, because it’s what you get when you have a solid level of discipline in place. Without this, there is no progression in trading, and you’ll continue to make the same mistakes over and over and over again.
Does this sound like your current experience?

Thus, discipline is what helps you exit out of that cycle (repeating the same mistakes). It’s the force which allows you to break through your current bad habits around trading. It’s what allows you to execute the same things over and over again, regardless of the emotions you feel, or obstacles you come against.

Consider discipline a type of ‘armor‘ against that which will knock you off your horse and derail your progress. Essentially, it protects you against yourself, and is absolutely necessary in trading..

From my experience, both in Buddhism, and in trading, it actually has to get worse before you give up your current approach (which likely isn’t working). You actually have to suffer to the point you realize “I no longer want to suffer like this. I’m open to trying it differently.” This realization creates the first real opening for you to get out of that vicious cycle of repeating the same mistakes over and over again.

The ‘path‘ of the stage of discipline is the most intricate and nuanced part of your trading progression. It’s the hardest part of the mountain to climb, and requires the most effort on your part. This is because you’re going to be fighting against much of what you currently are, which by definition, is insufficient to consistently make money trading. If you were already there, you’d be doing it.

The ‘path’ has to consist of a series of methods and skills (trading and mindset wise) you’ll need to build to get to the ‘fruit’.

Practices & Methods For the Stage of Discipline

As stated before, the goal or fruit of the stage of discipline is consistency. This means consistency in your execution, decision making process, trading strategies you are using, what instruments you trade, risk management, etc.

Consistency, however, has a ‘root cause‘, meaning the root of what it grows out of. As I’ve stated before, consistency can only come from the mind. If you do not have consistent thoughts, thinking patterns, neurological structures, mindset, (etc) there will be no consistency in your trading. Hence your focus for building ‘consistency’ has to primarily consist of (and begin with) your mind.

If you are currently not experiencing any sort of consistency in your trading, then congratulations, you’ve discovered the root cause of your inconsistency (your mind). Now your initial goal in trading and becoming consistent may seem counter-intuitive, but I’m guessing you’ll find it makes sense when you fully understand it.

Your initial goal in trading should be to become a ‘consistentlylosing trader. Now many of you are likely thinking “I consistently lose now, why would I want this?” While that may be true in ‘form’, it’s not true in ‘essence’. What I mean by this is, while you may be consistently losing money, there are likely many components of your performance which are not ‘consistent’.

Some of these components can be:

  1. Risk Management – are you consistently risking the same % per trade? If not, then you’re not ‘losing consistently’.
  2. Trading Instruments – are you consistently trading the same instruments till you have a sufficient baseline to make a quantifiable decision? If not, then you’re not ‘losing consistently’
  3. Times of the day – are you consistently trading the same times of the day? If not, then you’re not ‘losing consistently’
  4. Pre-trade preparation – are you consistently preparing mentally for your trading day with the same routine? If not, you’re not ‘losing consistently’
  5. Pre-trade analysis – do you have the same consistent routines and methods (price action, ichimoku cloud trading, etc) for finding trading setups? If not, then you’re not ‘losing consistently’
  6. Post-trade analysis – do you have the same consistent routines and methods for analyzing your completed trades? If not, you’re not ‘losing consistently’
  7. Reinforcing successful trading habits – do you have the same consistent routines and methods for reinforcing successful trading habits? If not, then you’re not ‘losing consistently’
  8. Trading plan – do you have a detailed trading plan which has clear instructions for how to trade, how to train, and how to progress in your trading? If not, then you’re not ‘losing consistently’

I could go on as there are many other variables you’ll need to ‘lose consistently’, but my guess is, when you read the above and really take it all in, you’ll realize that you’ve been ‘losing money’ consistently, but not ‘losing consistently’. There a difference.

It takes discipline and a courage to say “I’m going to focus on consistently losing”, just like it takes discipline and commitment to not hit the target consistently in archery. But that is your initial goal in archery (not just hitting the target), but ‘consistency’ in your technique, process and movements. If there is no consistency in your stance, alignment, breathing, holding of the riser (main bow structure), how you grip the bow string, how far you pull it back, etc…there will be no consistency in where your arrows land.

(Image: Brady Ellison – #1 US Archer – Recurve Bow)

Trading is no different!

Hence in sounding somewhat masochistic, your initial goal in the first stage of discipline is to learn to ‘lose consistently’. By doing this, you’re building the foundation which the entire house you want to build will rest upon. Then you can focus on being a consistently break-even trader. Then you can focus on being a consistently profitable trader.

But before all this, you’ll need to focus on building the prerequisite trading skills, which can be defined as the following:

1) Trading Methodology & Approach

There are only 4 major trading methodologies, or approaches to the markets. They can be any of the following; 1) technical, 2) fundamental, 3) sentiment, 4) flow based.
Now any one of these can fall into broad categories, such as (discretionary, rule-based, hybrid, quantitative).

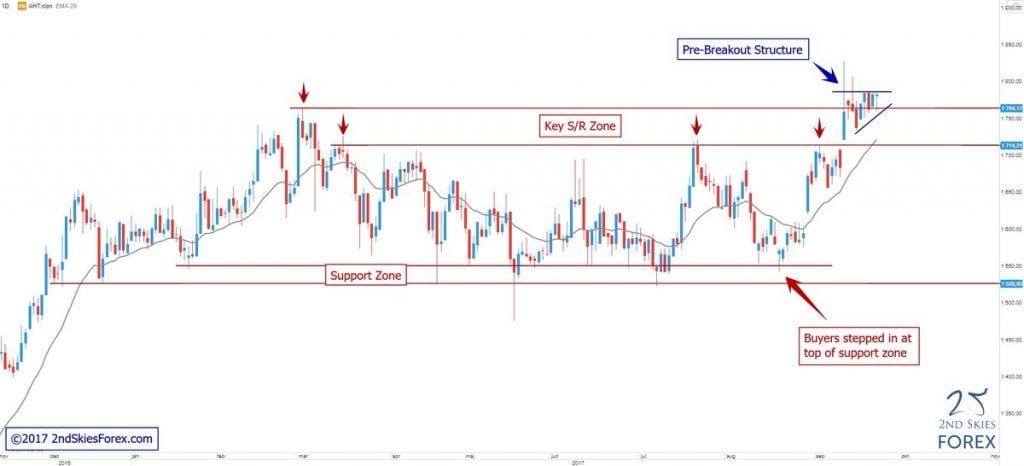
The approach I teach is a ‘technical‘ model based upon understanding price action context and the order flow behind it. I teach this method because it can be applied to any instrument, time frame or environment, and is based upon what all trading decisions are based upon (*information).

Regardless of whether you are a technical, fundamental, sentiment or flow based trader, all trading decisions are derived from ‘information’. Eventually that information has to be converted into an actual trade (and thus order). All ‘activated’ orders become ‘actualized’ order flow. And order flow is the most proximate driver of price action.

This is why I teach price action context and the order flow behind it, because I’m teaching you a ‘root’ method which communicates the footprint of all orders and trading decisions. By understanding these, you can give yourself the highest probability for trading with the dominant order flow in the market, which is what drives all price action. By doing this, you can learn to trade with the larger players who will most likely dominate directional price movements (which is what we want to capitalize on).
price-action-2ndskiesforex

Price Action Trading Skills

There are many price action trading skills you’ll need to build, and it is important not to learn these skills out of order. I often find traders trying to learn more advanced skills before they’ve built a solid set of foundational skills. One common example is struggling traders trying to trade counter trend before they’ve learned to trade with trend (with the latter being easier).

Now assuming you understand what candlestick charts are, time frames, and what the basics of price action are, then you’ll need to build your core skills of price action. In price action trading, the first set of ‘core’ skills you’ll need to learn is what I call the 3 pillars of price action context.

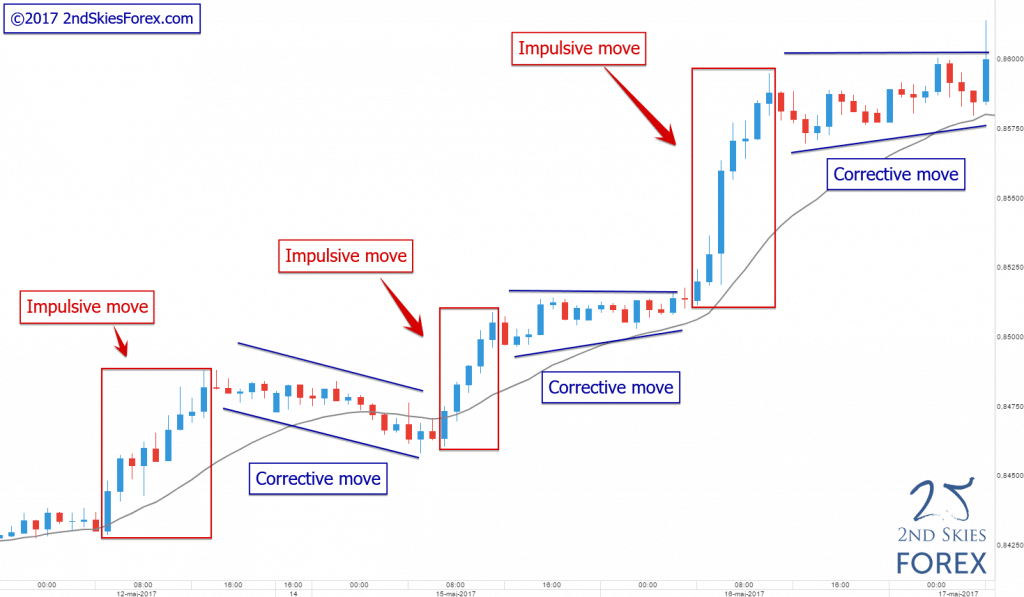
I’ve talked about the first pillar of price action context, which is being able to identify impulsive and corrective moves. The reason why this is the base pillar is it gives you the most amount (and most nuanced) information about the price action and order flow happening right now.

It tells you who’s in control of the market (buyers/sellers), and who’s not. It tells you how to read momentum in the price action without any indicators. It tells you when are optimal times to take profit, and not take profit. It tells you when you’ll need to be patient, and when you need to make a quick decision. It tells you when trading breakouts are more likely (or more probable) to occur, and when they are less likely to succeed.
impulsive-and-corrective-price-action 2ndskiesforex

There is a lot more impulsive and corrective moves can tell you about price action, but by learning these, you start to learn how to think like a price action trader, and see the dominant order flow behind it. This is why it’s the first pillar. If you want to learn about the other two pillars of price action context and the order flow behind it, then check out my price action course where we talk about this extensively.

Now before you can even practice these skills and making actual trading decisions, you’ll need to first be able to identify (with 90+% accuracy) these 3 pillars of price action context. My formula for how to build your trading skills (and price action skills) is simple:

Sim, then Demo, then Live

What this means is, after you’ve watched videos and understood (conceptually) the components of an impulsive and corrective move, you’ll want to start building your pattern recognition skills in the charts. You build these pattern recognition skills so you can identify them automatically, and thus, sub-consciously.

If you’ve ever looked at a chart and had the thoughts, “Is this a such and such pattern? I’m not sure, how do I know? I know it said it has to have x, y and z, but is this part the same, or is it different…

Have you had this experience before? If so, then your skills are not ‘sub-conscious‘. The reason why this is important is you want to use your cognitive thinking, analysis and bandwidth for finding profitable trade setups. If you have all those thoughts going through your mind, then congratulations – you’ve now realized your skills are not sub-conscious, so that should be your next goal.

By starting with a trading simulator, you can have the opportunity to watch the price action unfold, pause it, take time to read it correctly, then resume the historical price action on the chart unfold.
trading simulator 2ndskiesforex

This is why sim is the best place to start, because on demo, the charts just keep moving on whether you got the analysis correct or not. Just like pilots start off in a flight simulator to make sure they have the basic functional skills to fly a plane, you also need to start off on a simulator.

By looking over thousands of candles and charts in a short period of time via a trading simulator, you can increase your learning curve, and accelerate your pattern recognition skills, particularly being able to identify impulsive and corrective price action.

Once you’ve seen enough impulsive and corrective moves, your brain will eventually assimilate these patterns into its database, and be able to identify them on any instrument, time frame or environment with ease (and without doubt).

After you’ve mastered all 3 pillars individually, the next step is to assimilate them together into one cohesive picture (or gestalt). The goal here is to be able to easily identify all three of the pillars of price action context, then be able to come up with a ‘most probable’ direction of the market.

I say ‘most probable’ because this is a mindset you’ll need to develop to make it out of the first stage of trading. Beginners try to use ‘confirmation price action signals‘ because they think they ‘confirm’ the trade and direction. But 1, 2 or 3 candles is a small amount of price action + order flow, and rarely ever dictates the next move (~1% of the time).

Hence you have to shift your mindset from ‘confirming‘ (because there is no certainty in the market) to ‘probabilities‘, because probabilities is all you are ever dealing with. There is no certainty, and never will be when it comes to price action and the next direction. This is why I say confirmation price action signals will crush your account. If these so called ‘confirmation price action signals’ actually ‘confirmed’ anything, there would be ample statistics and data to back that up. Yet nobody to date has been able to provide this (which should tell you everything you need to know about them).

Now while you’re building your core price action trading skills, you’ll also need to build your mindset skills. To succeed in trading, you’ll need a successful mindset which will keep you on track when things are challenging, and help you execute what you need to when your trades and emotions are really affecting your thoughts and trading decisions.

Mindset Skills to Build Consistency In Your Mind

If you’re working towards consistency in your mind, there are several core mind/mindset skills you’ll need to build. For the purposes of brevity and not turning this into a long novel, we’ll talk about the 3 most important mindset skills you’ll need to build consistency in your mind and make money trading.

The first mindset skill you’ll want to build is understanding how the brain works. By understanding how your brain and mind work, you can accelerate your learning process by working with how your brain functions, not against it.

One of the most fundamental aspects of the brain is its ability to re-wire itself. This principle is called neuroplasticity. 

Neuroplasticity can be summed up by the following phrase:

“Neurons that fire together, wire together”

Neurons are the basic neural cells you have in your brain. They connect to each other through axons and dendrites. By connecting to each other, they can pass information via electrical signals.

If you want to wire in a new trading habit, you’ll have to activate neural circuits which do this over and over again. By doing this over and over again, they strengthen those connections till they become ‘dominantly wired‘. Another term for ‘dominantly wired’ is ‘habit‘. Anything you have dominantly wired in your brain is a habit. So by firing the same neurons together, they wire together and form specific habits you’ll want and need to build a successful mindset.

This is where understanding how the brain works helps.

There are 7 components to neuroplasticity, but there is one fundamental ‘root‘ component behind all neurological wiring: Repetition.

By repeating the same thing (and thinking pattern) over and over again, you can wire in the trading habits you’re looking for.

It’s why basketball players will shoot free throws every day in practice. It’s why quarterbacks (American football) will practice throwing the football over and over again, so that their mechanics are automatic and sub-conscious. It’s why Bruce Lee said “I fear the man who practices one kick 10,000 times“, because such a person has that has practiced a kick 10,000x likely can throw it with speed, precision and power.

Repetition is the most fundamental building block to wiring new trading habits. Thus, understanding how the brain works is a fundamental mindset skill you’ll need to develop.

The second mindset skill you’ll need to build is what I call the GBT mindset. GBT = getting better today (also known as a ‘growth’ mindset).
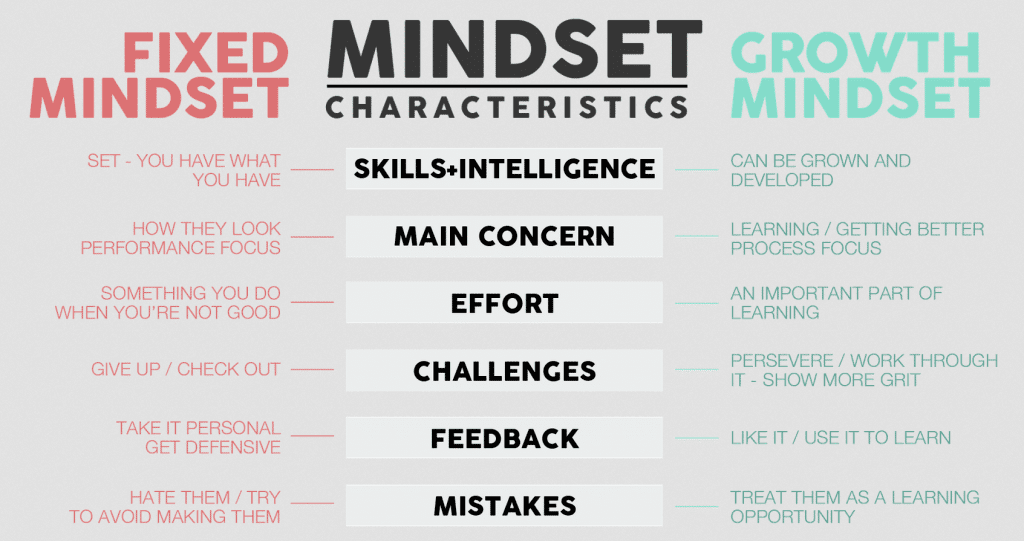
growth-mindset 2ndskiesforex

Notice the focus here isn’t ‘profitable trading now‘. It’s a trading mindset that works every single day to get better. By getting better today at your skills, you eventually build enough skills and competence to make money trading.

The GBT mindset is one that is focused on the process, and has a well designed process + skills + goals they are focused on. The process aspect is the methods and plan of action you engage to build your skills, which allow you to reach your goals.

If you’re just focusing on the results “dang, I’m still not profitable yet“, then you’re jumping too far ahead and not focused on what you need to succeed (skills: 1) technical, 2) risk management and 3) mindset). Hence your ‘goal’ right now if you’re not a profitable trader should be to build the skills to make money trading.

This is why you need the GBT mindset, and an approach which focuses on building your skills step by step, and getting better today at your current level of skills. Then once these are sub-conscious, you take on the next challenge.

The third mindset skill you’ll need to build to become a consistently profitable trader is ‘self-awareness‘.
Now I’m not saying you have to become a zen monk to become a good trader. But you’ll need to develop a minimum level of self-awareness to make money trading.

Why?

Because if you really understand how the brain works, you’ll realize you are actually fighting your own brain and evolution to build a successful trading mindset.

How so?

Let me demonstrate this with a few key brain facts:

  1. You have about 500% more neurons for finding the negative vs the positive
  2. You are more likely to choose an immediate reward (even if it is a lesser reward) than delay gratification (for a larger reward)
  3. Your emotions heavily influence how you interpret (and code) an experience, memory or event

Now lets examine these 3 brain facts.

The first one should be obvious as to how it can affect your trading. If you are 5x more likely to notice the negative vs the positive, what do you think that means when you make a mistake, or a trade starts to go against you? How do you think that will affect your thinking in real time when you have to make clear, calm trading decisions? Do you think it will help, or hurt your decision making process?

Ever experienced a trade that was a winner but starts to go against you? Were you totally relaxed, or feeling ‘stress’ when it started to pull back? And do you think that stress affected your analysis and decision making? This tendency to notice the negative vs the positive is called the negativity bias.
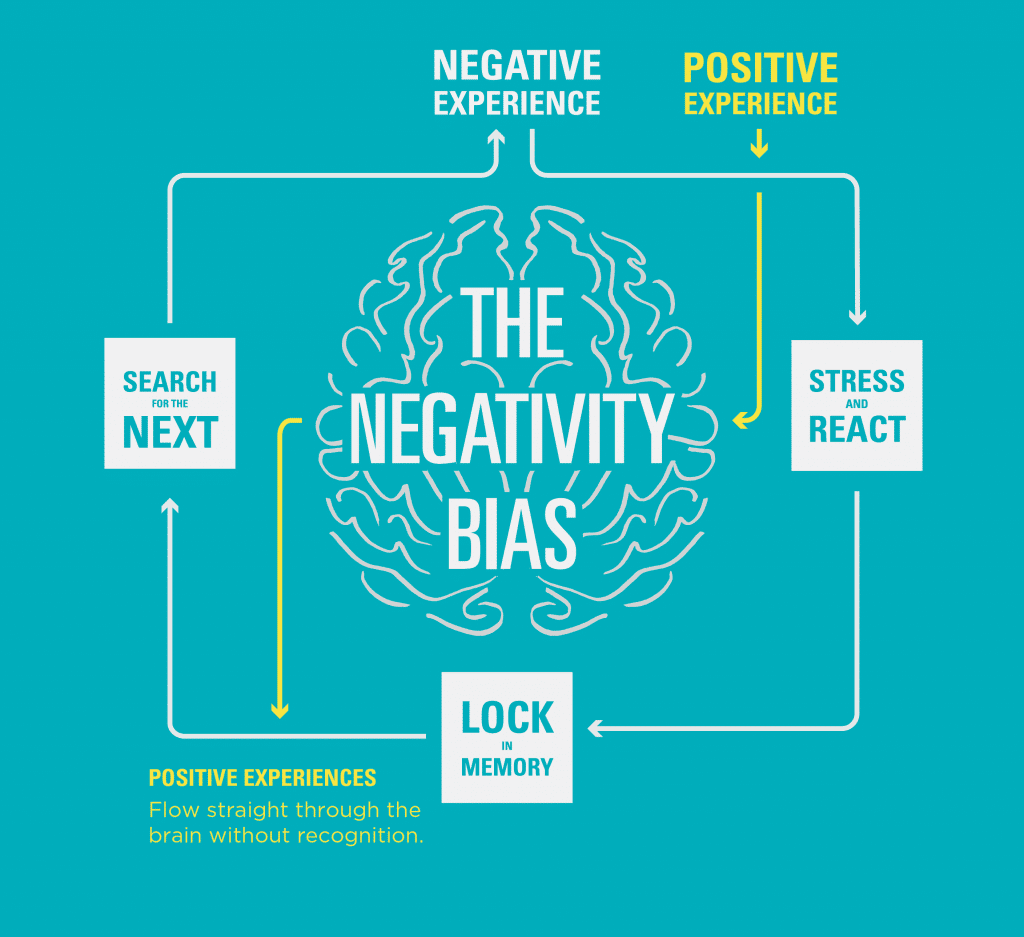
What about the 2nd brain fact? Ever chose to exit a winning trade too early? This is your brain working against you. If you’re more likely to choose a lesser immediate reward, don’t you think that will become problematic in making decisions which will lead toward long term success and trading habits?

In terms of the 3rd brain fact regarding emotions, just think about the majority of emotions you’ve experienced in trading. Have they been mostly positive or negative? Have they mostly helped or hurt your trading process, thinking and mindset? Do you even know how to use emotions to your advantage in trading? My guess is no.

Hopefully it is becoming clear why self-awareness is key. You can determine if the self-talk that’s going through your mind is accurate (“something doesn’t feel right about this trade“), misleading (FOMO, fear of pulling the trigger, etc), or not important (“I wonder how many people liked my last tweet”).

By building self-awareness, particularly around trading, you can learn to know when you need to stick to your discipline and/or trust your gut instincts. You can also learn how to self-regulate your mind, emotions and psychophysiology so you can make the most optimal trading decisions.
Simply put, if your biology and psychophysiology is off (heart rate, breathing, skin conductance, etc), the chances of you making a bad trading decision go up exponentially! And more often than not, the difference between making money trading and losing money trading comes down to the trading mistakes you make.

Becoming A Clutch Performer

The term ‘clutch athlete‘ is actually misleading. When the game is on the line, the statistics are clear. The best performers are not performing at their peak, or above their baseline. They’re actually performing below their baseline. The difference is, they make the least amount of mistakes compared to their baseline, while the non-clutch performers make more. This is why specific athletes are clutch, because when the game is on the line, they make the least amount of mistakes, and thus outperform everyone else.
Trading is a peak performance endeavor that is skill based. There is no way around it!

This means you’ll have to learn how to become self-aware when trading gets intense. If you want to make a million dollars trading, you’ll need the 3 mindset skills I’ve listed above when you have 5 or 6 figures on the line.

By becoming more self-aware, you’ll start to build the psychological and mindset skills to become a consistent trader who makes ‘consistent’ trading decisions, regardless of the pressure or challenges you’re experiencing while trading. You’ll be able to direct your cognitive and mental activity in the right direction, while avoiding getting swept up by your emotions, or negative self-talk.

There are many ‘methods’ and practices you can use to build self-awareness. I teach several of these in my traders mindset course. But one method we focus on in our traders mindset course is meditation, which is scientifically proven to help improve your neurological and cognitive performance in a variety of trading activities.

meditation for trading 2ndskiesforex

I’ve been practicing meditation since 2000, done over 10,000 hours of meditation practice. I’ve completed a 1 year meditation retreat. I’ve completed 3 one month retreats, about 150+ weekend meditation retreats, and trained with the same meditation teacher since 2001. Needless to say, it seems fair to say I have a ‘solid’ training in meditation.

I recognized early on how important meditation is to my trading mindset, and thus created a 12 lesson meditation series specifically for traders. The goal of this practice is to build self-awareness, increase your emotional IQ, and help you enhance your brain’s functioning, which meditation has been scientifically proven to do. If you want to learn more about how to use meditation to become a better trader, then check out my traders mindset course.

Now there are many techniques you can use to build a successful trading mindset, but these are three most ‘fundamental‘ I’d highly recommend you focus on. There are other mindset skills you’ll need to complete the first stage of trading (discipline) and get to the fruit (consistency), which could take me an entire book to write and flesh out. But I feel I’ve given you a glimpse of the first stage of trading.

Getting Past the Hardest Stage (*And Not Jumping Ahead)

From my experience in working with thousands of traders, helping many traders become profitable, I’ve seen how every trader which has failed to become a profitable trader has never completed the first stage. They’ve either a) never built the mindset skills to become a ‘consistent’ trader, b) never built the core foundational skills, or c) tried to skip various aspects of both.

From all the students I’ve trained that have become profitable traders, they’ve all completed the first stage without fail. I’ve yet to meet a profitable trader who is able to make money consistently while skipping the first stage. There is no way around it!

Now if you want to learn about the other 3 stages to becoming a million dollar trader, I’m doing a private member webinar this weekend (Dec. 22nd) for all my course members. After the webinar, I’ll be making this webinar available to all my members so they can follow this road map and become consistent traders.

If you want to learn how to become a member, click here.

Now I hope you’ve gotten a tremendous amount of value out of this article, and use it as a guide and road map to your successful and profitable trading.

Please make sure to leave a comment, and share this with any friends or forums you feel will benefit from learning about the stages to becoming a million dollar trader.

Until then, may you see real growth in your trading and mindset.

If you want to learn how to read candlestick charts, find high probability candlestick patterns, and learn to read the price action + order flow, then make sure to watch this video.

In this video on candlestick chart trading, I cover some of the most important patterns you can learn to read in the charts and price action.

I further explain in detail two of my core candlestick chart patterns for trading forex, stocks, commodities, global indices and CFD’s.

⏰TIMESTAMPS⏰

0:27 – all trading decisions will come down to this

1:00 – the most proximate driver of price action is order flow

1:57 – why I don’t trade candlestick patterns and instead trade this

2:36 – my most important model for trading candlesticks and price action

3:40 – what is an impulsive move?

8:36 – what is a corrective move?

13:16 – live trade in the AUDJPY

17:48 – live trade Swiss Index (SIX)

Read more

What’s Inside Today’s Trading Article?

  • Let’s talk about breakout strategies
  • What are some consistent breakout patterns?
  • When trading breakout patterns, how can I avoid false breaks?

Ever heard the statements “most breakouts fail” or “you should avoid trading breakouts“?

Let me just put the kibosh on that by sharing with you Exhibit A.

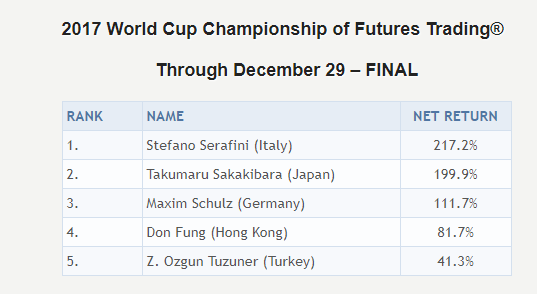
Behold…Exhibit A – winner of the 2017 World Cup Futures Championship, Stefano Serafini, who won with an impressive +217% return (see below).

stefano serafini breakout trader 2ndskiesforex

What was Stefano Serafini’s main trading strategy to generate such an impressive return? Trading intra-day breakouts!

So do me a favor, the next time you see some fake trading guru telling you “most breakouts fail” or “you should avoid trading breakouts“, please share the link to this post.

For today’s article, I’m going to share with you two breakout strategies to help increase your accuracy & profitability in trading breakouts. I’m also going to share how you can use this to avoid any false breaks and getting stopped out.

Let’s jump in.

Breakout Strategies

While there are many types of breakout strategies you can classify breakout trades into two broad categories:

  1. The momentum breakout setup
  2. The breakout pullback setup

For today’s breakout trade article, we’re going to focus on the second breakout strategy (breakout pullback setup) as it’s much easier for traders to learn and execute because it requires less skill.

NOTE: If you want to learn how to trade momentum breakout setups, then check out my Trading Masterclass course where I teach you how to trade this for maximum profit.

The Breakout Pullback Setup

Before you can even make a breakout pullback setup, you’ll need to identify some of the consistent breakout patterns that manifest in the price action.

By learning these, you’ll be able to identify A+ setups which will increase your accuracy and profitability in trading them.

There are many things you can do to identify an A+ breakout pullback setup, but there are 2 things I’ll give you to work with for now.

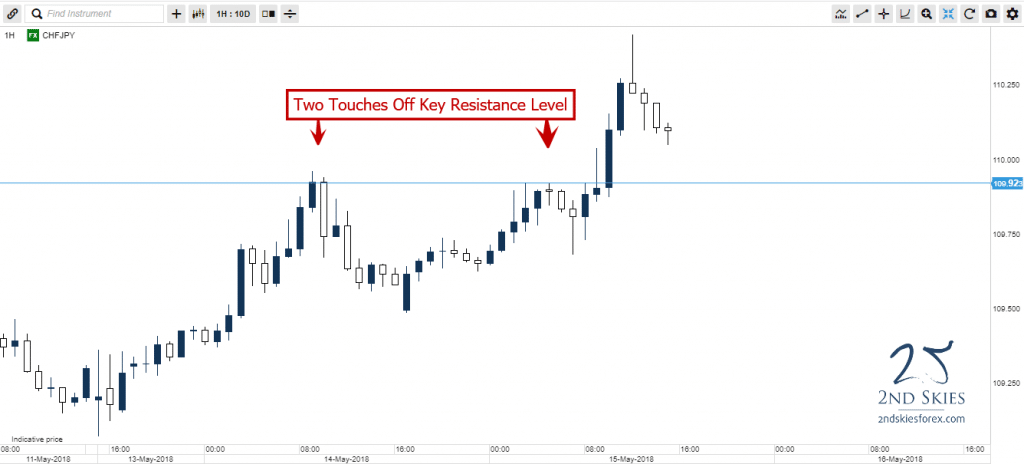
Breakout Pattern #1 – Finding a key support or resistance level with a minimum of two touches

Why two touches?

While the market may hit a key support or resistance level once, which indicates at least some potential order flow and institutional players wanting to hold that level, two touches indicates a greater probability and amount of order flow behind that level.

trading forex breakouts 2 touches 2ndskiesforex

The more buyers/sellers you have at that level, the greater the chance the breakout trade will succeed.

Why?

One reason is those same players who, when they get stopped out after their support or resistance level is broken, them getting stopped out clears out some of the order flow against that breakout, thus making it easier for the breakout to continue.

On top of this, smart money players after they’ve been taken out (and spot a good breakout) will often flip sides after they get stopped out, thus providing further momentum to your breakout trade.

Hence it’s important to identify a level that has a minimum of two touches (the more, then better) to increase your probability of a breakout setup forming.

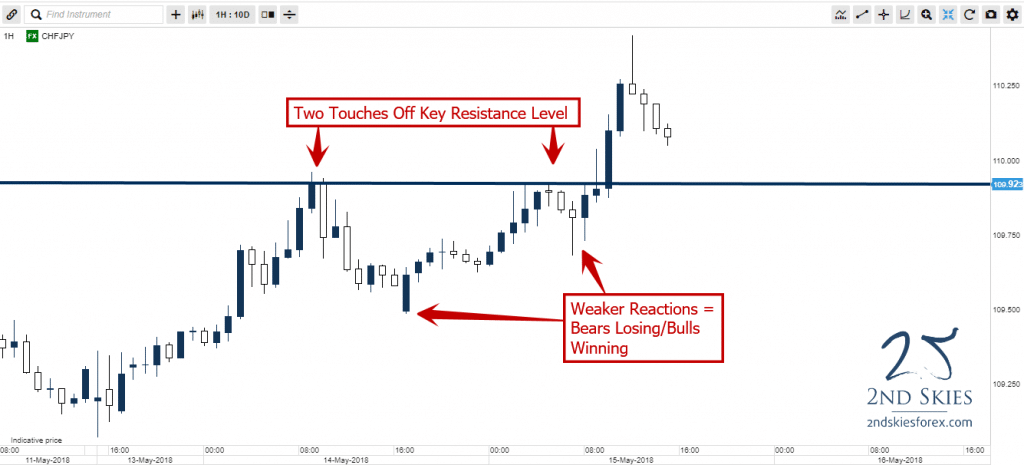
Breakout Pattern #2 – A reduction in the reactions (or pullbacks from that support/resistance level)

Why does a reduction in the pullback from a key support or resistance level help your breakout trades?

Let’s say the market is in a bull trend and it’s encountering a resistance level where there are likely bears with offers up at that level. If the bulls hit the resistance level the first time, and the market pulls back say 50 pips, then when the 2nd time the price action hits that resistance level, the market only pulls back say 25 pips, this indicates a weaker reaction by the bears at the level.

A weaker pullback from the bears = less order flow and strength on their side. As their side continues to weaken, this a) gives the bulls more confidence a breakout is becoming more likely, and b) communicates their side is losing the battle.

Looking at our prior chart, notice how the reactions/pullbacks to the resistance level were weaker the 2nd time around?

trading forex breakouts two touches 2ndskiesforex

Those weaker reactions were communicating how the bears were less able to push back while the bulls kept their foot on the gas, producing an eventual breakout.

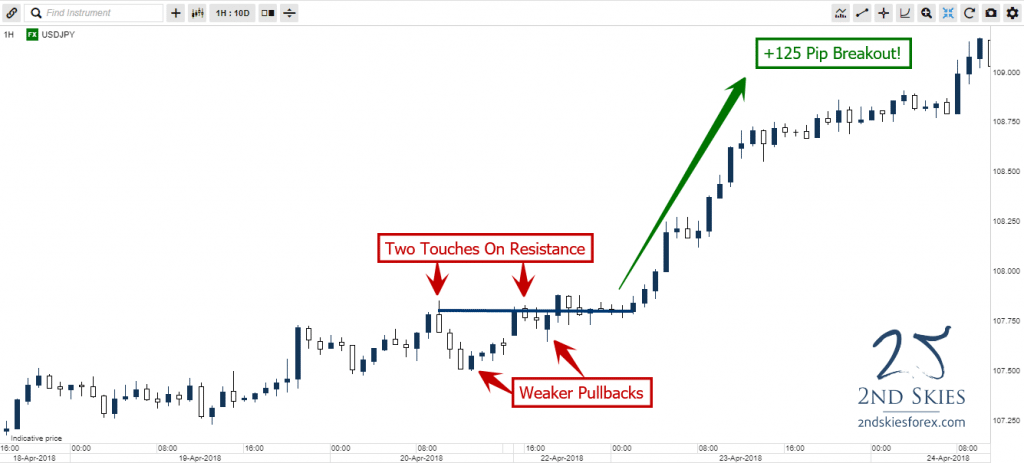
Below is another good example of the two touches + weaker reactions to the resistance level on the USDJPY, producing a +125 pip breakout.

forex breakout setups 2ndskiesforex

Hence, make sure to look for weaker reactions each time off a key support or resistance level to identify a high probability breakout.

Key Tip: One additional pattern you can apply in the price action is to look for breakout setups that are forming with trend vs counter trend.

Now that I’ve shown you two underlying components of a breakout strategy, let’s talk about how you can get in on a breakout pullback setup.

The Breakout Pullback Setup

Assuming you’ve found a situation whereby you have the minimum two touches off a key support or resistance level, along with weaker reactions to the level each time, let’s talk about how you can get into a breakout pullback setup and how I trade it.

Once the market and price action has closed above your key support or resistance level, I’ll place a limit order on that particular support or resistance level to trade in the direction of the breakout.

NOTE: I am not waiting for a confirmation price action signal to form on that level. If you’ve read the price action context correctly, and found a legitimate breakout, any confirmation price action signal will only give you a weaker entry, and thus reduce your profitability.

If you learn to read the price action correctly, you won’t need any confirmation price action signal to get in the market, because the underlying order flow from the big players will already be there.

When I’m trading a breakout pullback setup, once I’ve qualified the breakout, I’m placing my order to get long/short on a pullback to the level.

If the order flow at that level is legit, there will be larger players willing to get long/short at that level without the need for any pin bar, inside bar or ridiculous tailed bar.

Case in point, watch this video on me doing a live breakout pullback trade on the NZDUSD for +100 pips of profit with only a 29 pip stop loss.

Notice how there were two touches on the support level near 6625, along with each bounce getting weaker. Once the market broke through the level, I placed my order to get short.

After pulling back to my level, and barely going negative, the pair took off for over +100 pips of profit.

Had you waited for any confirmation price action pin bar signal, you would have a) gotten a worse entry, and b) had less profit potential.

You can see another example of a live trade using a pyramiding trading strategy where I get in on the breakout pullback setup to the level on both trades, stacking onto the same with trend move for extra profit.

After watching the two videos, hopefully these examples give you a good idea of how to trade the breakout pullback setup.

How to Avoid False Breaks?

There is a lot that can be said about avoiding false breaks when trading the breakout pullback setup, and there are many breakout patterns that often fail.

false breakout patterns

To keep it simple, the best thing you can do is:

a) learn to read price action context, and

b) trade with trend as much as possible

By learning to read price action context, you’ll have a better grasp at finding key support and resistance levels where there is a lot of order flow around that level. You’ll also be better able to spot with trend environments, which are much more favorable for breakout trade setups. This is because there is a greater amount of order flow in your favor to support your trade.

In Summary

To recap, trading forex breakout patterns can be a highly profitable trading strategy when you learn to identify A+ breakout setups. There are two classifications of breakouts, which are a) the momentum breakout setup, and b) the breakout pullback setup.

There are also key breakout patterns you can spot in the price action which will help you find higher probability breakout trades.

In the beginning, try to trade breakout pullback setups as they require less skills, and will help you build your confidence in trading breakouts over time.

Lastly, when trading the breakout pullback setup, make sure NOT to wait for confirmation price action signals as they’ll give you a worse entry (trade location) and reduce your profitability.

Now Your Turn

What did you learn from this article that helped you with trading breakouts in the forex market (or any market for that matter)?

Did you find this useful and give you some increased confidence to trade breakouts?

Are you currently trading breakouts and struggling?

Please make sure to leave your feedback and comments to help us create better trading articles and content for you.

Until then, may good trading setups and karma be with you.

Kind Regards,
Chris Capre

What’s inside today’s trading article?

  • How to find the strongest support and resistance levels
  • What variables should I be looking for when picking my key support and resistance levels
  • How do I know how strong a major support and resistance level is?

Being able to find high probability key support and resistance levels is an important skill you’ll need to build to become a profitable trader. There is no way around this. If you’re wanting to trade price action, you’ll have to learn how to identify and trade key support and resistance levels.

One of the more common questions I get from struggling traders is “how do I find the strongest support and resistance levels?”

In this week’s trading article, we’ll answer this question, along with what variables you need to look for in finding key support and resistance levels, and how to identify the overall strength of that level.

Let’s jump in…

The Mindset Around Key Support & Resistance Levels

First off, it’s important to understand you need a particular mindset and understanding about support and resistance levels. What I’m particularly referring to here is that you have to view S/R levels ‘probabilistically‘. You cannot think of them as black or white, good or bad, going to hold, or not going to hold.

Trading doesn’t work like that, nor does price action, nor does S/R levels. You have to trade and think in probabilities. There is no way around this!

Just want to get this out of the way.

Also, it’s important to think of S/R levels more as ‘zones‘ and not fixed lines in the sand. This means you realize there isn’t one price where the support or resistance is broken. So you cannot think of it like “if the EURUSD breaks 1.1350, I’m bullish, but if it’s at 1.1349, I can’t be bullish“.

Order flow doesn’t work like this, nor are all large institutional players and hedge funds parking their buy/sell orders at the same price. They will often ‘cluster‘ their orders around specific prices. And it is this small cluster (or range of prices) which constitutes the ‘zone‘.

So avoid the trap of relating to support and resistance as a single price or line in the sand. Think of them as ‘zones‘ of important order flow.

How To Find The Strongest Support And Resistance Levels (in all financial markets)

The strongest support or resistance levels will more often than not be with trend. What this means is, if we are in a bull trend, pullback levels to support will more often than not be ‘stronger‘ than resistance levels above. This is because the underlying order flow in a bull trend is more dominantly on the buy side. Holding multiple tests of a with trend level usually is a good indicator of it’s level of strength.

Until the trend changes, hedge funds and large institutional players will be looking to buy more than sell, so the order flow on those pullback levels will often be ‘stronger‘ than resistance levels, which will often fold faster.

Below are a couple examples.

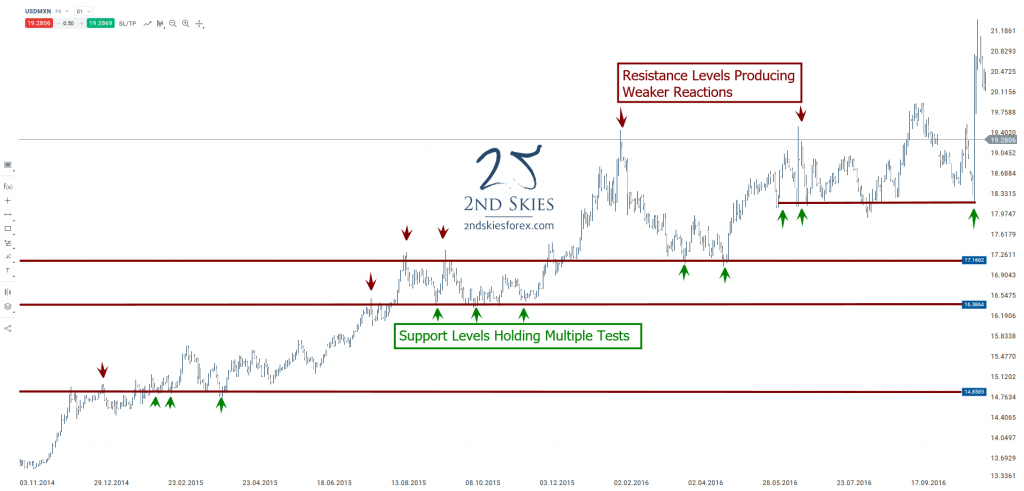
strong-support-levels-in-forex-holding-multiple-tests-2ndskiesforex

In this chart on the USDMXN (daily chart), notice how the resistance levels only survive a few touches before breaking, while the key support levels survive multiple touches before creating a new leg higher? This should tell you where the dominant order flow is (on the bull side) and that until you see this structure and order flow changing, you want to be trading with trend as much as possible.

NOTE: If you want to see a good example of me trading with the trend using key support and resistance levels, click on that link to watch a video of me profiting +300 pips trading S/R levels.

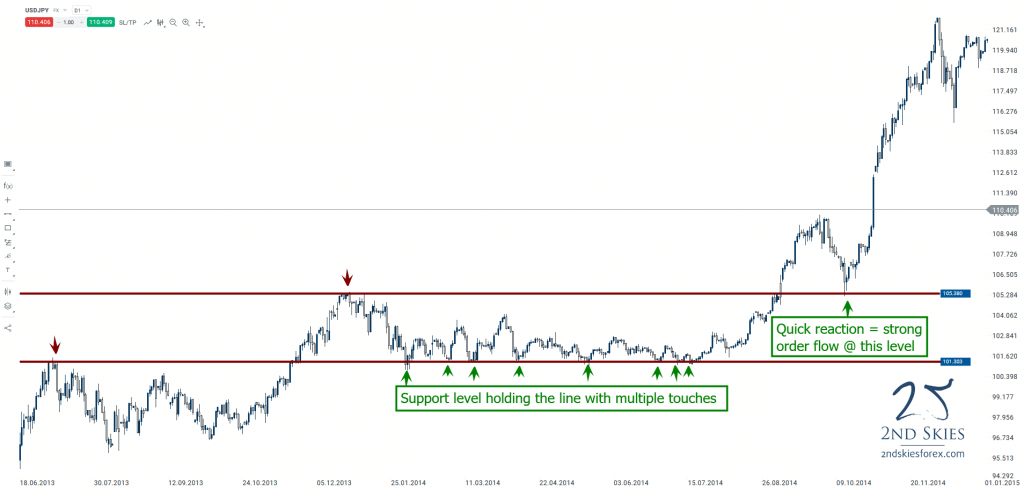
Another example of how a with trend support level held multiple touches is in the USDJPY (daily chart).

strongest-support-levels-in-forex-2ndskiesforex

Notice how the support levels held multiple touches in the middle. The ability to withstand multiple touches tells you the more dominant order flow is on the bull side as they’re able to handle multiple tests while holding the line.

Also notice how the last support level (~105.38) was just barely touched before producing a super strong bull move? Quick reactions that take out prior swing highs often denote impulsiveness and a strong amount of order flow present to hold the level for 1-2 candles before rocketing higher 1500 pips. So make sure to note these variables as demonstrating strength in a particular level:

  1. holding the line after multiple touches
  2. strong/short reactions from a key S/R level
  3. with trend levels will often be stronger than counter-trend levels

Now that you have a few variables to look for, make sure you build your skills in identifying these variables till they become sub-conscious.

What Other Variables Should I Be Looking For When Picking My Key Support And Resistance Levels?

Besides looking for with trend levels, another good variable to look for are corrective structures with multiple touches on both sides of the market.

A really good example of this lately has been the AUDJPY which we’ve talked about in our market commentary recently.

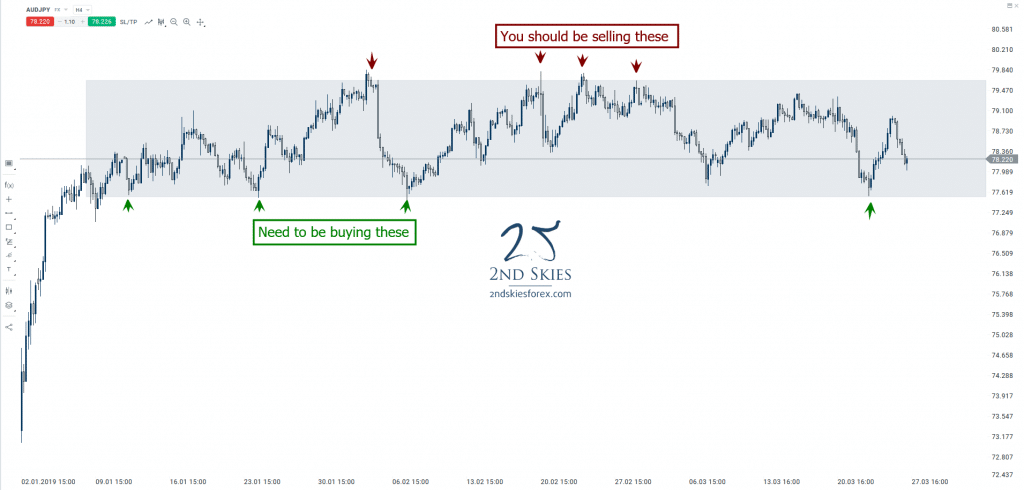
corrective-structures-offering-good-support-and-resistance-levels-audjpy-2ndskiesforex

Looking at the 4hr chart, you can see in the box how the price action has had multiple touches on the top and bottom of this corrective structure. What this communicates from an order flow perspective is that both sides of the market are in a state of balance, so neither side is dominant and ready to take over yet.
When you have corrective structures like this, it’s important to be trading both sides of the market until the structure breaks. This will give you a lot of trading opportunities with small stop losses (i.e. above/below the structure) while targeting the other side of the corrective structure.
In most cases, this structure would have offered several +3-4R trade setups. It is something we talked about with our members ahead of time, so congratulations to those students who profited from these trades.

NOTE: You can watch a live trade video of me profiting +160 pips trading off a key support level here.

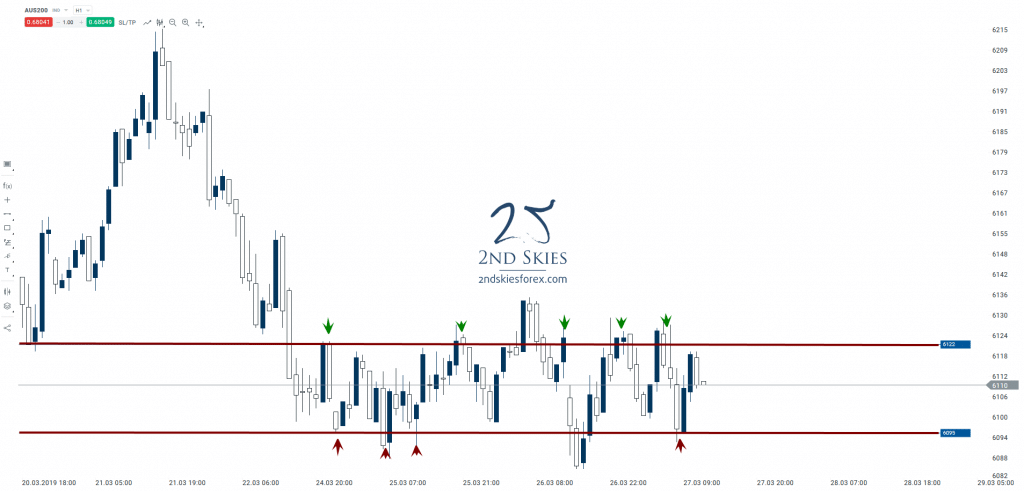
Moving forward, you can see another example of these corrective structures on the ASX 200 1hr chart.

day-trading-setups-asx-200-2ndskiesforex

Although the levels are not as ‘clean‘ as the AUDJPY chart, the overall corrective structure is there and with a little more buffer, has offered multiple day trading setups for about +2R.

Hence learn to identify corrective structures with multiple touches on both sides of the market and look to trade both sides until the structure is broken.

In Summary

There are many tools and variables you’ll need to identify in the price action which can help you find strong support and resistance levels. Keep in mind, this is a skill that takes time to learn, so don’t expect to read an article and be a pro. You’ll have to build your skills in this over time. If you do this right, you’ll find yourself identifying and trading stronger support and resistance levels.

In our Trading Masterclass course we cover many other variables you’ll need to learn to find the best support and resistance levels. On top of the many lessons we have on S/R levels, we also have market commentary and trade ideas for our members 4x per week where we are identifying the most important support and resistance levels, so you can continually improve your skills.

To learn more about becoming a member and getting access to these lessons + market commentary, click here.

Until then, I hope you enjoyed this article on finding the strongest support/resistance levels, and make sure to leave a comment below.

Additional Articles/Videos To Study:
1) Live Forex Trading +480 Pips on EURUSD
2) Confirmation Around Key Support & Resistance Levels
3) Live Price Action Trade – Pullback To Support Level For +7R

If there is one pattern in the price action you need to learn for trading breakouts profitably, it is this pattern. And no, I’m not talking about a candlestick pattern. I’m talking about trading price action and the order flow behind it.

In today’s trading video lesson, I’m going to share with you my most profitable pattern for trading breakouts.

Read more

What’s Inside?

A key topic that orbits around price action trading is “how do I trade with candlestick wick patterns in the forex market?” The problem with this question is it comes with some misunderstandings about price action, order flow and what wicks really communicate.

The goal of today’s article is to give you a new perspective on trading price action wicks that most ‘internet gurus‘ won’t tell you. It is to give you an understanding of candlesticks, what they communicate and how to relate and trade them.

Understanding Candlesticks

We’ll give you this understanding and how to trade with candlesticks through 4 key points on forex price action wicks.

But before we get into trading wicks, we have to understand the foundation of where our approach comes from.

Key Point #1: The Difference Between Price Action & Candlestick Trading

I approach trading from a particular perspective that a) order flow is the proximate driver of price action, and b) all activated orders in the market are based upon ‘information‘.

NOTE: If you want to learn more about how I trade price action context, click here.

But to simplify it, trading price action ‘context‘ is trading the overall ‘structures‘ or ‘Gestalt‘ of the market. And you cannot get this through 1, 2 or 3 candles.

price action trading-sp500-sep-22-2ndskiesforex

People who trade based upon 1, 2 or 3 candlestick patterns, such as pin bars, or fakey’s, or engulfing bars are candlestick traders.

Fun Fact: The fakey pattern or setup, is really called the Hikkake pattern, given that name decades ago, which today many forex ‘gurus’ have renamed to make them sound like their own.

Regardless, candlestick pattern traders are not ‘price action traders‘. They are ‘candlestick traders’. Essentially, candlestick pattern traders believe 1, 2 or 3 candlesticks define the price action context and order flow in the market, and thus give you trade setups.

But ask yourself, why do many key support or resistance levels hold without a pin bar rejection. Why would it do that if the pin bar is such a superior tool for recognizing and ‘confirming‘ whether the key support or resistance level will hold? Why do banks, hedge funds, and prop traders place orders at particular prices well before a pin bar has ever formed, and not based upon the New York close daily charts?

NOTE: If you want to learn why a typical pin bar entry is a retail entry, click here.

When you start to ask these questions, the foundation for trading pin bars and candlestick patterns breaks down. That leaves you with trying to understand the underlying order flow in the market. And you do this by learning to read and trade price action context.

This is how we approach the market.

Now that we have this foundation, we can move on to how do we relate to forex price action wicks (or any wicks)?

Key Point #2: All Wicks Are Rejections of Value

When you look at the essence of what a wick represents in terms of the price action and order flow, you come to the conclusion that all wicks are a communication. They communicate that the order flow was rejecting that pricing and value.

If the market accepted it, it would close there, and remain there.

However, there is a ‘but’ in there. The ‘but’ is while wicks in the forex market = a rejection of value, they are not for defined periods of time or defined moves in pips.

What I mean by ‘not for defined periods of time‘ is a) beyond the close of their candle, and b) they are not going to define how long the market will reject that move or value from that moment forward.

What does give you this information? Price action context.

The goal of price action context is to give you a ‘probabilistic framework‘ for what the market is more likely to do. Wicks will not give you this information, nor give you a probabilistic framework for how to trade this.

Hence you have to come back to price action context.

price action context 2ndskiesforex

The most essential point to understand here is forex price action wicks (or any wicks) = a rejection, but we cannot understand how that rejection will manifest, so we have to take these as a grain of salt.

What this also means is that 1, 2 or 3 candlestick wicks will not ‘confirm’ a rejection of a specific kind (which is what we want if we’re going to trade said ‘confirmation’ or rejection).

If you want to understand why confirmation price action signals will crush your account, click here.

Key Point #3: Opening And Closing Of Candlesticks Do (And Do Not Matter)

Wait a minute, how can the opening and closing of candlesticks ‘matter’ and ‘not matter’? Let me explain.

In very ‘particular’ circumstances, the opening and closing of candlesticks will matter. Such as:

  1. if you are trading some sort of ‘opening’ gap strategy
  2. if you are trading specific types of breakouts
  3. if you are trading specific candlestick patterns

candlstick wicks rejection 2ndskiesforex

There could be a few more circumstances, but by and large, the majority of time, the opening and closing of candlesticks do not matter.

What matters more is order flow and price. This is why most institutions, hedge funds, and prop firms know their price ahead of time, regardless of the close. They know where they want to get in, and where they want to get out, regardless of the candle being open or closed.

Hence the opening and closing of candlesticks matter, but on a limited scale.

Key Point #4: How Do You Trade Forex Price Action Wicks?

There are many ways I relate to forex price action wicks (or any wicks) in my trading, but I’ll give you a couple wick trading strategies below.

Trading Strategy For Wicks #1: With Trend Wicks Will Be More Reliable (or ‘probable’) Trading With Trend vs Counter Trend

If a wick represents on a base level some sort of ‘rejection’, which side is most likely to ‘reject’ the price or value? The with trend players, or counter trend players?

With trend is the answer. With trend players are more often controlling the market and order flow, so they’re more likely to reject a price effectively cause they’re largely in control.

I personally like seeing with trend rejections on pullbacks heading into a level because they are showing a more ‘probabilistic framework’ of order flow in the market.

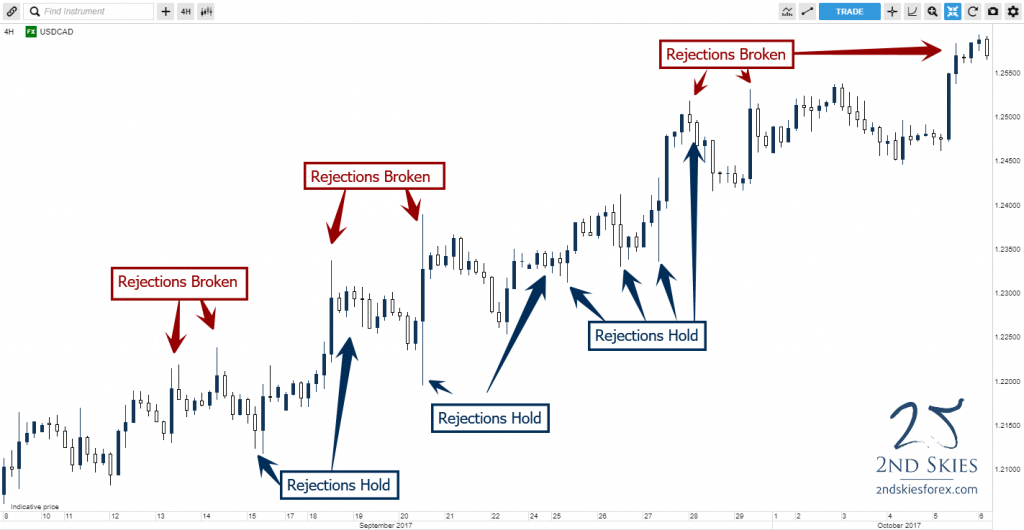
Below is an example of a good chart showing this on the USDCAD 4hr chart.

forex price action wicks holding with trend 2ndskiesforex

Notice how the majority of the wicks and rejections with trend hold, while the counter-trend rejections fail?

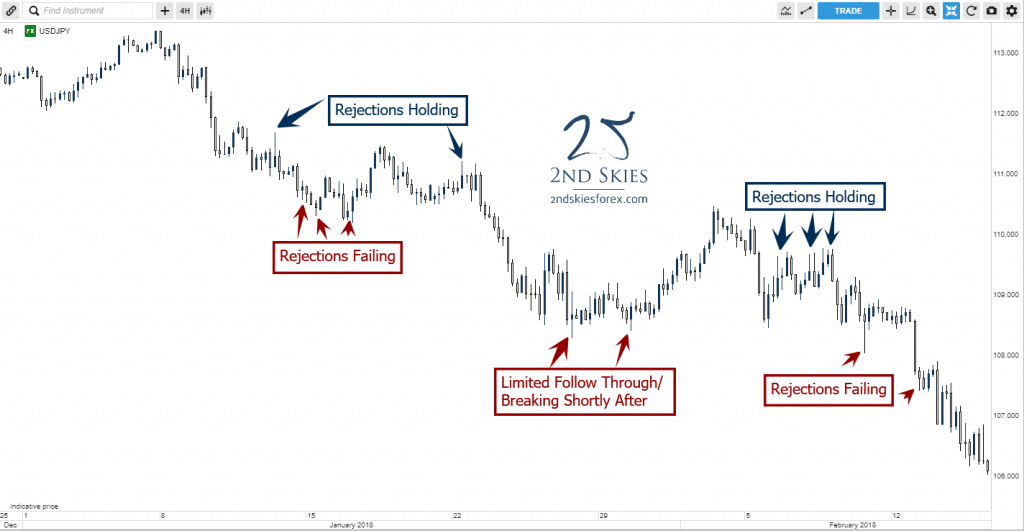
Below is another good example of a chart on the 4hr USDJPY chart.

forex price action wicks holding with trend v2 2ndskiesforex

Hence when trading, if you are trading with trend, wicks rejecting price in your favor make your trade more ‘probable’, while trading counter trend are less ‘probable’.

If you wan to learn more about trading with a probabilistic mindset, click here.

Trading Strategy For Wicks #2: Clean Wick Rejections Off Key Support or Resistance Levels Are Best

What do you mean by a ‘clean’ rejection or wick off of a key support or resistance level?

While I relate to support and resistance as ‘zones‘ of order flow, sometimes they line up super well to where you can clearly see price is rejecting off a very specific price and value.

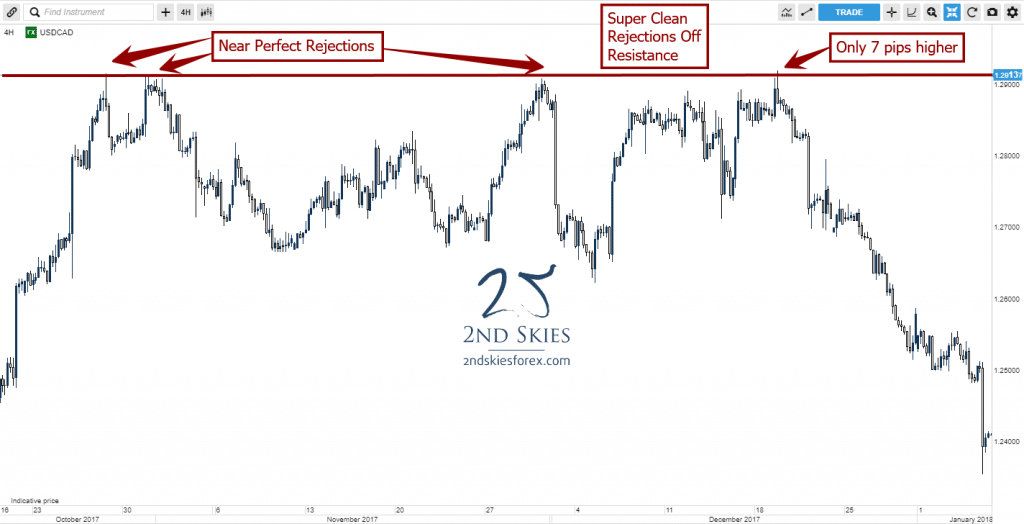
Case in point, take a look at the USDCAD 4hr chart from mid-October last year to mid-Jan this year (~3 mos).

super clean rejections wicks off of resistance 2ndskiesforex

You can see in the chart above, the price action rejected off of the key resistance level near 1.2913 six times in a 3 month period with almost every rejection happening within a few pips of each other, and the biggest break being only 7 pips.

When price rejects very ‘cleanly‘ off of a key support or resistance level, they become more ‘probable‘ of a legitimate rejection.

Not all charts and key levels will look like this, but they do often in many price action structures, and can be good for building your ‘probabilistic framework‘ for understanding price action context and the order flow behind it.

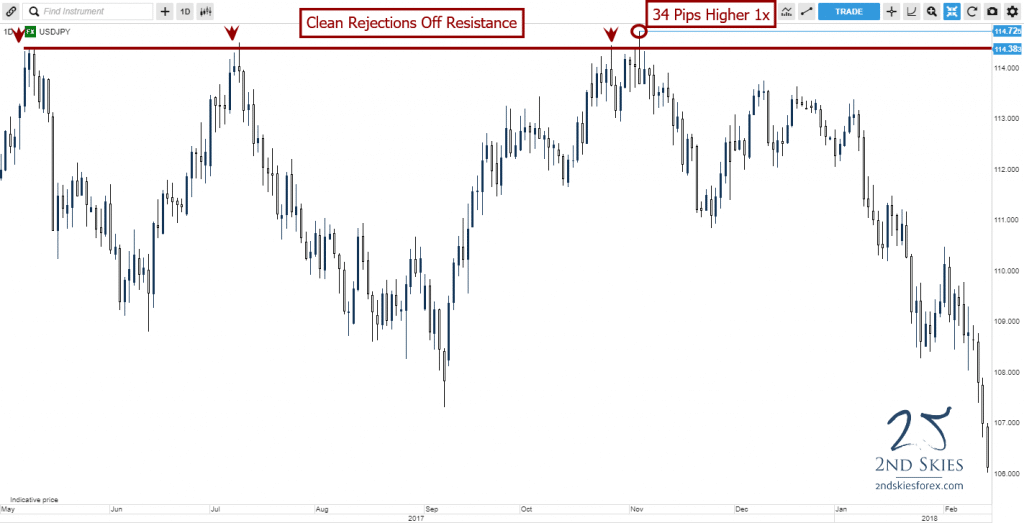
You can see another example of this below with the USDJPY daily chart.

clean rejections wicks off of resistance 2ndskiesforex

Notice how 3 of the 4 rejections were almost at the same price with only one breaking by a small amount?

There are many other ways to understand wicks and rejections in the price action, but these are two good methods to work with that I use personally and trade profitably with my own money.

In Summary

Forex price action trading wicks (or wicks in any market) are important to understand, particularly from the perspective of order flow and price action context. Wicks ‘communicate‘ at a base level ‘rejection‘, but they do not by nature determine any rejection to follow through.

However there are ways you can use wicks in your trading price action, particularly the two methods I mentioned:

  1. with trend wicks add to your ‘probabilistic framework’ better than counter trend wicks
  2. clean wick rejections off of key support and resistance levels also add to your ‘probabilistic framework’ for trading

Now Your Turn

What did you learn from this free trading article? Do you feel you understand candlestick trading wicks, rejections and how they work in forex applications?

Make sure to leave your comment below, along with share this via Twitter or Facebook with those you think can benefit from this.

Less than two weeks ago, a course member asked me the following question (click to enlarge):

2008 crash

Here was my response:

“You have to be prepared for bigger pullbacks & volatility than usual. You have to keep staying short till you see a broad base of instruments bottoming and showing a transition in the price action and order flow” – from my members coaching session Feb 14th.

This week, we got a taste of this volatility, and there is a decent chance the selling + volatility may just be starting. Hundreds of my clients and friends have been asking me, “Is the stock market about to crash?”

In this trading article, I’m going to discuss the coronavirus, the increase in volatility, what’s happening the financial markets, is the stock market going to crash and how I’m trading it.

So grab the popcorn and a good beer as we’re going to get into the thick and thin of it.

Coronavirus + Volatility = Panic!

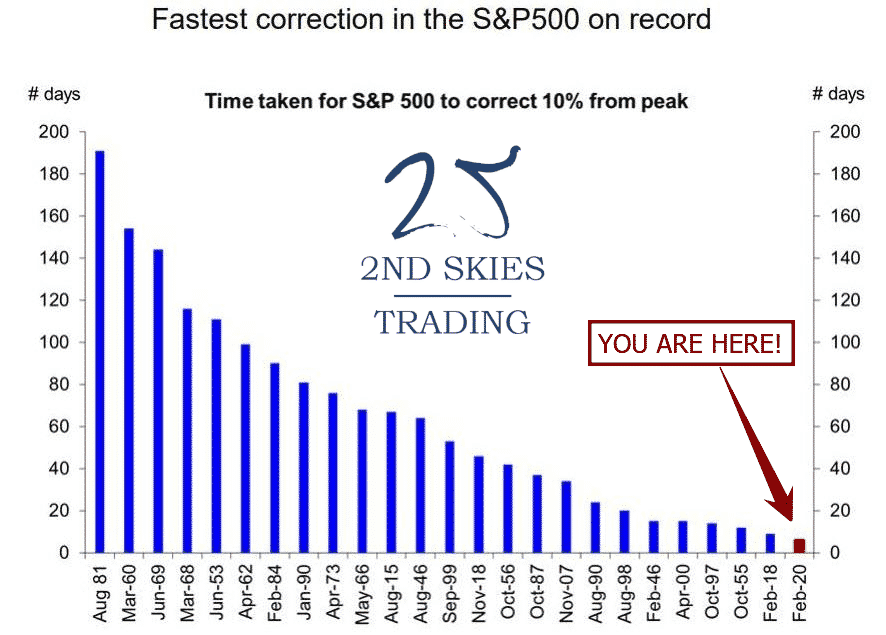
Let’s get into some stats around this week’s incredible sell off in the global markets. This week’s drop in the S&P 500 was the fastest 10%+ drop IN HISTORY!

Exhibit A: The Fastest Correction (10%) in History (S&P 500)

fastest correction S&P 500 in history 2ndskiesforex

In the last 7 trading days starting with February 20 – 28 (from open to close) lost 440 points shedding 12.9% while global markets puked $5 trillion in market cap.

Translation: In the last 7 days, we lost the GDP of the UK & India combined! (source: investopedia)

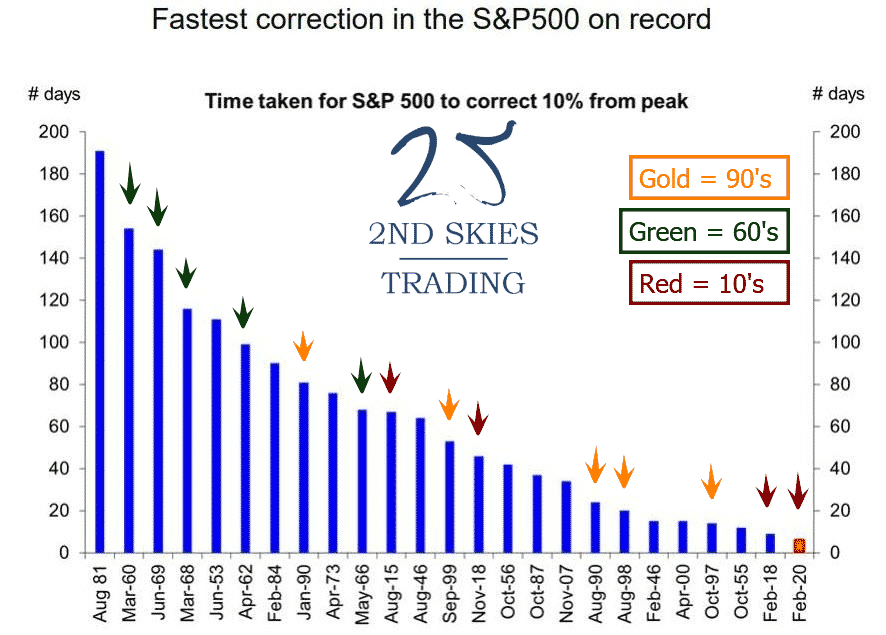
Also of note, the fastest and second fastest 10% declines (from peak) have happened within this decade.

Of all the decades going back to the 40’s, the 60’s and 90’s had 5 of the fastest 10% corrections in history. This decade is in 2nd place with 4 of them (see below)

fastest corrections by decade 2ndskiesforex

Also of note is 3 of the last 5 of these fast 10% corrections have happened in the last two decades and 7 out of 10 in the last 30 years.

Translation: these corrections are happening faster in more recent history than before.

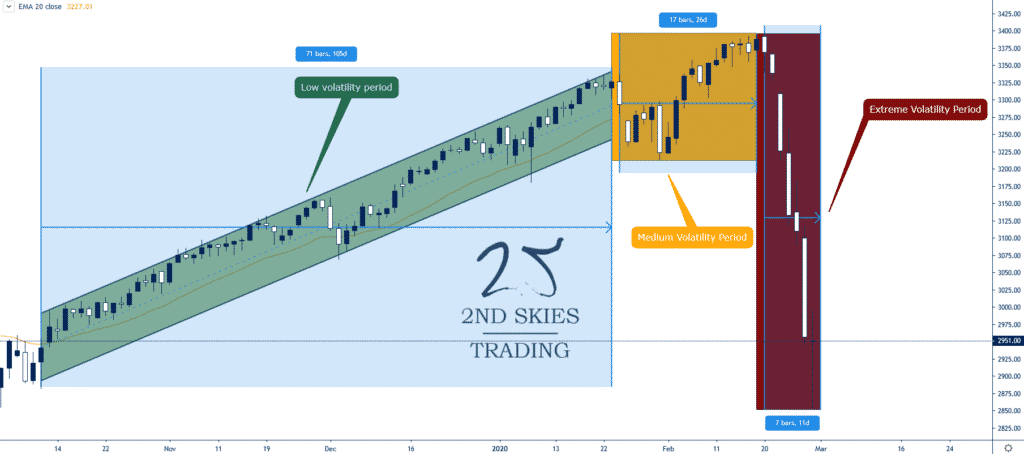
What is also important to note is how low volatility was in the S&P 500 until the corona virus started to become prevalent in the markets (see below).

volatility ranges S&P 500 2ndskiesforex

We had 71 days of super low volatility and many 5 day stretches where the markets never dropped more than .5% (green box)

Then we had a period of 17 days with mildly increasing volatility when the coronavirus was becoming more of an issue.

This culminated in a 7 day explosion of volatility last week erasing months of gains in a flash.

This is one of the most important trading lessons I’ve learned over 20 years. That markets can and often do sell off faster than the run ups.

The reason why this can happen has to do with market psychology and behavioral finance.

In a long bull trend, the general emotions are complacency, confidence and greed. This has to do with simple biology.

We are wired as humans to react more rapidly to stimuli which threaten our existence. Slow non-volatile bull markets don’t threaten us, so we don’t often react with alacrity at a small sell off.

The emotions behind a bear market or extreme selloff is fear, worry and panic. Hence a sharp selloff and quick loss in our portfolio is threatening, thus leading to fast reactions (SELL & SELL EVERYTHING!).

This is why markets can sell off far more quickly then on the way up.

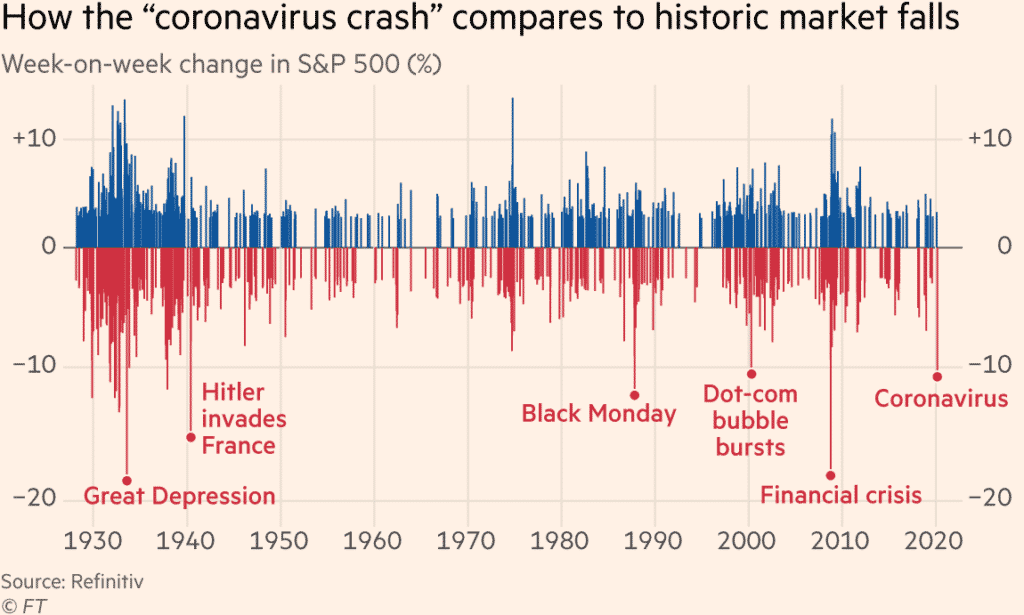
There is a reason why the fastest week-on-week changes in the S&P 500 (%) are during crashes vs bull runs (see below).

fastest week on week moves S&P 500 2ndskiesforex

The big moves to the downside (week-on-week %) are simply larger and more frequent.

This also means big week-on-week changes create a feedback loop for panic selling to continue.

What this means for investors and traders is we make quicker trading decisions during bear vs bull markets.

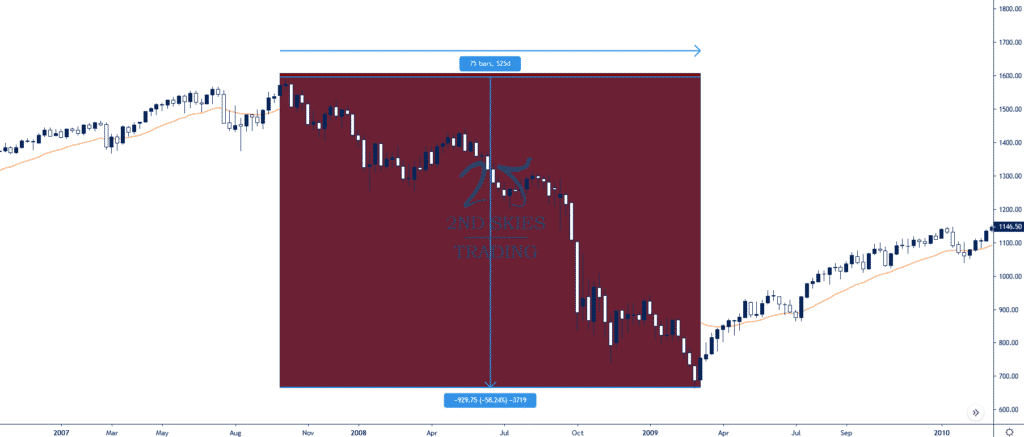
Now in comparison to the 2008 financial crisis, the S&P 500 lost 58% from Oct 07’ – Mar of 09’ over a period of 525 days peak to trough (image below).

2008 sell off S&P 500 2ndskiesforex

We’ve already lost 12.9% (about one-fifth of the 08’ drop) in just 7 days!!!

And if we happen to get another 58% decline, we’ll be looking at an S&P 500 around 1400 by the time this is over.

Translation: this selloff has the potential to be one of the most rapid declines in history. And the speed at which we’ve lost so much so fast last week could create more selling from investors globally.

Going from a low volatility environment to a high one this quickly will create stronger biological reactions, hence the formula Coronavirus + Volatility = Panic!

Is The Stock Market Going to Crash?

Short answer: I don’t know. I don’t think we’re there yet.

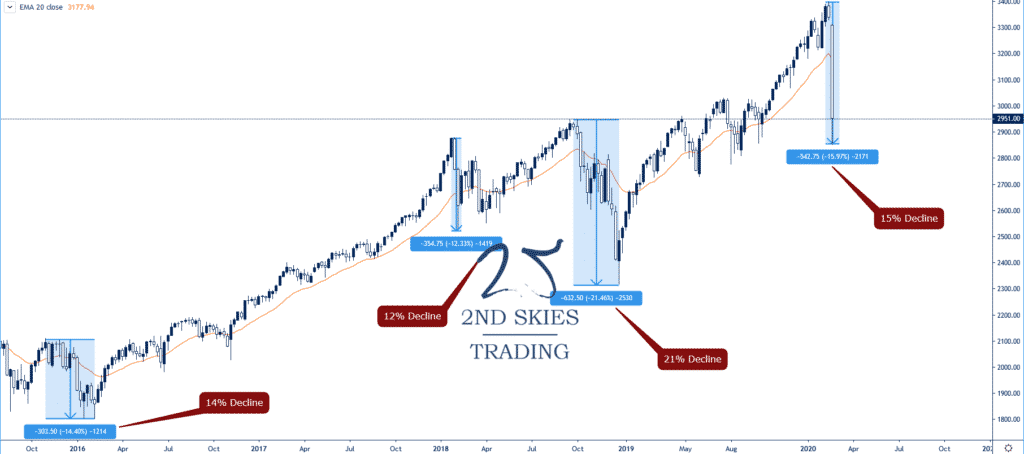
We’ve had many 12+% declines in recent history (4 total) since 2016 with a 12.33% decline (Jan 18’) being the smallest and a 21.46% decline the largest (Nov 18’).

recent declines S&P 500 2ndskiesforex

I think once we start seeing a 25% drop or larger, investors along with major institutions (Fed, Trump Admin) will start to really panic.

Combine this with the fact we’re in an election year and the last thing Trump wants is a stock market collapse.

In some sense, it’s even a bigger issue for Trump as he campaigned on his business skills, and has proudly taken credit many times about this being the “Greatest Economy Ever” pretty much anytime we’ve posted all time highs over the last few years.

Should we get a strong selloff next week and start reaching the -20% levels, expect a govt stimulus to come which (depending upon how its setup) could create a short term strong bounce.

But here’s the kicker…

Let’s say the coronavirus continues to spread from country to country with more and more population centers becoming infected.

Is a Fed rate cut going to inspire you to travel? No.

Will a Fed rate cut give you the confidence to go out in public and risk getting infected with a potentially deadly disease? No.

And this is how this threat to the markets is different than the 2008 great financial crisis.

The 08’ crisis was an economic one (over-leveraged exposure to housing) which was able to spread globally.

The coronavirus isn’t an economic issue, it’s a biological and containment issue.

Economic policies will be more effective (like in 08’) simply because it was more of a 1-1 relationship (economic problem & an economic solution).

However, economic stimulus isn’t going to change a biological health scare because the relationship isn’t a 1-1 match.

My sense tells me economic stimulus packages will be far less effective vs the actual biological and crisis management of the issue.

That is where IMO traders and investors globally should be looking for signs of a turnaround should this selloff get worse.

We haven’t gotten to the ‘Oh-Sh!t’ levels yet. Once we start to get into a 20-25% decline, then I think you’ll start to see real panic in the markets.

How to Trade & Protect Your Long Term Investments During This Time?

I wouldn’t think of buying anything till at least we see the market open this week.

How the Asian markets open will likely give a strong tell as to how the week will go.

Hence before you go rushing into what you think might be ‘cheap’ prices compared to recent history, wait to see how the market opens.

We’ve only had a few instances of the markets selling off for 3 weeks in a row since Dec 15’ (5 total) and none of them shed this much value.

For now, there are various ways you can protect your long term long term plays if you think there is more downside:

Trading Options

1) collect premium by selling calls on stocks you are holding long term

2) bear put spreads

3) buy outright puts on your long stock positions

Trading Forex

The currencies which have most benefited from this 7 day decline are JPY, CHF, EUR & USD while EM currencies suffered heavily (MXN, RUB, ZAR).

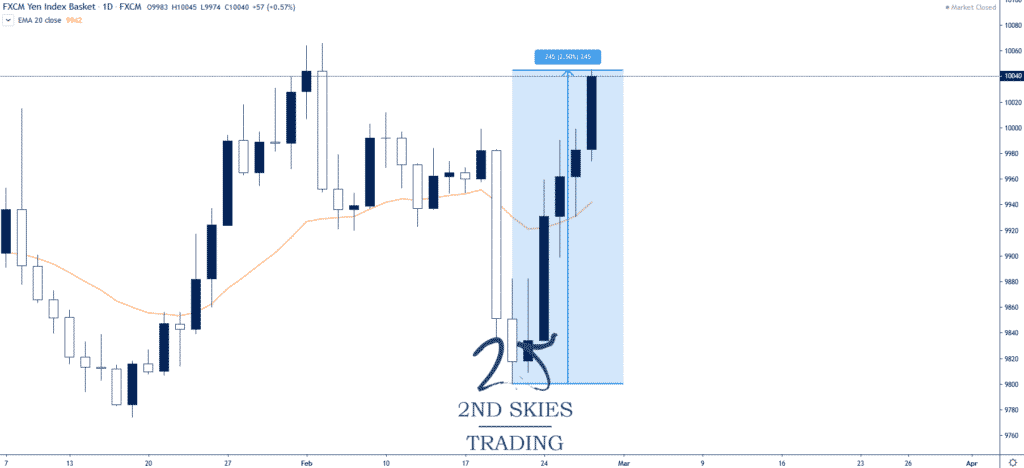
The JPY basket (JPY vs USD, EUR, GBP, CAD & AUD) gained 2.5% last week (image below).

jpy basket 2ndskiesforex

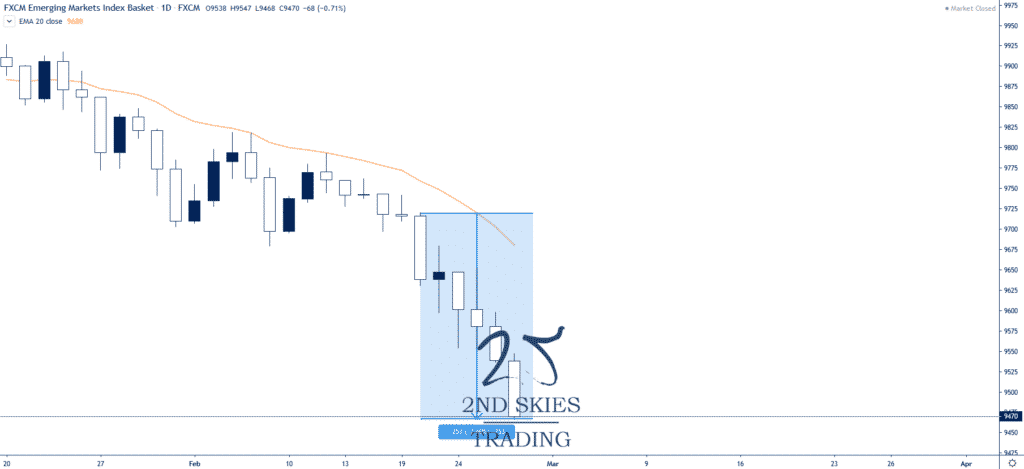
Meanwhile the EM basket (USD vs CNH, MXN, ZAR & TRY) lost 2.6% over the same period (image below).

em basket 2ndskiesforex

The EM currencies which suffered the most losses last week were MXN vs EUR (-9%), RUB vs EUR (-8.8%), RUB vs JPY (-9.5%), MXN vs JPY (-9.6%), CHF vs MXN (9.5%), & the CHF vs RUB (8.8%).

If the virus continues to spread, expect further capital to move into these safe haven currencies vs EM betas.

It’s important to note many of these currencies ran into some key support & resistance levels, rebounding a bit to end the week.

Forex currencies tend to overshoot key levels during major crisis, so if we see them blow past many of the current key support & resistance levels, we could be reaching all time highs or lows (EURZAR, USDRUB, USDMXN) on the quick.

I’ve been trading many of these pairs on the 5 minute charts trading intraday breakout setups with two positions.

I’d suggest using the first position to hit a medium term target while letting the second one run and capture as much alpha as possible till momentum changes manifest in the short term price action.

But this is only recommended if you are doing day trading.

Trading Stocks

If you feel an uncontrollable urge to buy stocks, I suggest the following plays:

Watch the market leaders who exhibited strength heading into the selloff and performed well on Friday. If they continue to exhibit strength, there may be a potential buy, but watch the price action:

1) Microsoft (MSFT) which gained 7.7% on Friday

2) Facebook (FB) which climbed 6% on Friday

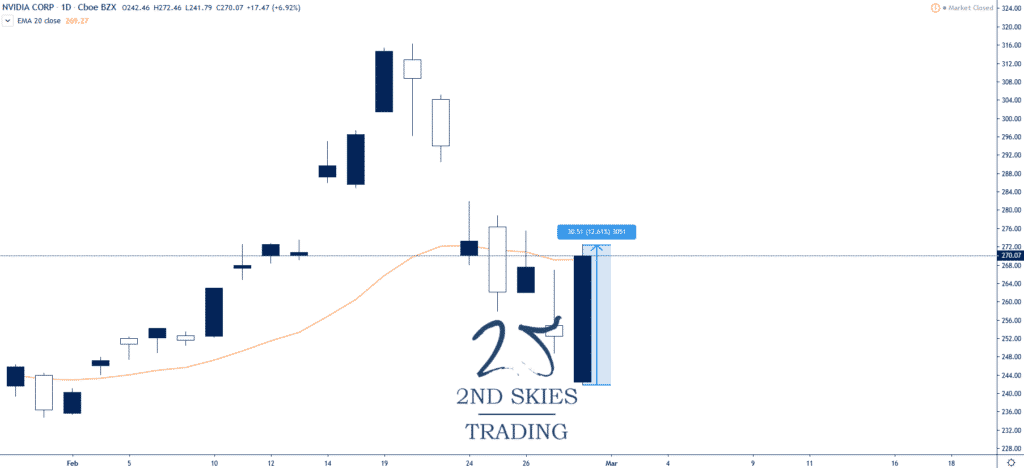
3) Nvidia (NVDA) grabbing a 12.6% gain to end last week

nvidia stock trading 2ndskiesforex

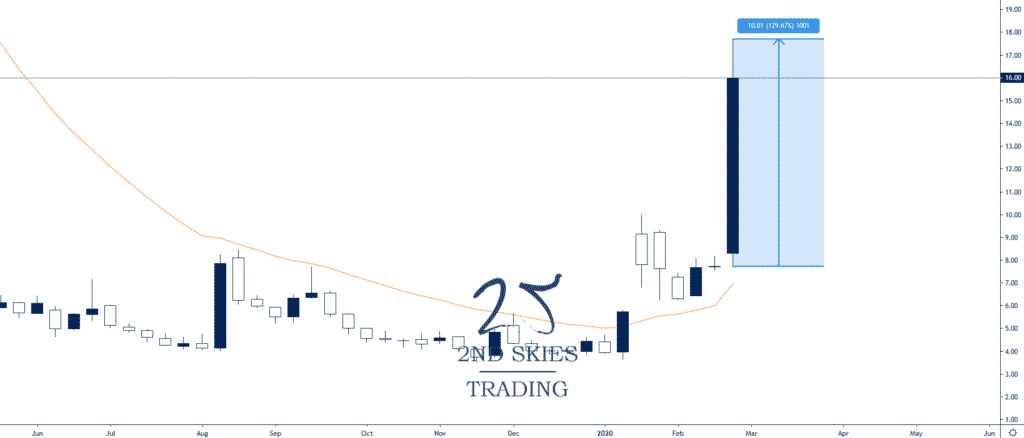
4) If you don’t mind trading nano, micro and small caps, take a look at pharma stocks which have done well recently: NVAX +129% low to high last week, MRNA +96%, and for the truly brave micro cap trader CODX +591% last week low to high (big cajones required 😉)

Novavax (NVAX) chart below:

novavax stock trading 2ndskiesforex

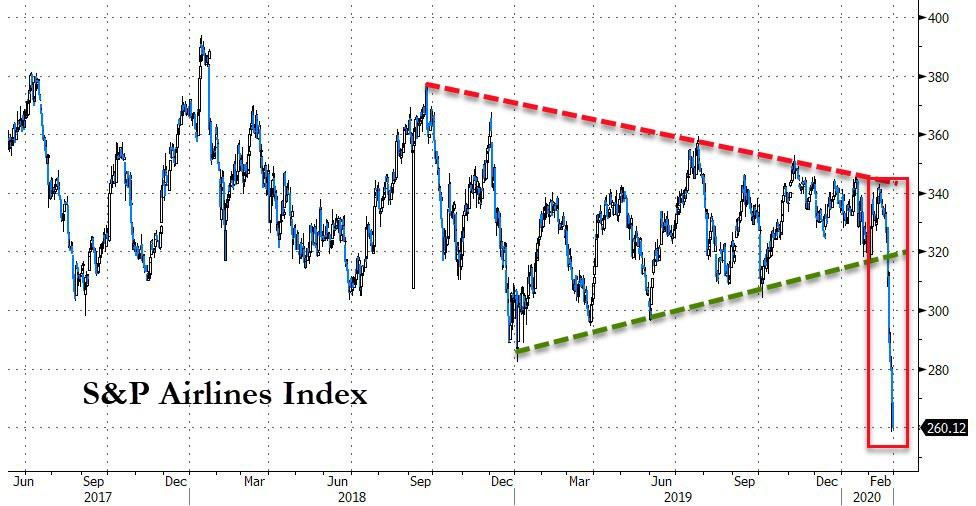
1) Sell Airlines (who wants to fly to another country when there’s an outbreak?) – source: bloomberg

NOTE: A more targeted method would be going after airlines in countries where travel bans or warnings are issued.

sp500 airlines index 2ndskiesforex

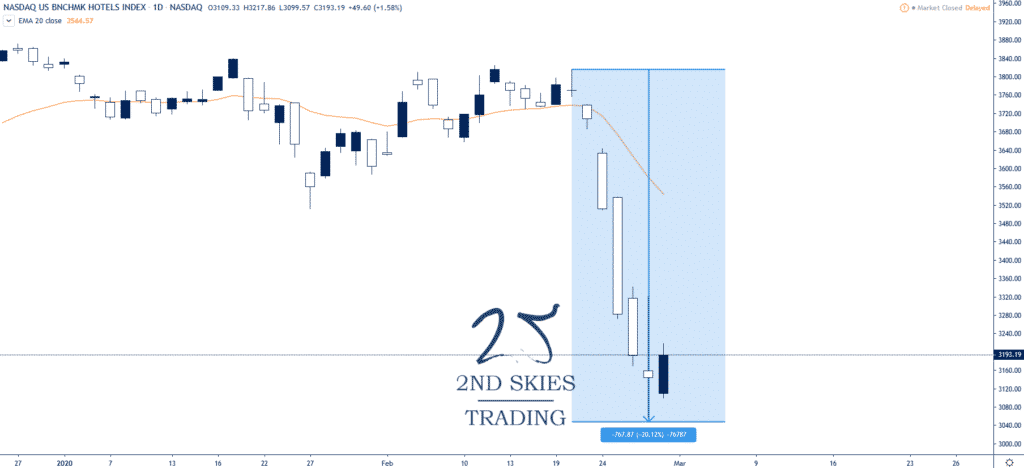
2) Sell Hotels/Entertainment which is down 20% on the week (same reasons as above)

us hotels benchmark index 2ndskiesforex

There’s been a lot of profit taking in commodities, so I’d wait for a change in the short term price action context before getting long (gold and silver in particular).

Wrapping It All Up

Now is not the time to be listening to CNBC analysts, most of whom are not trading. Last week many were all calling stocks ‘cheap’ and in the process getting their a$$’s handed to them.

This is a time to be alert and nimble, using good risk management as the volatility moves on these instruments can wipe out weeks or months of gains if you’re not careful.

Hence trade smaller positions than your usual risk % per trade. Try more ‘proof of concept‘ trades where you put small feeler trades out, and if it progresses, then add on size.

I don’t think the stock market is at its ‘OH SH!T‘ moment yet, but we could get there fast.

I’ve traded now for 20 years and went through 2 major financial crisis (2001 dot.com bust & the 2008 great financial crisis).

The first one I didn’t know what I was doing and performed poorly.

The second one I learned my lesson and killed it.

Traders can make a lot of money if you’re smart and agile, defensive when you need to be and aggressive with precision.

But you’ll need mental toughness to manage your emotions and mindset during these periods.

Do that and you can make a killing. You may not see another time like this for years as its been over 12 since the GFC of 08′.

Hence, avail yourself of the opportunity, be patient, allow for more space in your stop losses due to the increased volatility, and trade with the most impulsive moves till you see changes in the price action and order flow across a broad base of instruments.

******

This was a monster article that took hours upon hours to write and publish. Please make sure to pay it forward by sharing it with others on social media and leaving your feedback below.

Until then, good luck trading and I’ll see you out there in the field.

Chris Capre’s live open price action and ichimoku trades: EURUSD, GBPUSD, AUDJPY, EURJPY, EURCZK, EU50

New to Forex? Then check out my FREE Learn Forex Trading Course with videos, quizzes and downloadable resources

Forex Trading Q&A: How We Teach Price Action Skills & Why You Need Patience {New Video}

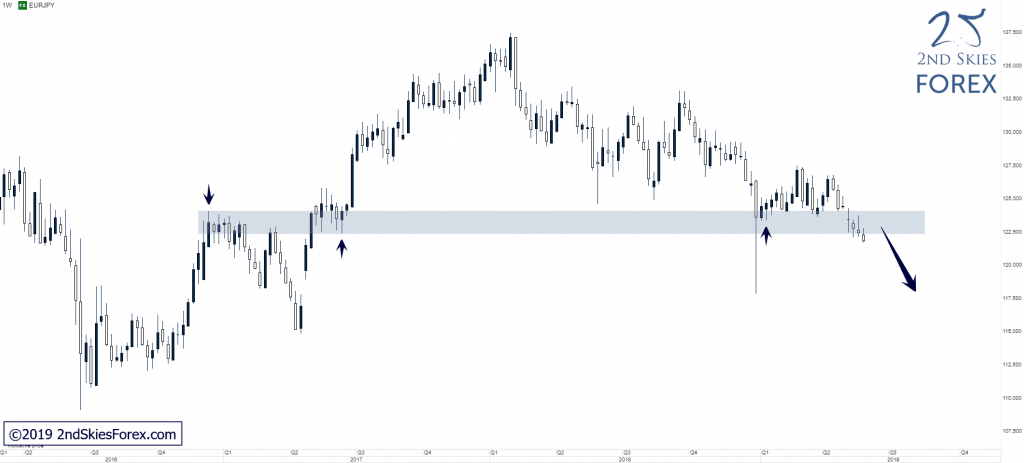
EURJPY – Breaking Below LT Key Support Zone (Weekly chart)

Price Action Context

With almost no signs of bullish order flow over the last few weeks, price has slowly been chewing its way through the LT key support zone we’ve mentioned in earlier commentaries, and this week we’re seeing the first solid attempt by bears to fully clear this support zone.

eurjpy-forex-trade-setup-2ndskies

Trending Analysis

A strong weekly close below this support zone would open up for a potential bearish continuation towards 1.1860, whilst a bullish impulsive move back above the support zone would render this a false break and put 1.27 back into focus.

Key Support & Resistance Zones

R: 122.50 – 124.00
S: 118.60 – 117.70

What you’ll learn in this forex trade plan article:

-How do you build a successful forex trading plan?
-How do you evaluate whether your trading plan is working?
-Why you need a forex mentor to help with your trading plan

One of the more common questions I get from traders is “how can I build a successful forex trading plan?” If you’ve had this question before, or feel your trading plan is not sufficient, confusing, or not working, then pay attention because this article will answer your questions directly.

From my experience, you will need (at a minimum) these 5 major components to be in any successful forex trading plan you make. Let’s go through them.

#1 Your Why

From my experience, you need a ‘why‘ as to why you’re doing this. It should be the ‘core‘ reason and inspiration behind why you’re trying to become a successful trader.

For most traders, the why is simple:

“To build financial independence while working from home, having more time to spend with your friends, family, while determining your value and income, and having no limit to the upside you can make.”

Would this pretty much encapture the main reasons why you want to become a successful trader?

Now there is certainly a deeper discussion we can have about your ‘why‘ and what you think it will give you, but for now, my guess is almost all of you fall into the above reasons why you’re wanting to become a professional trader.

The reason why I suggest getting really clear about your why is it will remind you (no pun intended) why you are doing this, but more specifically, why you should work hard to achieve your goals. This is helpful when things are going wrong as that is when you need a boost in motivation and connection to your why.

By having a personal and emotional connection to your why, you’re more likely to stay focused and keep going when things are challenging.

#2 Daily Preparation

Ever watch a professional sports game, particularly before the game starts? What do you notice if you turn on a football game a few hours before it starts? You’ll see the same thing across pretty much every sport on the planet.

All professional athletes start hours before the actual game/contest doing one thing: Preparation!

They are preparing their body and mindset to get ready for the game ahead. Take a look at this 30 second video of Odell Beckham Jr. (American Football Player) getting ready before his game.

What do you see him doing? Rehearsing the exact same things he’ll be doing in the game (running routes, making cuts, catching passes). Keep in mind, this is after he’s done his stretching and exercise routine to get his body warmed up for this.

Now I have one simple question for you: “Do you think trading should be any different when it comes to preparation?” 

The question is mostly rhetorical, however when I quiz most struggling traders about their pre-trading routine, its usually very minimal at best.

Now I know many of you have full time jobs and lead busy lives, and perhaps only have 1-2 hours per day to trade. If that is the case, then I’d suggest spending at least 15 minutes preparing mentally for your trading day. This should be finely crafted into a very specific routine you execute day in, day out.

What should you be doing during this preparation phase of trading? At a minimum:

1) getting your mind (and ideally body) in an optimal state for trading
2) mentally rehearsing everything you need to do during your trading day
3) after you’ve done the above, then starting your pre-trade routine

The above is what I would call a ‘sufficient‘ and ‘expedient‘ way to prepare for your trading day and get you in a mindset + state to make money trading.

#3 Core Trading Mechanics

Now that you’ve 1) connected with our ‘why‘, and 2) mentally prepared for your trading day, it’s time to sit down in the chair and start trading your edge. However, you need to clearly lay out what you are trading, and how. These are your core trading mechanics and a blueprint of what you’re trading.

In this part of the forex trade plan, you need to cover the following:

1) markets/instruments you are trading (should be fixed in the beginning until you’re at least stable or consistently profitable)
2) what strategies are you trading (these should be very clear what you are trading, along with the parameters/conditions for each strategy and setup, such as entry, SL and TP conditions)
3) what time frames you are analyzing the price action context and making your trading decisions from

In the beginning, I recommend trading no more than 5-10 instruments (less is usually better in the beginning) so you can learn their price action, volatility and order flow patterns by watching the same instruments day in, day out.

Gaining familiarity will allow you to find more trading opportunities in those instruments over time, and thus profit more.

You’ll also need to know exactly what trading strategies you are using day in, day out so you’re very clear about what setups you should be focusing on, and what you should let go of.

Forex Trading Tip: Once you know what strategies you are using, make sure you have screenshots of those setups (ideally you trading them successfully live) so you can imprint these patterns and charts into your brain. This way when that same pattern in the price action shows up, your brain will (sub-consciously) tell you “Hey, that’s a good trade, you need to jump on this.

#4 Risk Profile

This part of your trading plan is all about risk, and risk is all about the numbers (mathematics). It’s a confluence of the risk required to make a maximum amount for each trade, your risk tolerance and risk capacity.

risk profile 2ndskiesforex

There are several things which will help determine your risk profile in your trading plan, such as:

1) % risk per trade
2) max risk per day
3) max risk per month

NOTE: If you want to learn why we recommend a % risk based model, click here.

Regardless, you’ll need to know exactly what you’re risking per trade and it should be consistent. This is because you could be varying your position size, but if you increase size on your losing trades, and decrease size on your winning trades, you’re leaking your edge (losing money where you shouldn’t be).

Since you don’t know whether your next trade will be a win or a loss, you need to be risking a fixed % per trade.

I also recommend having a max risk per day so you can shut things down if you’re off for that day. This will minimize your downside when not on your game.

In terms of your max risk per month, this is the same concept as above.

Trading Tip: If you want to avoid having major draw-downs you’re unlikely to recover from, we recommend having a max risk per month <10%. For every month you have a 10%+ drawdown, you decrease your chances exponentially you won’t recover your losses by year end.

Also in your risk profile, you should be aware of your risk of ruin, which tells you mathematically a) whether your account will blow up, or b) whether you’ll mathematically make money. So critical you understand your risk of ruin.

risk of ruin table 2ndskiesforex

If you want to learn more about the risk of ruin for trading, click here.

#5 Analytics & Review

Every successful trader reviews their trading for the day. Just like an athlete reviews film from their past games to see what they could improve upon, you have to have a process for reviewing your trades each day/week/month.

A simple way to relate to this is:

“You cannot change what you cannot measure.”

(Pro football players reviewing film below)

If you don’t measure and review your trading performance in detail, you’ll continue making the same mistakes over and over again. Have you had this experience? If so, most likely you’re not reviewing and analyzing your trades and trading performance properly.

I recommend the following:

1) spend at least 15mins each day reviewing your trades for the day
2) spend at least 1hr per week reviewing your performance and execution for the week
3) spend at least 1hr per month reviewing your overall stats

What should you be reviewing?

1) charts for each and every trade, showing the price action context before the trade, along with your trades entry, SL, TP, & the result
2) how well did you execute your trading plan (were you over-trading?)
3) what was your performance (stats) for the month and how does that compare to your baseline?

By having a time to analyze and review your performance, you’re teaching your brain to spot the habits and actions which led to making successful trades, which further reinforces good trading habits.

In Closing

These are the 5 major components you’ll need for any trading plan you create. There is a lot more that could be said on the subject, but this should give you a solid framework to build your own trading plan.

In the beginning, you’ll need to do some experimenting to tease out what feels more natural for you. I recommend doing this in 3 month chunks so you don’t change your plan too often, and give it enough time to play out.

Eventually, you’ll likely need some feedback on fine tuning your forex trading business plan. This is where a forex mentor really helps, because they can see things you’ll likely be missing, and can give you actionable insights on  how to increase your profits, accuracy and performance.

Below is one of my students first quarter performance for this year whom I’m constantly helping with their trading plan.

trading analytics 2ndskiesforex profitable traders

If you’d like to learn more about our Trading Masterclass course and how we can help you build a successful trading plan, click here.

Now Your Turn

Did you learn something from this trading plan article? Notice anything lacking in your current forex trading business plan? Feel like you have a more clear idea how to build a successful forex trading plan?

Make sure to leave a comment below, and share this article on social media.

Until then, I’ll look forward to hearing from you.

Additional Resources: What if your trading plan is costing you money?