Tag Archive for: pin bar

Want to Increase Your Profitability? Try this powerful approach

If you want to find high probability trades, and skip those with a low probability of working out, you’ll need to develop a core skill. Does this sound interesting? Then keep on reading. What is this skill you ask?

I am talking about trading with price action context.

Good Trading Decisions Are Based Upon Context

First, let’s define the word ‘context’. Context = understanding and approaching a situation based upon the ‘context’ (or environmental variables) around it.

In price action, the ‘context’ is a way of describing the overall environment, and using that to help you trade with the underlying order flow. We have 3 filters to understand the price action context in our Trading Masterclass Course. For the purposes of this article, we’ll talk about impulsive and corrective moves.

Impulsive and Corrective Moves

Now I’ve already done many videos and articles on impulsive and corrective moves. For a more in-depth study, you can watch this video on impulsive and corrective price action, or this article on impulsive and corrective moves. But to sum them up briefly:

Impulsive moves = large bars + majority of bars 1 color + closes towards the highs/lows

Corrective moves = smaller bars + mix of colors + closes towards the middle

An example of an impulsive move is below:
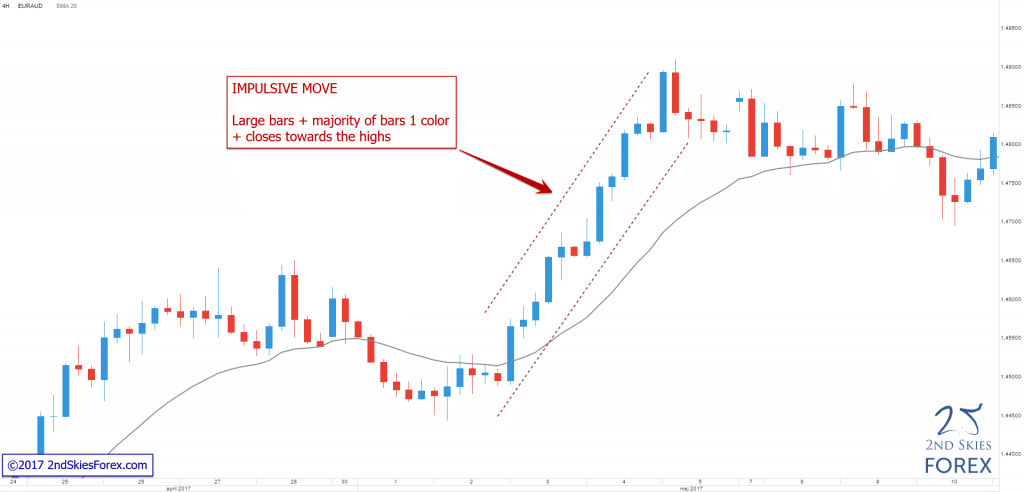
Impulsive move 2ndskiesforex

And an example of a corrective move is below:
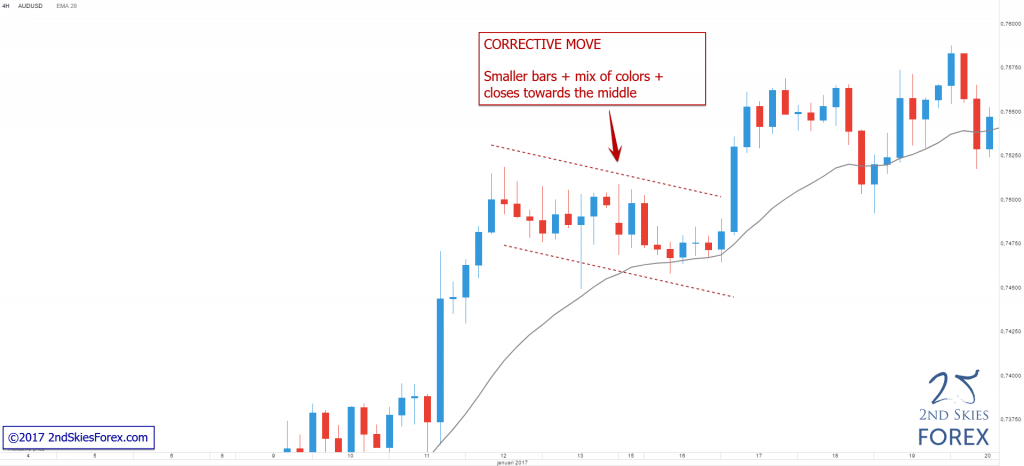
Corrective move 2ndskiesforex

As a whole, impulsive and corrective moves communicate a lot about the price action context, such as the underlying order flow behind it.

During impulsive moves, the order flow is relatively ‘imbalanced’, meaning it’s dominant towards one side (buying/selling) which causes strong directional moves.

During corrective moves, the order flow is relatively ‘balanced’, meaning there is no strong winner between the buyers/sellers, hence the market goes mostly sideways.

Using Impulsive and Corrective Moves to Discover the Price Action Context

Now that we understand the basics of impulsive and corrective moves, we can use them to discover the price action context of the market.

As a general rule, an impulsive move (the majority of the time) is followed by a corrective move. If the impulsive move is with trend, then the next move after the corrective move will more often be an impulsive move in the same direction.

Two good examples of this are below:

Example 1: Impulsive and Corrective Moves
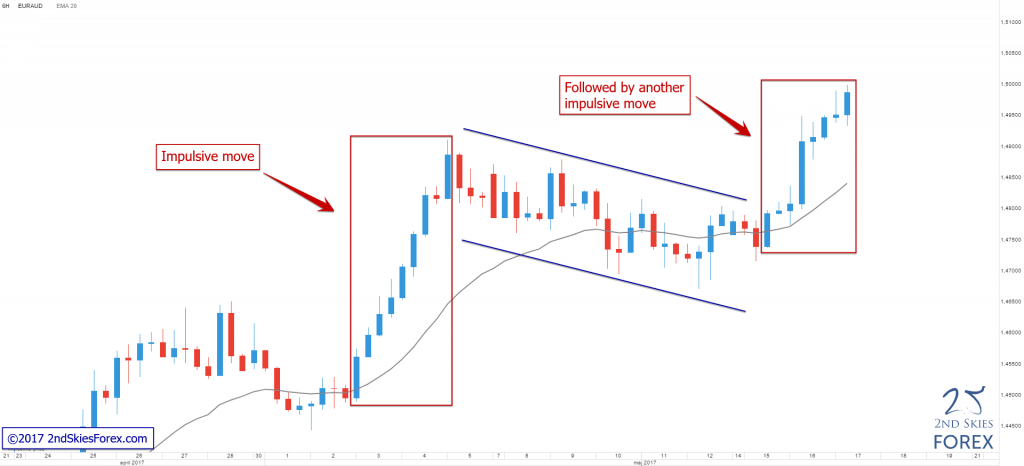
Impulsive & Corrective moves 2ndskiesforex

Example 2: Impulsive and Corrective Moves
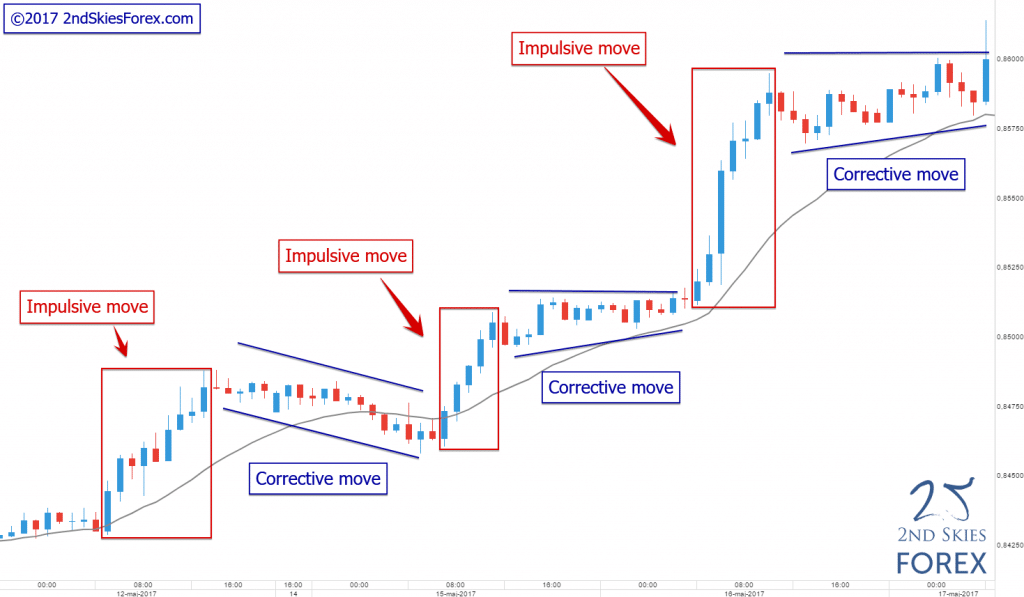
Impulsive & Corrective moves 2ndskiesforex

Now what do impulsive and corrective moves teach us about price action context?

They give us an underlying sense of what the dominant order flow is. If you see a potential trend in place, along with a good series of impulsive and corrective moves, then you can feel confident the overall price action context is bullish, and thus you should be looking to buy more often than sell.

Now instead of waiting for a pin bar, fakey or some other 1-2 bar confirmation price action signal, look at the impulsive and corrective moves for trade opportunities as they will often offer you many.

You don’t need a 1-2 bar candlestick pattern to know if the market is bullish – just determine the overall ‘context’, and trade with the impulsive and corrective structure as much as possible.

NOTE: If you want to learn how to find high probability trade setups using impulsive and corrective moves, check out our Trading Masterclass course.

The bottom line is – many of those 1-2 bar candlestick patterns (pin bars, fakey’s, inside bars, etc) don’t form that often. Yet if there is a strong trend in place, why are you waiting for a pattern that may never materialize, when the overall order flow is already bullish?

Get into that trend and make some money. Just make sure the price action context is in your favor. A great way to determine this is to make sure you can read the impulsive and corrective moves.

The most favorable situation is when you are trading in the direction of the impulsive moves (not against them) because you’re trading with the dominant order flow in the market. It also means you can make money faster because impulsive moves travel farther and faster than corrective moves.

Hopefully you can now see how price action context, particularly spotting the impulsive and corrective moves, can give help you find better trade setups.

Want To Learn More About Price Action Context?

While impulsive and corrective moves are a crucial part to determining price action context, they are not the whole. We have two other key factors to determining price action context and what the dominant order flow is in the market.

To learn more about these two, check out our Trading Masterclass Course where we teach you higher, lower and multiple time frame context with clear rules to understanding them. In fact, our entire 1st section of lessons is dedicated specifically towards understanding price action context.

To get access to these lessons within minutes, click here. Inside the course, you’ll also learn how to read other critical (or more advanced) price action structures and find more trade setups.

Keep in mind, trading with price action context is a skill that works on any instrument, time frame or environment. If you’re learning a price action strategy or approach that only works on specific time frames, then it’s a limited strategy that doesn’t really understand price action or PA context.

Until then – I look forward to your comments and feedback.

What’s Inside Today’s Trading Article?

  • Let’s talk about breakout strategies
  • What are some consistent breakout patterns?
  • When trading breakout patterns, how can I avoid false breaks?

Ever heard the statements “most breakouts fail” or “you should avoid trading breakouts“?

Let me just put the kibosh on that by sharing with you Exhibit A.

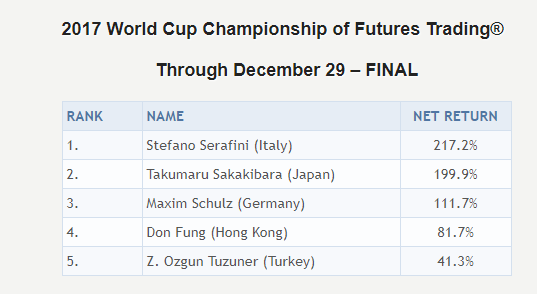
Behold…Exhibit A – winner of the 2017 World Cup Futures Championship, Stefano Serafini, who won with an impressive +217% return (see below).

stefano serafini breakout trader 2ndskiesforex

What was Stefano Serafini’s main trading strategy to generate such an impressive return? Trading intra-day breakouts!

So do me a favor, the next time you see some fake trading guru telling you “most breakouts fail” or “you should avoid trading breakouts“, please share the link to this post.

For today’s article, I’m going to share with you two breakout strategies to help increase your accuracy & profitability in trading breakouts. I’m also going to share how you can use this to avoid any false breaks and getting stopped out.

Let’s jump in.

Breakout Strategies

While there are many types of breakout strategies you can classify breakout trades into two broad categories:

  1. The momentum breakout setup
  2. The breakout pullback setup

For today’s breakout trade article, we’re going to focus on the second breakout strategy (breakout pullback setup) as it’s much easier for traders to learn and execute because it requires less skill.

NOTE: If you want to learn how to trade momentum breakout setups, then check out my Trading Masterclass course where I teach you how to trade this for maximum profit.

The Breakout Pullback Setup

Before you can even make a breakout pullback setup, you’ll need to identify some of the consistent breakout patterns that manifest in the price action.

By learning these, you’ll be able to identify A+ setups which will increase your accuracy and profitability in trading them.

There are many things you can do to identify an A+ breakout pullback setup, but there are 2 things I’ll give you to work with for now.

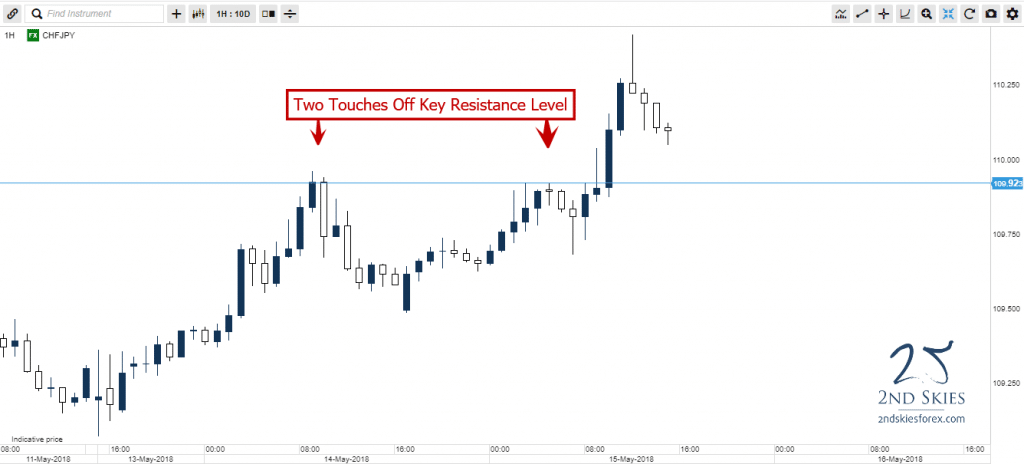
Breakout Pattern #1 – Finding a key support or resistance level with a minimum of two touches

Why two touches?

While the market may hit a key support or resistance level once, which indicates at least some potential order flow and institutional players wanting to hold that level, two touches indicates a greater probability and amount of order flow behind that level.

trading forex breakouts 2 touches 2ndskiesforex

The more buyers/sellers you have at that level, the greater the chance the breakout trade will succeed.

Why?

One reason is those same players who, when they get stopped out after their support or resistance level is broken, them getting stopped out clears out some of the order flow against that breakout, thus making it easier for the breakout to continue.

On top of this, smart money players after they’ve been taken out (and spot a good breakout) will often flip sides after they get stopped out, thus providing further momentum to your breakout trade.

Hence it’s important to identify a level that has a minimum of two touches (the more, then better) to increase your probability of a breakout setup forming.

Breakout Pattern #2 – A reduction in the reactions (or pullbacks from that support/resistance level)

Why does a reduction in the pullback from a key support or resistance level help your breakout trades?

Let’s say the market is in a bull trend and it’s encountering a resistance level where there are likely bears with offers up at that level. If the bulls hit the resistance level the first time, and the market pulls back say 50 pips, then when the 2nd time the price action hits that resistance level, the market only pulls back say 25 pips, this indicates a weaker reaction by the bears at the level.

A weaker pullback from the bears = less order flow and strength on their side. As their side continues to weaken, this a) gives the bulls more confidence a breakout is becoming more likely, and b) communicates their side is losing the battle.

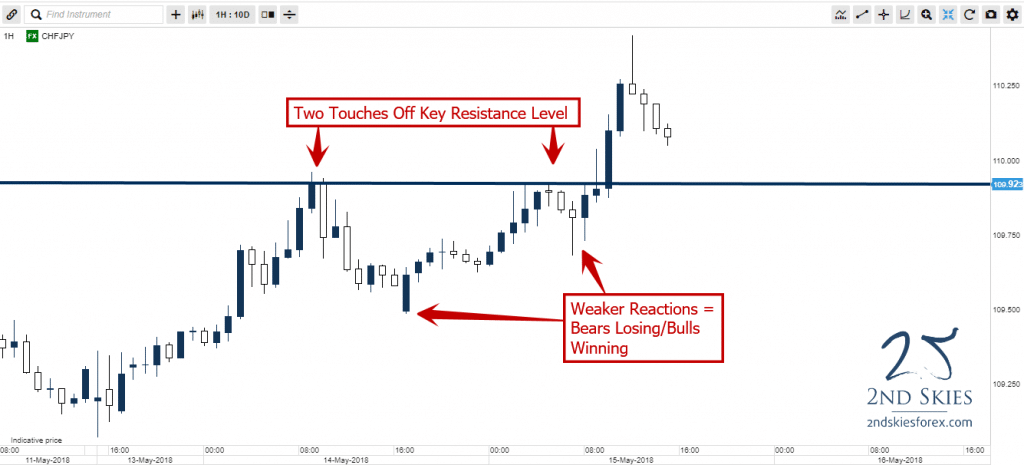
Looking at our prior chart, notice how the reactions/pullbacks to the resistance level were weaker the 2nd time around?

trading forex breakouts two touches 2ndskiesforex

Those weaker reactions were communicating how the bears were less able to push back while the bulls kept their foot on the gas, producing an eventual breakout.

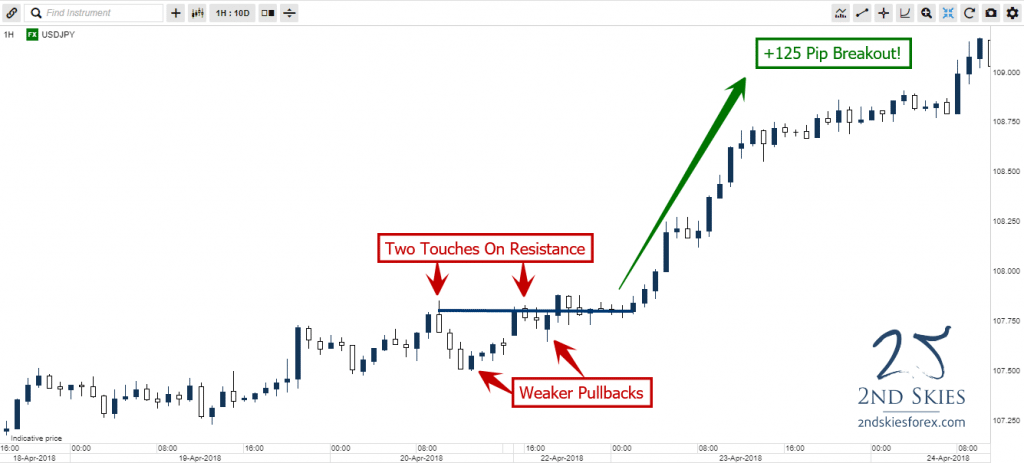
Below is another good example of the two touches + weaker reactions to the resistance level on the USDJPY, producing a +125 pip breakout.

forex breakout setups 2ndskiesforex

Hence, make sure to look for weaker reactions each time off a key support or resistance level to identify a high probability breakout.

Key Tip: One additional pattern you can apply in the price action is to look for breakout setups that are forming with trend vs counter trend.

Now that I’ve shown you two underlying components of a breakout strategy, let’s talk about how you can get in on a breakout pullback setup.

The Breakout Pullback Setup

Assuming you’ve found a situation whereby you have the minimum two touches off a key support or resistance level, along with weaker reactions to the level each time, let’s talk about how you can get into a breakout pullback setup and how I trade it.

Once the market and price action has closed above your key support or resistance level, I’ll place a limit order on that particular support or resistance level to trade in the direction of the breakout.

NOTE: I am not waiting for a confirmation price action signal to form on that level. If you’ve read the price action context correctly, and found a legitimate breakout, any confirmation price action signal will only give you a weaker entry, and thus reduce your profitability.

If you learn to read the price action correctly, you won’t need any confirmation price action signal to get in the market, because the underlying order flow from the big players will already be there.

When I’m trading a breakout pullback setup, once I’ve qualified the breakout, I’m placing my order to get long/short on a pullback to the level.

If the order flow at that level is legit, there will be larger players willing to get long/short at that level without the need for any pin bar, inside bar or ridiculous tailed bar.

Case in point, watch this video on me doing a live breakout pullback trade on the NZDUSD for +100 pips of profit with only a 29 pip stop loss.

Notice how there were two touches on the support level near 6625, along with each bounce getting weaker. Once the market broke through the level, I placed my order to get short.

After pulling back to my level, and barely going negative, the pair took off for over +100 pips of profit.

Had you waited for any confirmation price action pin bar signal, you would have a) gotten a worse entry, and b) had less profit potential.

You can see another example of a live trade using a pyramiding trading strategy where I get in on the breakout pullback setup to the level on both trades, stacking onto the same with trend move for extra profit.

After watching the two videos, hopefully these examples give you a good idea of how to trade the breakout pullback setup.

How to Avoid False Breaks?

There is a lot that can be said about avoiding false breaks when trading the breakout pullback setup, and there are many breakout patterns that often fail.

false breakout patterns

To keep it simple, the best thing you can do is:

a) learn to read price action context, and

b) trade with trend as much as possible

By learning to read price action context, you’ll have a better grasp at finding key support and resistance levels where there is a lot of order flow around that level. You’ll also be better able to spot with trend environments, which are much more favorable for breakout trade setups. This is because there is a greater amount of order flow in your favor to support your trade.

In Summary

To recap, trading forex breakout patterns can be a highly profitable trading strategy when you learn to identify A+ breakout setups. There are two classifications of breakouts, which are a) the momentum breakout setup, and b) the breakout pullback setup.

There are also key breakout patterns you can spot in the price action which will help you find higher probability breakout trades.

In the beginning, try to trade breakout pullback setups as they require less skills, and will help you build your confidence in trading breakouts over time.

Lastly, when trading the breakout pullback setup, make sure NOT to wait for confirmation price action signals as they’ll give you a worse entry (trade location) and reduce your profitability.

Now Your Turn

What did you learn from this article that helped you with trading breakouts in the forex market (or any market for that matter)?

Did you find this useful and give you some increased confidence to trade breakouts?

Are you currently trading breakouts and struggling?

Please make sure to leave your feedback and comments to help us create better trading articles and content for you.

Until then, may good trading setups and karma be with you.

Kind Regards,
Chris Capre

This is part 3 of a 4 part series. Listen to the last one here: Don’t Fight or Trade Like This, or if you missed the previous one, checkout The Blind Entry (How It Will Leave You Trading Blind)

I’ve shown over the last few content pieces how the idea of confirmation in price action is an illusion. This video demonstrates that when retail traders are getting in the market, professional traders are already in profit.

Here’s the transcript for the video:

“Hello, traders here.

Chris Capre, 2ndskiestrading.com.

So I’ve recently shown over the last few content pieces how the idea of confirmation in price action is an illusion and it’s not what professional traders are looking to enter the market.

I’ve also shown how entering on a 50% retrace tweak entry on a pin bar is a sub-optimal or retail entry.

I think it can be easily said that when retail traders are getting in the market, professional traders are already in profit.

This video further demonstrates this about the pin bar entries, such as the 50% retrace entry, or the sell on break being also a retail or sub-optimal entry.

Now, I’m going to use an example here from a live trade I’m in right now and this is one that I’ve discussed in my members trade setups commentary in the price action course.

So, I sold right at this resistance level.

I felt like we’re still in a range type structure and that if the market protruded up to this resistance right over here, that sellers or offers would enter the market and push the pair back down.

And that is exactly what happened. So I got in at 1.4975 and literally it was about 6 pips off the intraday high.

And so I put a stop just above these little wicks right over here, particularly this one here, which left me with a 30 pip stop.

Now, I’d like to compare this entry versus the 50% retrace entry or sell on break so that you can see the differences.

Now, going to another chart here, first off using the 50% pullback entry here, you would’ve missed this trade completely.

So according to the faux authorities on price action, particularly Nial Fuller, the next entry would be the sell on a break of the lows here.

In fact, pretty much every other person who teaches the cut and paste or carbon copy version of price action that you see out there, especially around the pin bar, would all say you either sell on a retrace or you sell on a break of the lows.

Now, this gives you a much worse entry, and about as late or a retail entry as you could possibly get. So that puts you in at about 1.4943, roughly.

Now, assuming in most cases we’re going to have the same stop, just above this here, most of the time we’re gonna have the same stop on the same type of entry.

You are going to need a 70 pip stop compared to my 30 pip stop which is at 1.5003. So you need 70 pips, I have 30.

Now, just from a risk to reward perspective, when you are hitting +70 pips or +1R which would put you at 1.4863, that’s right about… that’s actually below the intraday lows.

So this right here is your intraday, that would be your +70 pips or your +1R.

When you are hitting your first +1R, my entry at 1.4975 is up already 112 pips, is at +4R. So now the moment you’re getting your first R, I’m already up 4 times that.

In fact, by the time your entry in the market right here at 1.4933 which is a pretty razor sharp entry if you’re selling on break, I’m already up +40 pips from my 1.4975 entry. Or in this case, +1.33R.

Again, coming back to the perspective that it is

“more often a professional is already in profit when a retail trader is entering the market”

you can see the differences quite clear here between the two entries.

But let’s play a little fantasy here. Let’s say that the market pulled back magically to your 50% level perfectly.

Let’s say you got the absolute highest uptick on the pullback. The best possible entry in the trade. It just happened to go there. That would be 1.4958.

Now, again, assuming most of the time we will have the same stop loss placement, your stop loss is 47 pips if you put it at 1.5003 whereas mine is still 30.

So when you are hitting your first +1R at 1.4910 which is right about here, there, so when you’re hitting your first +1R, at 1.4910, I’m already up 65 pips or +2.16R.

So, with that being said, it should be very clear, especially with all the other content I’ve posted before this, it should be very very clear the differences between a professional trader’s entry and a retail entry, especially being offered by the faux authorities on price action.

If you want to continue to have sub-optimal retail entries, then you can use the 50% retrace entry.

But if you want an entry location that gives you better accuracy and a higher +R per trade, many times double the +R available, then you’ll want to adjust your entry method.

And this is what I teach in my price action course, particularly how to get plus high R trades like this.

Now, if you found this video lesson useful, please make sure to like, share and tweet it below, and I’d love to hear from you what “a-ha” moments you have from this video.

So please come over to see this video on my website as well at 2ndskiestrading.com where all the discussion is happening and leave your comments there.

But thank you for watching this video, again my name is Chris Capre at 2ndskiestrading.com, where I teach you how to increase the way you trade, think and perform.”

Now that you’ve seen the video and had a chance to analyze the two methods and how they perform differently, which one wins?

What do you think? Please share and comment below.

This is part 3 of a 4 part series. Listen to the next one here: Don’t Fight or Trade Like This, or if you missed the last one, checkout The Blind Entry (How It Will Leave You Trading Blind)

albert einstein not following the crowd
This article is going to be a tad ‘controversial‘ to many developing traders out there. It is not meant to be negative in tone or start arguments.
It is to get you to question what you’ve been told about price actionIt is to open up a dialogue, about another way of approaching PA beyond the typical narrative.
The general price action story spun out there goes something like this;
To make any buying/selling decisions and pulling the trigger, it ultimately comes down to one final piece of the puzzle.
This final piece comes in the form of a ‘confirmation price action signal‘. And said ‘signals’ only arise in the form of a 1 or 2 bar combination.
They come in many names, such as pin bars, inside bars, fakey/false break setups, or engulfing bars.
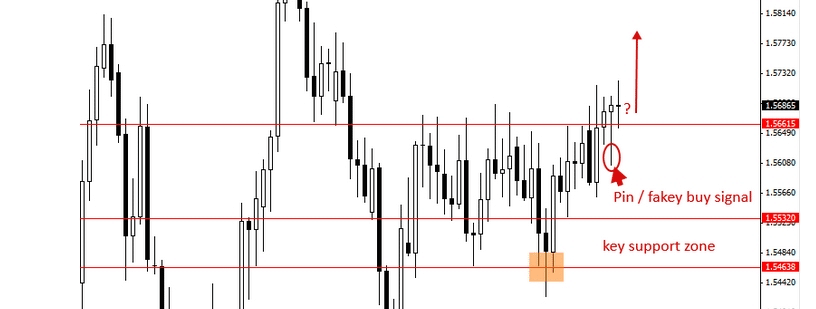
pin bar fakey price action signal failed
And the follow up to this magical fakey pin bar signal…
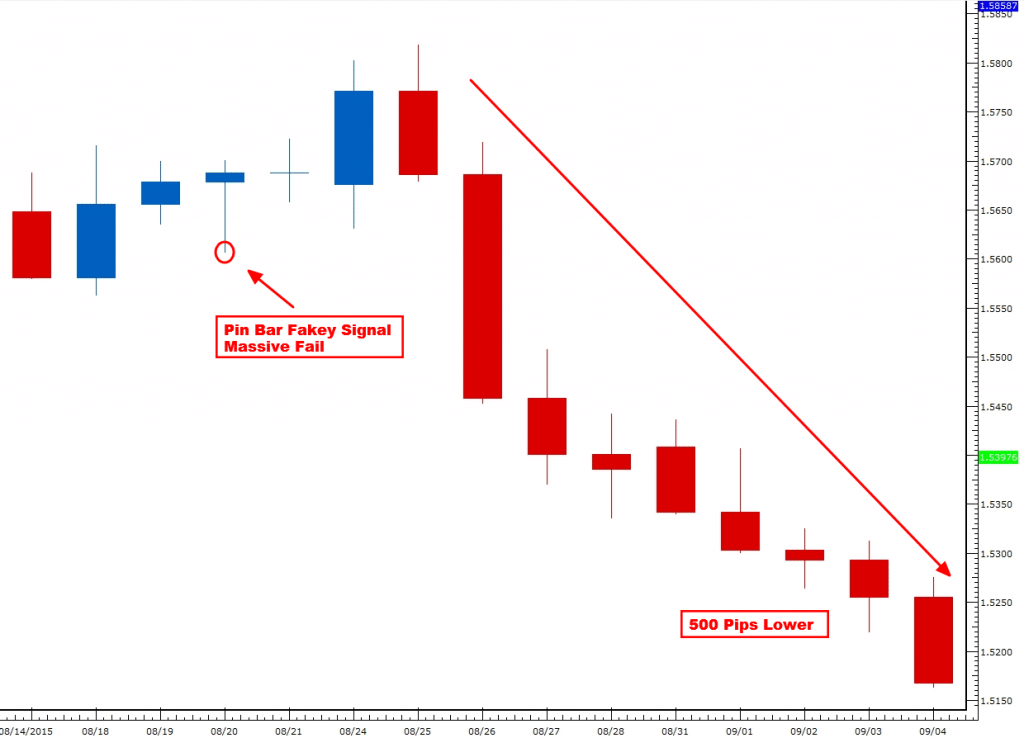
pin bar fakey price action signal failed 2ndskiesforex
Regardless of the name, the idea is the same. You should not enter the market till you see one of these famed 1-2 bar price action patterns.
Thus far, everyone spinning this narrative are derivatives. What do I mean by this?
Those who preach confirmation price action signals, copied all they knew (with minor adjustments) from someone else.
Many of them were students of one individual (Nial Fuller). A little investigation will reveal Nial Fuller’s price action strategies are also derivatives.
He was a member of J16 and copied all he knew from there, again with only minor adjustments.
If you look at most of the price action mentors, you’ll see the overwhelming similarity & repetition. Now you know why the narrative around PA sounds the same.
Essentially, they are either a derivative (copy) or a derivative of a derivative (copy of a copy). What you’ll also notice is none (or almost none) of them have institutional experience.
What’s really being sold here is a ‘green light buy/red light sell‘ methodology. It’s targeting easy prey who don’t want to do the work, who want understanding price action to be easy, who want to be lazy traders (in their own words).
Yes, with just three simple setups that are easy to find, you too can make profitable buying and selling decisions! Or so you are told…
The reality is far different from this (especially in institutions and hedge funds). By the end of this article, I’m guessing you’ll start to see why.
Below are my 5 reasons why hedge funds don’t trade confirmation price action signals.
 

Reason #1: Paying 5-6 figures To Train Their Traders?

smb training
photo: smbtraining.com (does it look like he’s sitting there just waiting for daily pin bars to form???)
The skill and time required to identify pin bars, inside bars, fakey’s and engulfing bars is minimal (a few months max). Shoot, you can even build an algo to do this for a few hundred dollars.
Bank traders on average will make 2000-4000 trades before they can trade the bank’s money. Hedge funds will also spend large amounts of money and time either training or finding talented traders.
If trading is as simple as finding these three patterns to enter the market, why spend so much to find/train traders what a $300 algo could do?
There is a reason for this.
Because reading and trading PA goes beyond confirmation price action signals. Because buying and selling decisions aren’t as simple as these 1 and 2 bar patterns.
If they were, there would never be the need for such expensive and exhaustive training programs. Would you ever spend that much training someone to trade daily pin bars?
My guess is no.
 

Reason #2 Macro + Technical

prop tradinng firms
 
If a fund is not trading algorithmically, most likely they are incorporating a combo of macro (read fundamental) + technical analysis.
I talked about this in my article Book Review: Cultures of Expertise in the Forex Trading Markets. The author (Leon Wansleben) is a sociologist who followed forex traders at a top-10 German bank desk for over a year.
Never once are the words ‘pin bar’, ‘engulfing bar’, ‘inside bar’ or ‘fakey’ mentioned in the book.
What you do find is traders working a combination of macro/fundamentals + technical analysis into how they trade.
They also discount the ‘lower time frames are noise‘ meme pretty quickly. Why?
Because most bank traders have to be reading the intra-day price action (due to flow trades, which accounts for about 70% of their trades).
By the end of the book, you realize entering the market goes way beyond pin bars, engulfing bars and inside bars. You realize they aren’t even trading those to make their buying and selling decisions.
 

Reason #3 Confirmation Decreases Accuracy and Profitability

 
“I was in (insert derivative name here) price action course and quickly realized how weak it is compared to yours. 
I’ve made over 20% in the last few months using your methods. I’m glad you poked giant holes in his price action strategies. 
Otherwise I’d still be waiting for pin bars and inside bars, missing hundreds of pips.
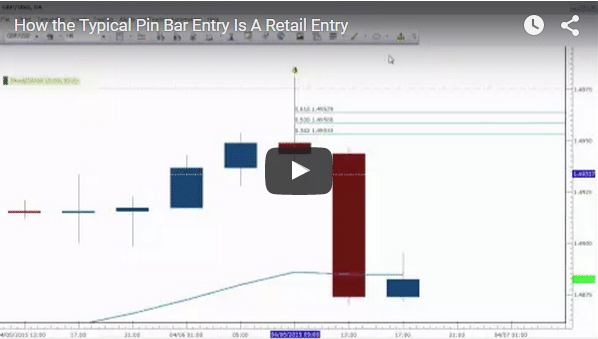
After posting my video How A Typical Pin Bar Entry Is A Retail One, many struggling traders started to see price action differently.
They realized how many times they were sitting on the sidelines doing nothing when others were making money. They also realized how waiting for ‘confirmation signals’ decreased their accuracy and profitability.
To learn why this is the case, watch my video below.
pin bar entry is a retail entry


Reason #4 Waiting for Confirmation Price Action Signals is Passive Trading

 
Hedge funds and bank traders are (if anything) passive when it comes to entering the markets.
Institutional traders would not (and could not) be making trading decisions once a daily pin bar has formed.
If they were doing this so consistently, they’d be picked off by HFT’s or predatorial funds who could see their entries a mile away.
This is on top of the fact they’d all be competing for the same liquidity and relative price, which would only mean a worse entry and lesser profits on the same trading idea.
A little investigation into how predictable these entries are will change your perspective on trading.
 

#5 The Pepsi Challenge

pepsi challenge
Ok, let’s say you are a devout believer the real way to trade price action is via confirmation price action signals.
Let’s say the above 4 reasons didn’t convince you. We can simplify this through a pretty simple test – The Pepsi Challenge.
Your challenge, should you choose to accept:
Walk into a dozen or two hedge fund offices, bank trading desks and prop trading firms. Then ask them these two simple questions:
 
1) If you don’t see a daily pin bar, engulfing bar, or inside bar, are you staying out of the market?
2) If you do see a daily pin bar, engulfing bar, or inside bar, are you loading up on your position even more than usual?
 
I’m willing to bet the answers to the above questions will be a resounding NO.
More likely, you’ll get several laughs, along with someone perhaps escorting you out of the office.
 

To Date

waiting 2ndskiesforex
As it stands right now, nobody has taken me up on this litmus test (let alone proven otherwise). I’m still waiting as I posted this challenge many months ago.
I am confident(while open to being wrong) that after you take this test, you’ll look at price action differently.
Once you let go of the current narrative, you’ll be forced to examine how order flow and the balance/imbalance between buyers and sellers is reflected in the price action. You’ll begin to see how liquidity impacts the PA and volatility.
And you’ll start to trade contextually, meaning through the price action context.
That is when your real training in PA begins, when you let go of the freshman narrative. You’ll also realize trading those 1-2 bar patterns does not build your trading skills.
If trading pin bars really built PA trading skills, then bank traders would be going through thousands of reps on those alone.
It takes no skill to find those signals and spend your time looking for them. And doing so discounts all the other candles in the process.
 

About All Those Other Candles…

 
All those other candles is what forms a structure. This ‘structure’ is (by and large) a representation of the order flow.
The order flow gets reflected in the PA, and this PA forms the price action context.
This is where your study should be.
 

In Conclusion

 
Looking for 1-2 bar patterns doesn’t make you a price action trader. It makes you candlestick trader, and that is a different approach to the markets.
When you investigate it, hedge funds aren’t trading via confirmation price action signals. And when you stop waiting for confirmation, you’ll find yourself getting better trade locations and higher + R per trade.
Looking at the market contextually will change your mindset. You’ll start trading and thinking in probabilities.
You’ll also discover how waiting for confirmation is a retail traders mindset.
With all that being said, do you agree or disagree with these forex confirmation price action trading misconceptions? Can you see how hedge funds aren’t trading price action signals this way?
Even if you don’t agree, please do comment and share below (in a non-negative tone por favor).
Regardless, I’m hoping you’ll really open up to other ways at trading price action.
Until then – may good health, trading profits and success be with you.

This is part 4 of a 4 part series. Read the previous entry here: How the Typical Pin Bar Entry Is A Retail Entry

Here’s the transcription for the audio (Bringing a Knife to A Gun Fight)

“So pretty much every ‘guru’ who teaches price action teaches the same derivative, carbon copy, cut-and-paste method of trading price action.

That you need ‘confirmation‘, and the confirmation comes in 3-4 patterns such as a pin bar, engulfing bar, inside bar or whatever bar.

In this recording I’m going to put that perspective of price action into a different light.

And when you see it in that light, you’ll realize how ridiculous the other version is.

Imagine you walk into a martial arts studio, and the ‘guru’ is saying, “oh yeah, I can teach you how to be a martial artist and survive a fight.”

And they say, “ok, here is my martial arts…whether you are in a street fight or competition, you only need these 4 kicks to survive and win the fight.

“This is all you really need to use to fight. Now to use these 3-4 kicks, you’ll need ‘confirmationthat you should use the kick.

This confirmation comes when the person you are fighting is standing in front of you and not moving.

They don’t keep their hands up and their head is out. If you have all of these things in plae, then you’ll have ‘confirmation‘ that you can throw these 3-4 kicks.

But if you don’t have these, well, then you must stand there. In fact you shouldn’t do anything. You should just sit there and wait till the person you are fighting does what I said above

That is all you will ever need to win a fight by using these 3-4 kicks. And this is the only way you should attack. Barring that, you don’t want to do anything.”

Now ask yourself, if you walked into a martial arts studio, and the ‘guru’ there told you this, what would you think? Would you really think this is a way to fight or train in martial arts?

Of course not, and it’s the same for trading.

Yet anyone teaching the idea of confirmation via a pin bar, engulfing bar or inside bar, is pretty much teaching exactly that.

They all say if you don’t see these things, you should do nothing. Some even say walk away from the markets.

How ridiculous is this idea, that you should only spend your time looking for these things to enter and engage the market, and if these 3-4 kicks are not there, just stand there and do nothing.

I’m guessing by now you are seeing the insanity of this.

Yet this description above pretty much describes every price action, carbon copy, cut-and-paste guy out there, whether it be Nial Fuller, Jonathan Fox, or any other derivative.

And they are all derivatives of J16, which Nial used to be a member of before he went off thinking ‘I can do this same thing‘ and went and created his course, which is his own derivative version of it.

Since then, it’s only produced weaker and weaker derivatives. Very much like inbreeding weakens the genes, it’s the same with this version of price action being described.

And it’s weakening your understanding of price action.

You have to get beyond this, you have to get beyond the 3-4 kicks to win a fight type of price action out there. This is taught in the form of ‘confirmation’, and its not the kind of trader, or martial artist you want to be.”


This is part 4 of a 4 part series on the confirmation myth and how it reduces your profit and accuracy. Read the previous entry here: How the Typical Pin Bar Entry Is A Retail Entry

This is part 1 of a 4 part forex price action strategy series. Read the next one here: The Blind Entry (How It Will Leave You Trading Blind)

I can always tell where people are in the trading process based on how they speak about confirmation. Why is that? Watch, and find out!

Here’s the transcription for the video:

“There’s a really big misunderstanding about confirmation.

When I hear people talk about confirmation and how they talk about confirmation, I can always tell where people are in the trading process based on how they speak about confirmation. Why is that?

Because there’s been this proliferated idea in the trading education world that to trade a setup or trend or something like that you need this thing called confirmation and the confirmation comes in the form of a pin bar, an engulfing bar, an inside bar or whatever.

So that’s the general idea that’s out there when it comes to trading price action.

The thing is, is that when I hear somebody talk about price action in this way, I know exactly what level of trader they are and what level of trader they’re not, because how somebody speaks about confirmation is very indicative of where they are in their trading process.

If a trader is looking for confirmation that a trade will work and they’re doing this because they’re saying “ok, we gotta wait for a price action confirmation signal from support or resistance“.

Well, where does this idea and need for confirmation come from? It comes from a beginner’s understanding of trading.

Why is that?

Because beginning traders are looking for certainty in the market. They’re looking for solidarity, they’re looking for something really really potent that says “I need confirmation”.

The reason why they need confirmation is because they don’t trust price action, they don’t trust their skillset.

They don’t trust trading as a whole. They don’t trust trading with trends, they don’t trust reversals. They don’t trust support and resistance, they don’t trust price action as a whole.

In the beginning, traders want solidarity, they want certainty. And because of that, they’re looking for confirmation in the form of a pin bar or something like that.

The pin bar ‘confirms’ that this trend is going to continue.

The thing about it i,s is that this is something that professional traders have let go of that a long time ago. And they have to let go of it to become a professional trader.

The reason why that is, is because that idea of certainty, of confirmation and the way that a beginning trader is looking for it, that wanting things to be really certain, that A++ setup.

Where that comes from is a beginning understanding of trading.

“Professional traders don’t look for certainty, because they’ve realized it’s an illusion.”

What professional traders are looking at, which is a different perspective, is trading and thinking probability.

So if you hear somebody talking about confirmation, “we wanna trade with the downtrend and we’re gonna wait for a pullback towards resistance and a pin bar off that resistance as confirmation that the trend is still in play and we can trade it“.

How many have heard that story before?

The reason why you’ve been told that is because the people who are teaching that aren’t trading professionally.

If they were you would know this, and all professional traders would know this because professionals aren’t looking for confirmation signals via a pin bar.

So if you hear somebody talking about that, you know where they are in terms of their level of trading.

They’re still a beginning trader themselves, and if you think about it, if somebody is talking about an A++ setup or they’re saying “hey, we’re waiting for a pin bar from resistance for confirmation“, besides the fact that I would suggest running from them as far as possible, because they’re still beginning traders.

You have to ask yourself “look, if you’re only willing to wait for a pin bar or an inside bar, or a false break, if you’re only willing to wait for those signals before you enter the market, well then you really don’t trust price action, do you?”

You don’t trust trends, you don’t trust price action context, impulsive vs. corrective, volatile vs. non-volatile trends, you don’t trust support and resistance, you don’t trust your own ability to trade.

You have to wait for all these other things to be in place and then this one final supposedly magical pattern and supposedly there’s only like 3 of them, which is amazing to me that this idea is actually out there, that there’s only 3 possible ways that the market is telling you a trend’s going to continue.

I don’t know about you but that seems kind of absurd to me. It seems a little insane to think that a market that is so complex, across so many players, across trends that continue.

Confirmation via a pinbar is an illusion, it’s a beginning way to look at trading.

So, your job as a professional trader… you know you’ve kinda crossed the Rubicon and made a big leap in your trading when you look at trading in terms of probabilities, not confirmation in the ordinary sense.

Confirmation, the way it’s normally talked about is a very dubious notion. It’s a very slippery idea that doesn’t really exist in the way you think it does.

If you’re constantly looking for those things you’re going to miss thousands and thousands of pips in a trend that is already well-esablished.

If you’re looking for confirmation, you won’t be able to make this trade and this trade and this trade and this trade. And that’s… what is that? +240-250 pips?

In a period of, what, 3 days? On one pair? You won’t be able to do that.”

This is part 1 of a 4 part series. Read the next one here: The Blind Entry (How It Will Leave You Trading Blind)

Have you been trading price action via ‘confirmation’? If so, I want to hear from you and what you see as the difference, so please make sure to comment below.

Was this article helpful? Please make sure to like, share and tweet it below to anyone you think can benefit from this.

Key Talking Points:

  1. False Breaks Offer Great With Trend Trade Setups
  2. Trading the False Break with Pin Bars
  3. Trading the False Break with Engulfing Bars

In my prior article on trading the false break strategy part 1, I shared the basic definition of a false break, covered what is the price action and order flow behind false breaks, and how we can trade them.

In this false break forex trade strategy article, I will discuss how you can trade them using pin bars and engulfing bars, along with entry, SL and TP techniques.

To Recap What A False Break Is
I generally define a false break as one of the two following scenarios:

  1. A break above/below a prior candle that fails to close above/below that candle
  2. A break above/below a key level, quickly reversing that level, and sparking a counter-trend move

Below is another example of a false break:
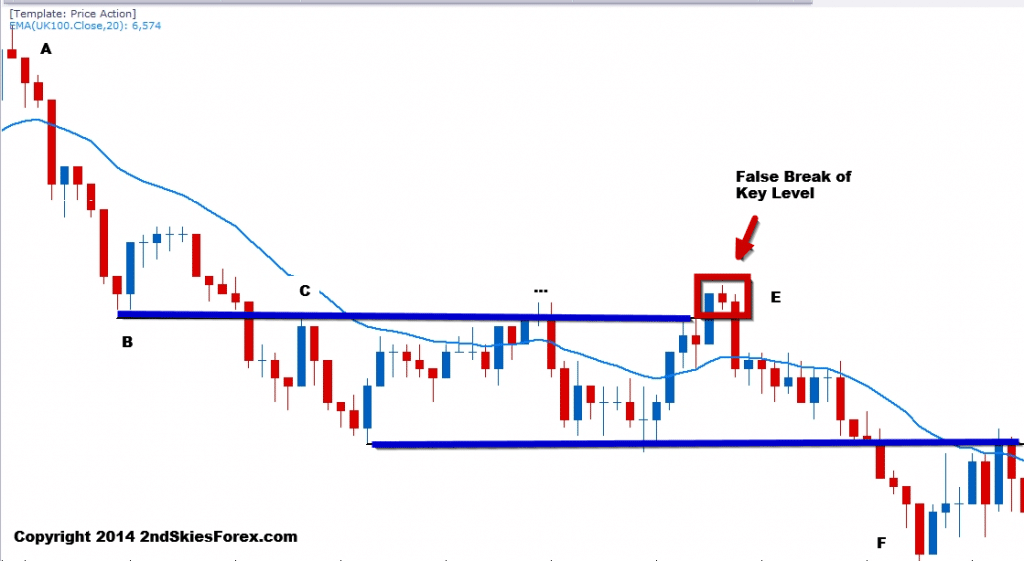
forex price action false break strategy 2ndskies c2

Looking at the chart above, we can see a clear downtrend, starting with A in the top left of the chart. The sell-off finds support at B, which eventually becomes a role reversal level at C.

Further along at E, we can see the textbook false break setup, just like we defined in the prior article. The pair breaks up above the key level CT (counter-trend), stalls, then sells off again breaking back below, and offering a great false break setup.

This sell off heads all the way down to F for a nicely profitable trade, and is a great example of a false break setup.

Now we will discuss how to trade the false break setup with a pin bar.

The Pin Bar + False Break Setup
Another type of false break setup is using the pin bar reversal pattern. In many ways, the pin bar by itself, can be a type of ‘false break’.

This is true if the body of the pin bar itself is housed within the prior bar. The breaking above/below the prior bar, and then closing back within that bar, is in and of itself, a type of false break.

What we are going to discuss is how we can use this to trade the false break strategy in combination with the pin bar.

A Pin Bar + False Break Example
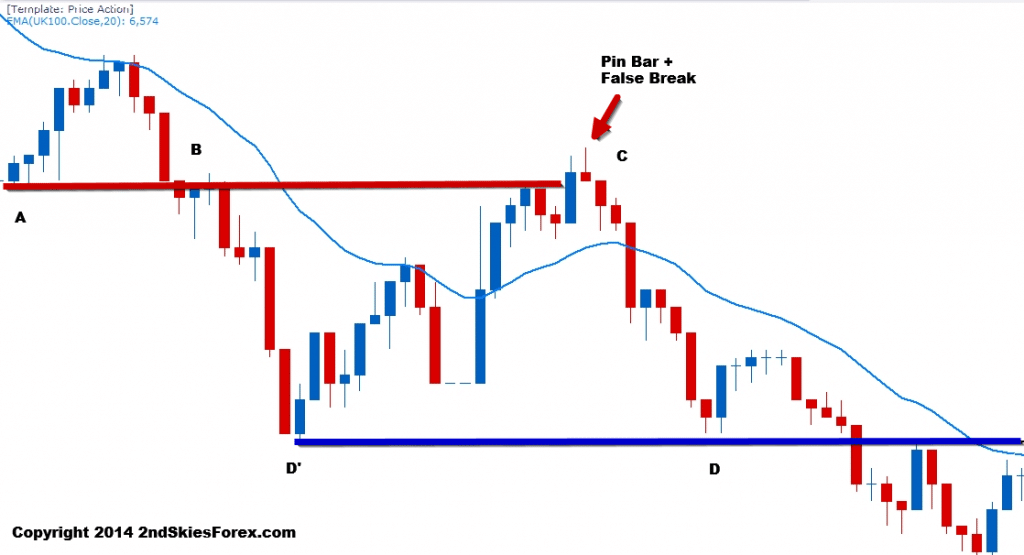
false break pin bar price action 2ndskiesforex c1

In this chart above, we can see at A (top left), there is a bullish move to the dynamic resistance (20 EMA). The sell off from the dynamic resistance to B only takes 3 bars, which means it was over 2.5x faster then the buying pressure at A.

From an order flow perspective, the sellers are stronger, since it took them less time to cover the same distance.

After breaking below the support level at B, the pair bounces at D’ towards C, (very same support level at A), hence a role reversal level.

Now notice at C how the pair briefly broke above A. If the buyers were really in control, they would have kept pushing prices. But the pin bar formed a false break above the highs of the blue bar (or prior bar).

This breaking above then back below, suggested a likely false break and more selling. The pair sold off from C to D, re-affirming the pin bar + false break setup.

NOTE: Observe how the support level at D and D’ formed another role reversal setup just after? This is a great example of trading with the trend.

Entry, Stop & Limit
If the pin bar represents a real false break, then the with trend direction should continue. Assuming I have read the price action context correctly, I generally like to enter using one of two methods:

  1. On a few pip break back below/above the key level
  2. On a pullback setup to the key level

The first entry method (more aggressive), can protect you from missing the move, as sometimes the false break never offers a second chance to enter.

For those wanting more ‘confirmation’, then I’d recommend the second entry method.

Now assuming the pin bar is the high/low in the move, I’ll put my stop just above/below the pin bar. For my take profit, if there is a prior level which caused the bounce/sell-off leading into the pin bar, then I’ll target that. One can use that as the only target, or as a first TP holding for a deeper move.

Trading the Engulfing Bar + False Break Setup
In reality, the engulfing bar + false break setup is not much different from the pin bar false break. I am still wanting to trade them with trend as much as possible, looking for a false break followed by an engulfing bar.

An Engulfing Bar + False Break Example
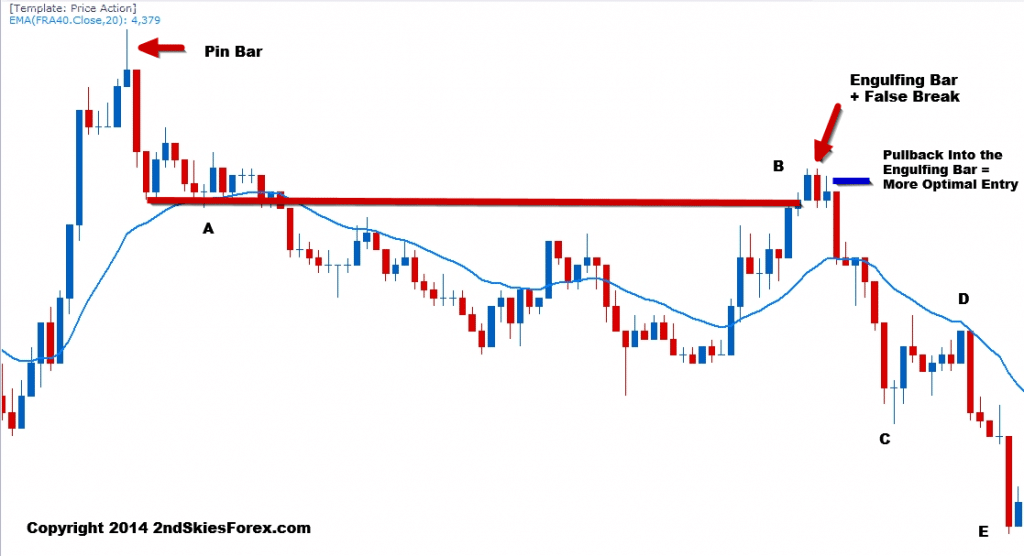
engulfing bar false break price action 2ndskiesforex c3

Turning to the chart above, we can see the strong selling stops at A. This forms a price action squeeze, which leads to a breakout and further selling.

The pair pulls back to B (the support level at A), and forms a false break. This is immediately followed by an engulfing bar.

Now ask yourself, if the bulls were truly in control, why did the price action immediately reverse after taking out A? This should have been a clue to watch for a false break.

You’ll notice right after the engulfing bar was an inverted pin bar. This is a failed attempt to rally, suggesting the buyers tried to push higher, but failed. What results is heavy selling from the open of the next bar down to C, and eventually E, resulting in a nice profit.

NOTE: Take a look at the move from C – D. This is a corrective pullback following an impulsive move. The corrective pullback went into the dynamic resistance (2o EMA), and then sold off heavily after.

This would have represented a great pullback setup, and is a good example of how impulsive and corrective moves manifest.

impulsive and corrective price action 2ndskiesforex
Entry, SL & TP
The entry, stop loss and take profit techniques are the same as the pin bar + false break. The only variation, would be if the engulfing bar closes back below/above the key level.

If it does, I’ll look to take a pullback into the engulfing bar, which is far more optimal entry as a whole. For more information on why the pullback is a more optimal entry for the engulfing bar, click here.

To Recap
In today’s false break forex trade strategy article, I talked about how false breaks offer great with trend setups. I then went into two more examples of the false break strategy, showing how you can trade them with pin bars and engulfing bars.

I shared entry, SL and TP techniques, along with explaining the price action and order flow behind these great setups.

These are just a few of the false break techniques available. If you want to learn more about trading the false break, along with other forex trading strategies, you can read more about my Price Action Course & Daily Members Commentary here.

Recently I got a question from a newer student asking the following;
“Right now I’m short this pair. It’s in profit, but it just formed a pin bar against my trade before I hit my profit target. What should I do?”
This is a common question I get about what to do when you see a price action signal that is counter to your trade. The question by itself actually tells me a lot about the student and where they are at in their process (beginning, middle or more advanced).
My response was similar to the following;
“It is important to understand we are not pattern traders. We are price action traders. Being a pattern trader, as in trading pin bars, inside bars, engulfing bars, or fakey’s does not make us a price action trader.
Pin bars are not the death of trends. I can come up with about 50,000 examples of trends both intraday, or on the 4hr and daily time frames whereby the trends ran into a pin bar at a key level, then smashed right through it. I can also come up with thousands where they did the same and reversed.
‘Wait, but those were counter-trend pin bars, what about with trend pin bars?’ 
Same thing, I can come up with 50,000 of those that were with trend, and the market reversed the prevailing trend. I can also find you thousands that were with trend and worked out.
So what was the difference between the ones that did work out and ones that didn’t?
The key was the price action context around the pin bar. How the price action was leading up to the pin bar, and around it (the context of how the pin bar formed) is what will make that signals useful or not.”
This is why it is such a freshman idea and a complete fallacy to think all you need to trade successfully is 3 simple patterns (pin bars, engulfing bars, inside bars). All that + trading with trend at key levels and VOILA! You have your A+ setup and a profitable price action trade.
If it were only that simple (FYI – if it were, a lot more people would be profitable).
So how do you deal with a counter trend signal to your trade?
The answer is in reading the price action context around it. I will share four charts below to demonstrate the point clearly.
Exhibit A
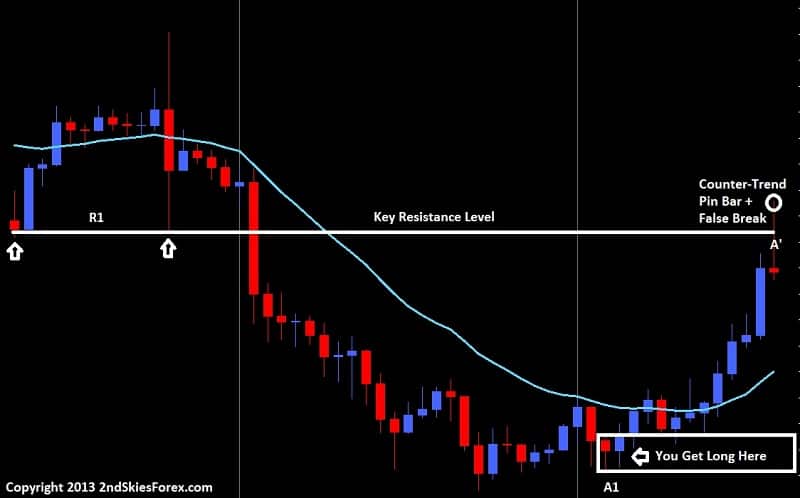
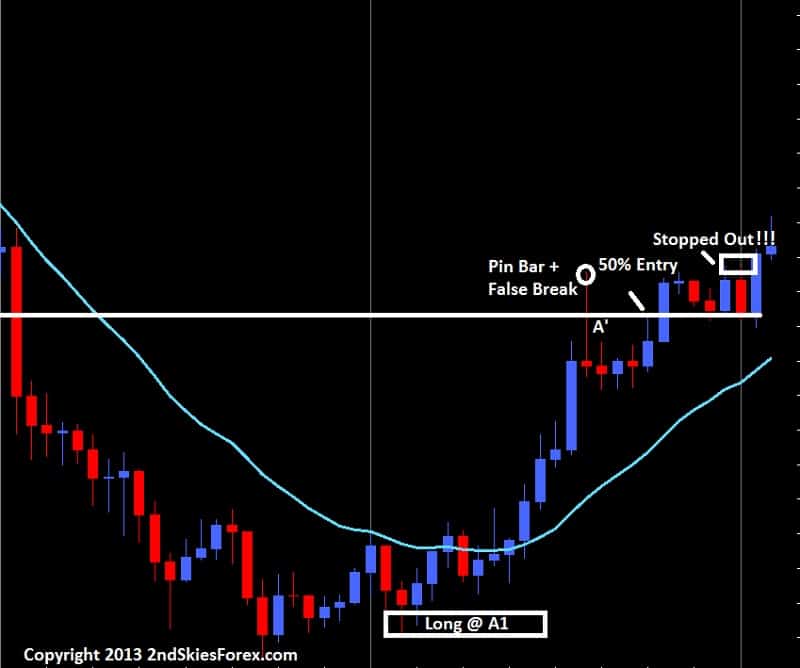
Looking at the chart below, we can see towards the left a double touch off the level R1, then a break through it with a large breakout bar. The market falls heavily and you look to get long around A1 on the bottom right of the chart. Your trade is working out great, but you run into a pin bar + false break (A1) at the key resistance level R1.
price action counter trend trade pin bar key level 2ndskiestrading.com
Minions of the 50% retrace entry on the pin bar are salivating because they think this is a great chance to short as you have a pin bar + false break at a key level, and the 50% retrace is at the level.
Meanwhile, you being long back at A1 see this pin bar and are worried about the market reversing thinking the move is over, so you exit.
Turns out both of you were wrong (see chart below)
pin bar 50 percent retrace entry failed price action context 2ndskiestrading.com
Exhibit B (later on in the same chart)
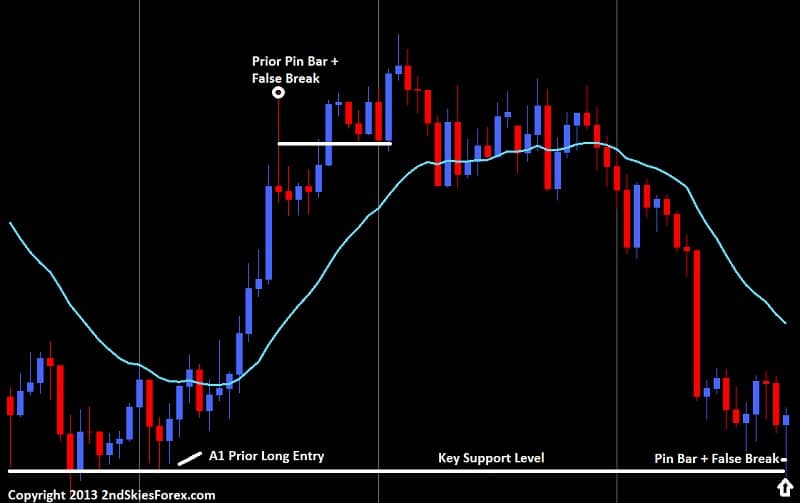
In this next chart below which is only a couple days later on the same pair, price eventually falls back to the same key level where we bought at A1 prior. It forms a consolidation just above it, then a pin bar + false break.
pin bar false break price action context 2ndskiestrading.com
Great! Time to get in on the 50% retrace entry yes as its at a key level. Or, the other option touted is to get long on a break of the pin bar high yes? Either way, this is an A+ setup right since the pair is in a range and formed a pin bar at a key level right?
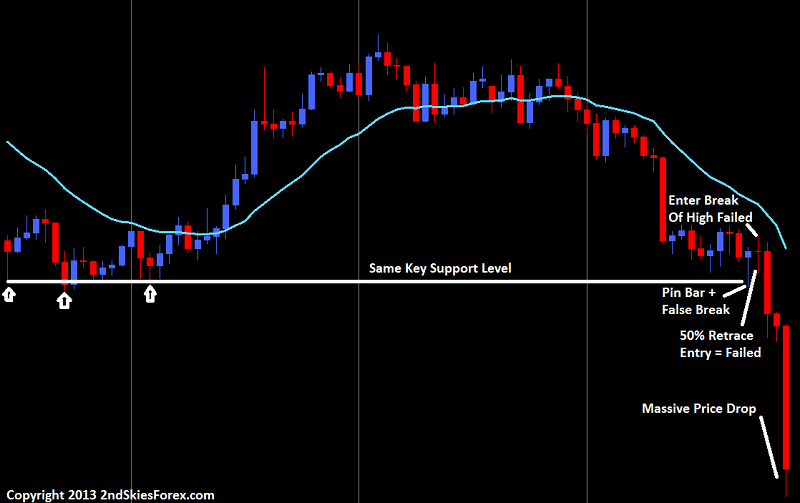
See the next chart below
price action context pin bar entry fails 2ndskiestrading.com
Turns out both pin bar entries failed, even though it was at a key level while price action was in a range. Now imagine you were long around the top of this chart, and ran into this counter-trend pin bar signal at a key level. You probably would have taken profit.
But by not understanding the price action context around the level, you would have missed out on a ton of profit, almost double your profit leading up to that pin bar.
This is why its important to graduate beyond the freshman concepts of trading pin bars, inside bars, engulfing bars, fakey’s, or whatever price action patterns. If trading were that easy, as in trading with the trend + key levels + price action signal = profitable trading, then a lot more people would be making money.
The difference between knowing when to take those signals is in learning to read the context and order flow behind the price action. Pin bars are not the death of trends. Nor are the other patterns. In isolation, or even with trend analysis + key level analysis does not make it a good trade.
Thus my answer to this students question about what to do when you see a counter trend price action signal to your trade – my response is to understand the order flow and price action context around that signal. When you begin to do this, your trading will start to turn. You will find yourself winning more trades, and holding onto trades longer. And while others are buying this last pin bar – you are selling it, and you’ll understand why.


Today’s article is going to discuss and dispel the 50% retracement entry myth on the pin bar strategy. The goal today is to talk about why this entry by itself is a complete misunderstanding of price action, order flow, and the pattern itself.

During this article, I will share two key points on why this is a sophomore entry on this commonly used pattern, how you can find a more optimum entry, and what you should be looking for.

Key Pin Bar Point #1

By itself – the 50% retracement entry is a completely arbitrary method. For those of you unfamiliar with this pin bar forex trading strategy, the idea is to take a fib-retracement of the pinbar itself, and enter on a 50% pullback into it.

Pin bars do not have some magical retracement level institutions and bank traders are looking at for getting into the pattern. The real power of the pattern is in both the trap and rejection of the price action.

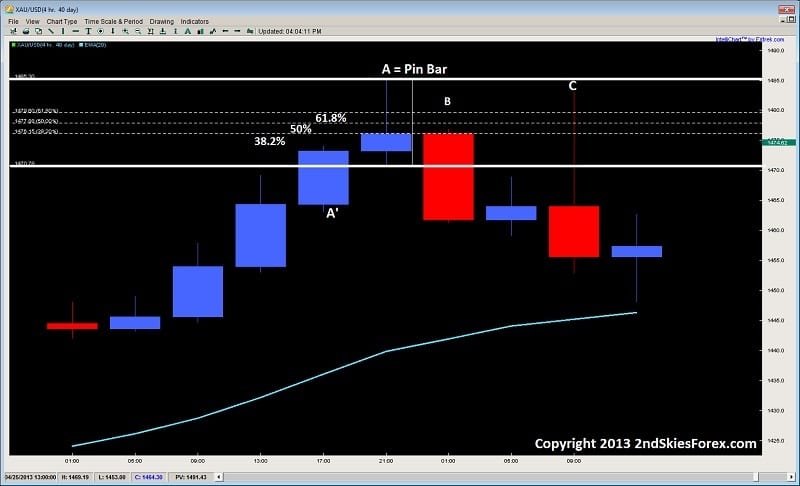
Looking at the chart below on the 4hr Gold chart, we can the pin bar at the top of the chart marked A, and how its body and tail stick out of the prior bars (A’) high & close. When the price breaks the high of the first bar (A’), this brings in new intra-day breakout trend traders to get long.

Now the tail and wick of the pin is formed by sellers rejecting the bulls advance, and reversing their gains intra-day.pin bar forex trading strategy the 50% retracement myth 2ndskiestrading.com, forex trading strategies that work
Once the market breaks below the highs of A’, this “traps” and stops out those bulls who got long on a breakout of A’. This trap forces them to cover their longs with shorts, thus fueling the sell side even further.  But a few details have to be pulled out of this chart first.

  1. The highs of A’ are at the open of the next candle
  2. The close of the pin bar A is parked on a 38.2% fib retracement
  3. Neither of the above line up with a 50% retracement, so taking a long at the 50% retracement is completely arbitrary, and ignores the most recent price action

Now in relation to the first bar after the pin (B), we can see it never makes it to the 50% retracement, and stops right on the 38.2% level which was the most logical conclusion, as that is where the more active order flow was.

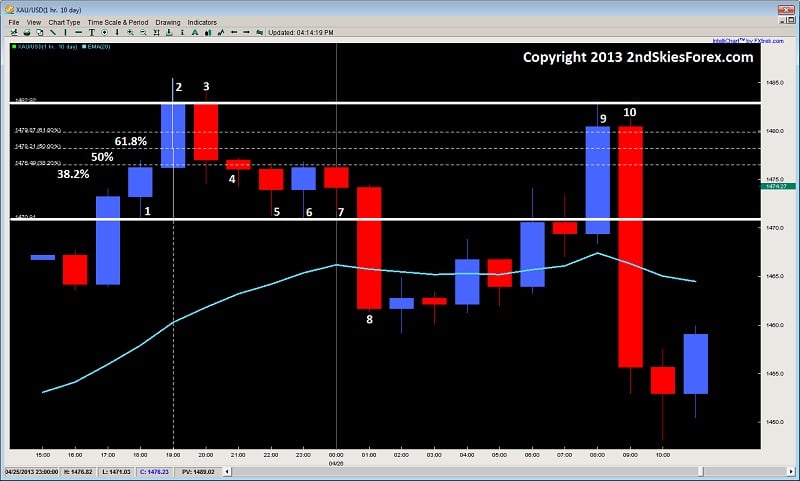
Taking a more detailed look with the 1hr chart below, we are looking at the same intra-day price action from the chart above, but with a little more detail using the 1hr chart.

Now the numbers 1-4, represent the 4hrs in the pin bar from the first chart. Even looking at this chart, do you see where the more dominant price action formed? You should be seeing it at the 38.2% fib retracement.

We can easily see this as the high of 1, the open and close of 2 and 3, the entire body of 4, along with the highs of 5, 6 and 7.pin bar intra-day price action trading strategy 50 percent retracement myth 2ndskiestrading.com

So as you can see, the 50% level has no meaning here, and is thus irrelevant as it ignores the most recent (and thus most important) price action.

Even the bars 9 and 10, blow right past the 50% retracement without even looking, and touch the close/open of bars 2 and 3.

This illustrates why the 50% retracement entry is a complete myth, and a sophomore understanding of both the pin bar, and how price action works. Thus, basing your entry on such an arbitrary play makes no sense and at all, and completely ignores what price action is about.

Key Pin Bar Point #2

If it’s not obvious by now, what you should be doing is basing your pin bar entry on the most recent price action around the pin bar.

This would mean using the prior bar at a minimum, along with the pins high, low, open and close.

The most ideal entry is not some arbitrary 50% retracement, but the actual high/low of the pin bar, or where the nearest key level comes in at.

Before all this, you need to understand price action context first.

Are we in a trend, or in a range? The difference between the two can have a significant impact on your entry.

From here, after you have assessed all this, you can see get a good gauge of where to place your entry.

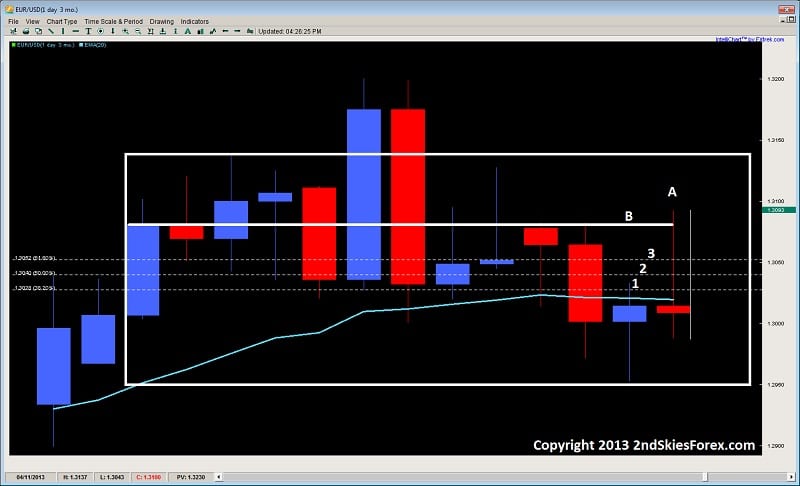
Using another example from a proponent of the 50% retracement entry, the EURUSD recently formed a pin bar on the daily chart. The suggestion was to get short on a 50% retracement. Below is the daily chart of the EURUSD, and the projected entry.pin bar strategy the 50% retracement myth price action 2ndskiestrading.com
Now first thing we have to do is ask ourselves what kind of price action environment are we in? 

Are we in a trend or a range? It should be obvious we are in a range. Thus the golden rules apply, that when in a trend, trade it like a trend, and when in a range, trade it like a range.

Now using this chart above, we can see the range outlined by the box.

The pin bar is marked A, and the fib levels are 1, 2 and 3, for 38.2, 50, and 61.8% retracement levels. Now, although there is some decent price action around both the 38.2%, and the 50% retracement levels, the bottom line is we are in a range – so selling at the arbitrary 50% level  is selling in the middle of a range!

Do you really want to sell in the middle of a range? I didn’t think so.

If you really look at this chart,  you will notice a ton of rejections around the key resistance level line at B, so your minimal entry should be to get short at B. But, since its a range, we don’t want to consider getting short till the upper regions of the range.

This would mean the pin bar high at a minimum. The more premium entries would be above this in the last 10-15 pips (i.e. upper end of the range).

So hopefully you can see how the 50% retracement entry is not only arbitrary, but a complete myth, and a huge misunderstanding of price action and the pin bar.

Going for a 50% retrace entry each time will get you a retail traders entry, not a professional one.

What we need to be doing as traders is

  1. Knowing what environment we are in
  2. Looking at the most recent price action, and
  3. Then determining our entry and how to trade the price action.

But, it has to be asked what was the end result of this 50% play?

The Euro naturally went above the pin bars top, stopping just under the range high, and thus stopping out those who entered on the 50% entry.

In Summary

When you breakdown this arbitrary entry method to trading the pin bar, and start really paying attention to the most recent price action context, along with how PA really works, you will begin get a better understanding of how to trade both pin bars, and price action as a whole.

This skill works for any pattern, environment, pair, time frame, or instrument.

Thus, I hope you found this article both challenging & provocative, but more importantly – insightful on how to trade pin bars, and price action as a whole.

Today’s article will focus on forex trading support and resistance key levels as this seems to challenge many developing traders. Learning how to trade support and resistance key levels is critical, because in essence, this is where;

a) you will be placing your stops and targets, and

b) this is where the institutional traders are getting in

In reality, forex support and resistance trading levels are like ‘doors’ or ‘walls’, either they will be open or closed – either they will break or they will hold shut. Your success in support and resistance trading will be in determining when they will hold, and when they will break.

trading support and resistance key levels breaking through resistance 2ndskiestrading.com

Thus, it becomes essential to learn how to read key levels so you can have a well defended stop, a highly efficient entry, and also have proper timing.  In this resistance and support trading strategy article, I will cover two powerful tips for finding these key support and resistance levels.

#1: Minimum of Two Touches
Before you can consider a level to be used as support or resistance, you will want a minimum of two touches.

Why?

Imagine you are in a strong downtrend, and the pair rejects off a particular price heavily – perhaps via a long tailed pin bar.  You have to consider, with trend traders are just going to see this as a test. The bears know there are buyers off the price where the bottom of the pin bar formed, but they are not going to give up control of the trend just from a simple pin bar.

They are going to retest this level to see if the buyers there are strong enough.  If they break it, then the trend and profits will continue.  If not, then they will take profit, but it’s unlikely a reversal will start immediately.  A good example of this is in the chart below.

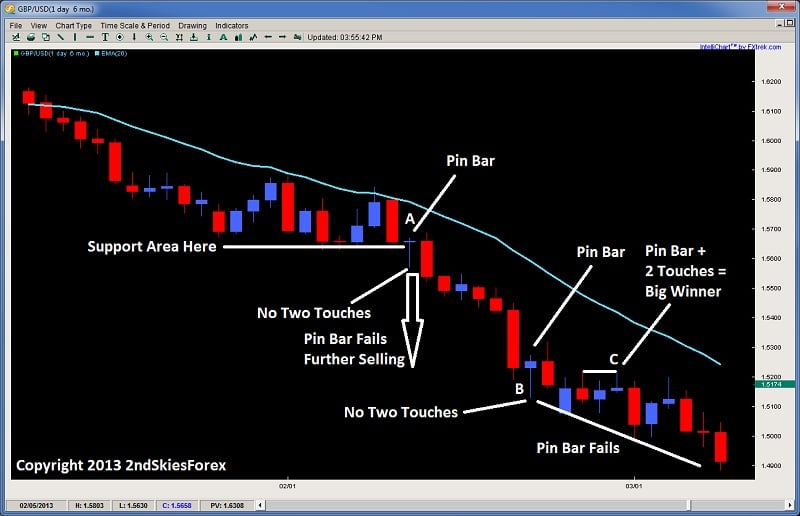
GBPUSD Daily Chart
pin bars support and resistance key levels price action 2ndskiestrading.com

Looking at the chart above, we can see the pair is in a strong downtrend.  In the middle of the chart at A, it forms a counter-trend pin bar. Now although the pin bar body is at the prior support area, the tail is way below, and its the bottom of the tail where the buyers entered in, not at the support area.

Thus, the bulls at the support area were likely stopped out when price dipped 100 pips below, & the rejection from the pin bar occurred at a place with no two touches. So this would not be a pin bar to buy as you can see failed whether or not you used a 50% retrace entry (which can be quite inefficient).

You will also see the same later on with the pin bar at B, which also had a low at no known support area or formed a second touch.  This also would have been a loser.

Now notice the pin bar at C which is with trend. You will notice the pin bar formed a second touch off the level two candles back.  This would have been a good price action setup to get in because the second rejection would have confirmed the level.  And you will notice, it turned out to be a winner.

So the main takeaway from here is look for the two touches, because with a one touch, the with trend traders will re-attack that level. And it should be noted there is a far more efficient entry than the 50% retrace entry which I will discuss in next week’s article, but keep in mind, after long tailed pin bars, you don’t have to worry about missing the entry.

Why?

Because if it is going to reverse, the greater probability is that a re-balancing, or ‘re-distribution‘ of the order flow will begin.  This mostly likely will creating a range, or a corrective pullback.  This is also why when you have an impulsive price action move, followed by a corrective price action move, it is more often followed by another impulsive price action move.

This is also the reason why an impulsive price action move is rarely followed by a counter-trend impulsive price action move. From an order flow perspective, this is because if the sellers are heavily in control, the buyers will have to overwhelm the sellers, and this requires a lot more money and orders then the current bears in control.  This is the reason why V-bottoms are more rare than common.

#2: Trading With Trend Increases the Probabilities
You might have noticed with the chart above, that trading with trend was more powerful than trading counter-trend. As a whole, counter-trend trades are a lesser probability trade, so they take more skill, experience, and precision. This is simply because you are trading against the majority of the order flow, so the odds are already stacked against you.  For those still having trouble getting consistency, I’d recommend trading with trend as much as possible.

Now if you are in a range, then there is no dominant trend, so trading reversal type plays are suggested, particularly at the tops and bottoms of the range. But when a strong trend is in play like the one above, you will find greater profit potential and accuracy trading with trend instead of counter trend.

This also holds true for trading support and resistance levels.

Why?

In a strong trend, the larger players are just looking for key levels as areas they can get in with trend.  This is traditionally known as a breakout pullback setup, and generally does not need two touches off the level to confirm its effectiveness.

Why?

Because likely, in a trend, there will be a support or resistance level that is already being challenged, which would confirm there are buyers or sellers at the level trying to defend it, while the other side is attacking it. Once it breaks, the with trend traders often look for a pullback towards this level to get back in with trend. A great example of this is in the chart below.

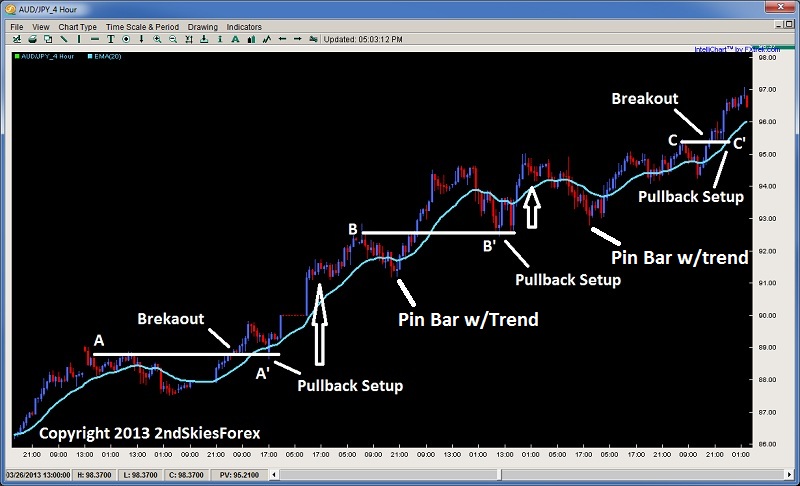
AUDJPY With Trend Setups 4hr Chart
breakout pullback setup trading with trend price action chris capre 2ndskiestrading.com

Using the chart above, starting with the bottom left, price climbs consistently, gapping up, but then forming a resistance area at A. After a brief pullback, we can see price breaks through forming a new SH (swing high).  The market then pulls back to the level at A, and at A’, forms an aggressive engulfing bar which starts the next up leg for over 400+ pips before forming a pullback.

The pullback at B which forms the next resistance high, dips just below the 20ema and forms a with trend pin bar. This marks the new impulsive leg up towards 95.00. Then price pulls back towards the level at B, and at B’, double bottoms (two touches) and starts another leg up and a nice with trend entry.

After a marginal break higher, price pulls back and forms another with trend pin bar below the 20ema, which starts another up leg towards a resistance at C. Sellers enter at C, and after a short pullback, break above it, with a brief consolidation at C’, offering a great breakout pullback setup to get in with trend.

Keep in mind, in all of these with trend pullbacks, the market pulled back towards the levle that it hat the strongest rejection from at A, B and C. The strong rejections at those levels are counter-trend players, trying to stop the trend. But when the bears tried to get past the last major resistance, now turned support (forming a role reversal level), the bulls used this as an opportunity to get long.

Yet in almost every case where the market formed a resistance, when the market attacked that level again, the sellers failed to hold the level. This is because they were going against the major order flow, which highlights how much easier it is to find key support and resistance levels that work when you are trading with trend, and not counter trend. So hopefully this highlights the difference.

In Summary
Finding key levels, and major support and resistance trading levels is not some Da Vinci code type endeavor. Two key things which really help this are using the two touch rule, along with trading more with trend than counter trend. Of course, there are other key clues to understanding support and resistance, but if you can employ these two techniques, they will greatly enhance your ability to find key levels, and make highly effective trades around them.