I recently got an email from a new student who sent me a month of their trading prior to joining my course. Their story is just like many others – they traded well on demo, went live trading, and lost a fair amount of their account. Now they are trying to get back their losses in the quickest way possible.
Sound familiar?
I can appreciate wanting to make gains as quickly as possible. Who wouldn’t? He asked me ‘what is the fastest way to successful forex trading’?

Without a doubt, he had a sincere desire to trade consistently (most do). But two crucial things were missing from their plan.
These two things when done well, will lead to success in trading (and perhaps any skill) faster than hunting for that ‘magic system’ which will make back all your losses. Without this necessary pair, what you want to accomplish (making money / trading successfully), will not happen. The results will not come.
So what are these two crucial things you need to focus on? Process and Progress.
Although the goals (making money, trading from home, consistent profits) are what we strive for in trading, when results become the sole focus, your ability to make money trading becomes hindered.
Why?
In order to reach the level of trading profitably and consistently, you have to build the abilities and skill sets necessary to get there. It sounds obvious, almost easy when you hear it, but it is nothing of the sort. It is one of the most elusive aspects of the trading mindset which new traders fail to understand.
How do you get there?
Process First -Then Progress
This starts with focusing on the process by a) doing the steps necessary to build the skill set, which b) allows you to perform.
Do you think an architect started off by creating buildings? Or do you think they had to learn the math, geometry, and basic skills needed to build a structure?

If you focus on results only, you will skip steps because your focus is not on the task at hand. It sounds counter-intuitive, but your goal in the beginning should not be to make profits. It should be to acquire the abilities (through training and practice), which allow you to perform and trade well.
Remember this next statement well, but a trader will not gain the results wanted BEFORE obtaining and building the necessary skills to reach that result. This comes after you have built those skills.
This is why so many traders fail. They focus on result, not process.
If you think focusing on the process is not important, ask yourself;
‘When getting a complex heart surgery, do you want the doctor focusing on the money he makes from the surgery, or the very complex precise cut he is about to make around your heart?’

Focusing on Progress
Moving on, once your focus is dedicated to the process, it’s time to track your progress (e.g. end of the trading week analysis).
In the very beginning, I have little concern for a traders profits or losses when they first come to me. My main concern is identifying what parts of the process they are missing or skipping. Then I have them refocus on that so they build the base skills needed.
For example, if a trader (you for example) has trouble keeping risk consistent, and fail to use the risk of ruin formula, you will not make money. So my first goal is to have you focus on keeping risk consistent (process). If you show improvement in this, I’ll have you track the ‘progress‘ you are making.
This latter focus gives you confidence. It communicates to your self-image and mindset you can improve, get better and grow. It self-reinforces you focusing on the process, which helps to see the progress you are making.
If you keep this focus, and don’t skip any steps – it is only a matter of time before you are making money trading.
Tag Archive for: price action
In my prior article on the New York Daily Close Charts, I exposed the forex myth demonstrating how the New York Close Charts are not superior to the UK GMT 00.00 charts.
For my price action course members, I just updated our stats on the inside bar strategy, and compared the NY 5pm Close vs. the UK GMT 00.00 Close. For the second time, the results showed no superiority in performance.
Keep in mind, this is just a price action strategy I built, with no server time in mind. We tested it using identical parameters, and here are the results below;
FXCM UK GMT 00.00 Close
-9 Pairs Total Made the Cut
-13 Possible Trade Combinations (via pair/time frame)
-All 4 time frames had profitable setups (Daily, 4hr, 1hr, 30m)
-60% Hit Rate
NY Daily 5pm EST Close
-9 Pairs Made the Cut
-13 Possible Trade Combinations
-All 4 time frames had profitable setups
-61.5% Hit Rate
Now, if the NY Daily Close Charts are so superior, how come they only account for a 1.5% edge in hit rate, yet in the other system they had a 4% lower hit rate?
Does this sound like massive superiority to you? I didn’t think so.
Although you hear it all the time they are superior, who is backing it up with actual statistics? Nobody……save here.
What was also interesting is many of the pairs others are purporting to be profitable using the inside bar strategy are not – not by a long shot.
What the data simply translates into is that neither one is significantly more profitable than the other. However, it is important to know which pair and time frame is, as many did not match up across the different server times for continued profitability.
Now I did promise to discuss an alternative platform besides MT4 for those that want to stick with the NY Daily Close. First, before I share the platform, I should state why I do not like MT4 for trading;
1) Execution on Market Orders is Slow – so slow that FXCM spent a ton of money and time just to remove the 3rd party bridge and no auto account syncs so that it would execute faster
2) Bulky – not user friendly or flexible unless you can program an EA
3) Have to do more clicks for simple trading operations (i.e. closing multiple positions at once, etc.)
There are many other reasons, but if you do any sort of intra-day trading (1hr charts and below), or market orders, you will find other platforms to be far faster with their execution. Even the MT4 demo platforms can have slower execution then a live order on another platform.
What MT4 is Good For
The only use I have for MT4 is to run my algos which inform me of setups (that I execute on other platforms). For programming EAs, it can definitely be cheaper and simpler, but beyond this, for trading purposes, MT4 is slower and bulkier.
A More Intuitive Platform
For those that want a more user friendly and intuitive platform, I suggest the FXCM TS2 (Trading Station 2) platform. The execution for market orders or any sort of intra-day trading will be far superior and faster than almost any MT4 platform. But even more important, you will have to do less clicks to execute orders.
Case in point, open up a new order tab in MT4 to execute a pending order. Here is the window below;
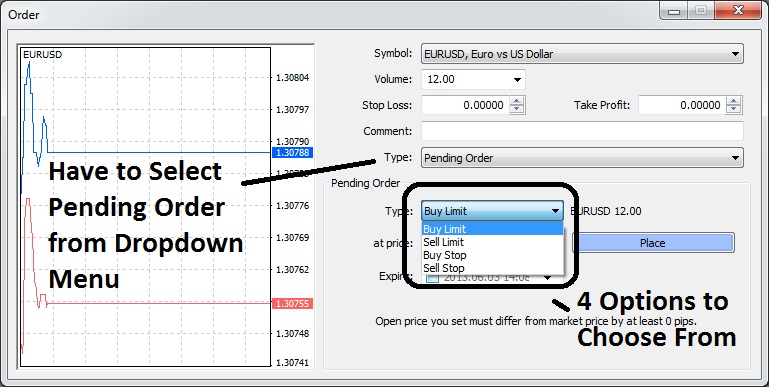
Now notice, just to execute a pending order, you have to 1) click on the ‘New Order’ button, 2) select ‘pending order’ from the drop down menu, 3) then choose from 4 types of orders.
Let’s contrast that with the FXCM TS2 process with the window below;
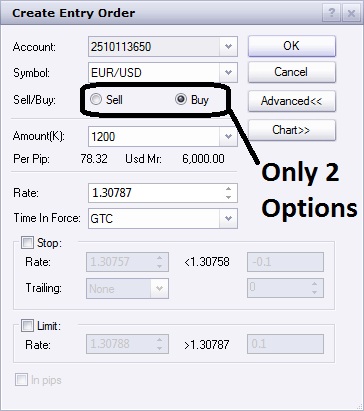
To execute a pending order you simply 1) hit the ‘entry’ order button, and 2) select the ‘buy’ or ‘sell’ button.
Notice the difference?
We are talking 2 steps instead of 3, which when you are trading intra-day, could mean a big difference in execution and getting your price. But also notice which one is more confusing. With MT4, you have 4 order types to choose from, while with FXCM’s TS2, it’s a much simpler ‘buy’ or ‘sell’, regardless of whether its a buy stop or buy limit order – the platform and technology does the work for you.
But for those trading any significant size, or any intra-day price action strategies, execution is critical, and seconds can mean getting your price or missing it.
Trade History On the Charts
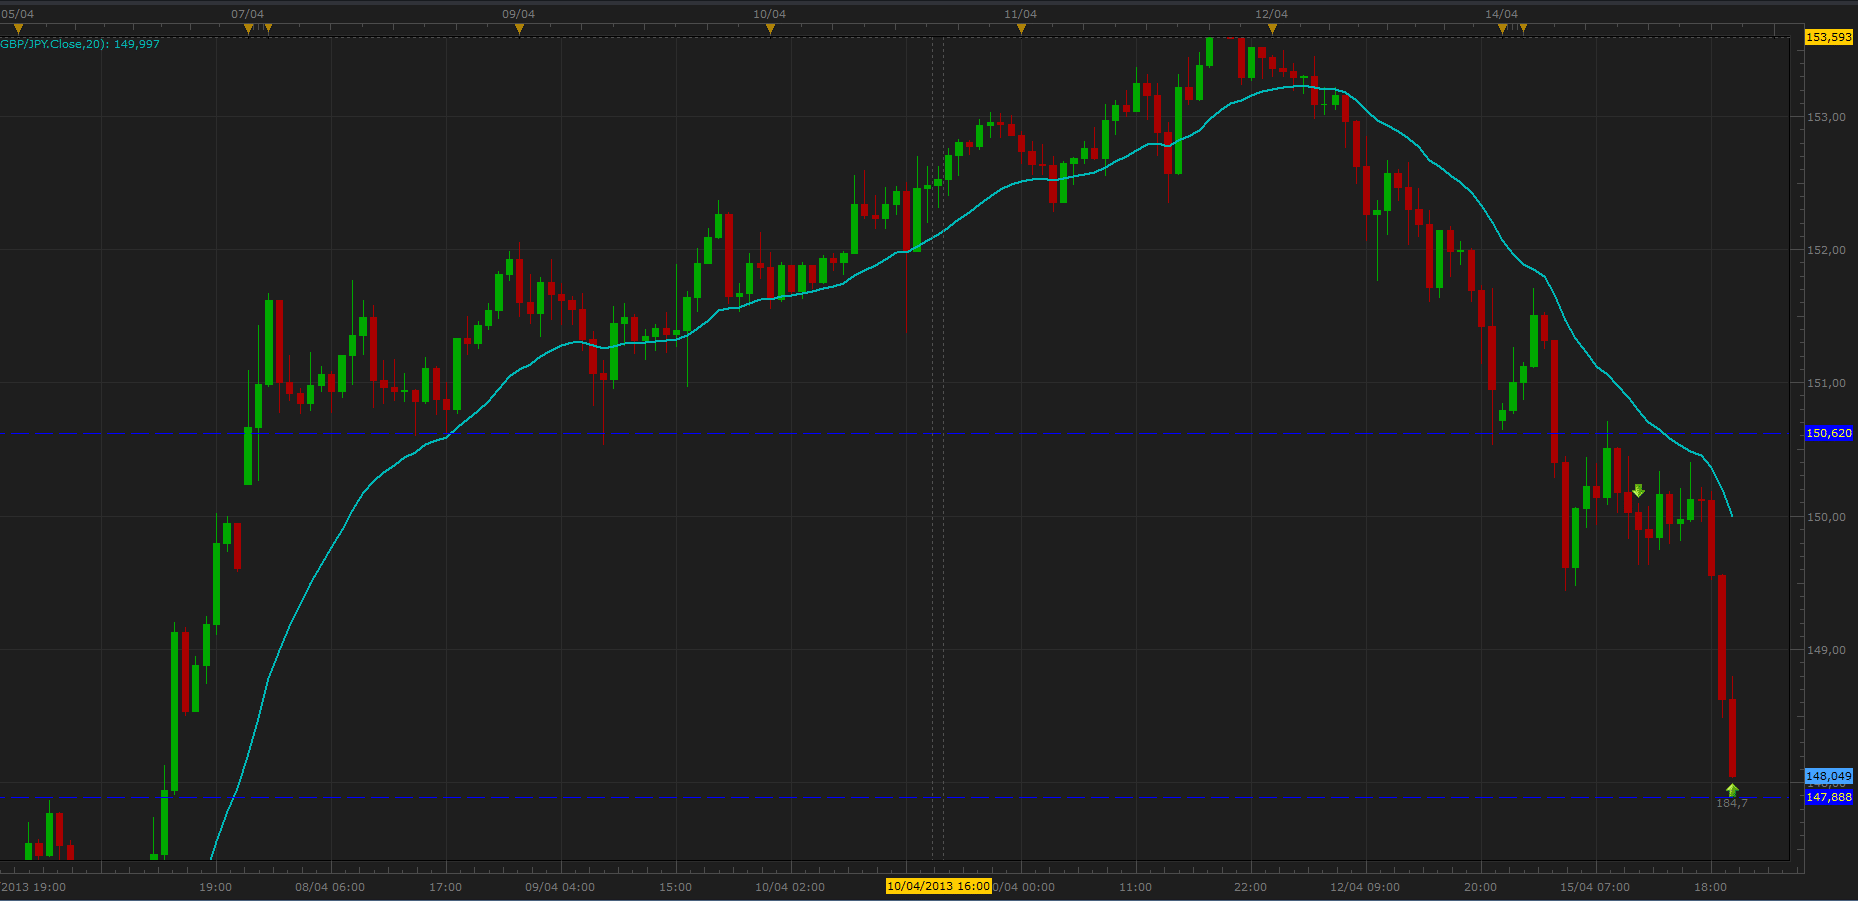
One other feature I really enjoy about the TS2 platform is it shows the trades (or trade history) you made in the last 24hrs on the chart, particularly your entry and exit levels. I find this particularly useful for when I’m doing intra-day trades, sometimes I cannot take screenshots of my trade as I’m in several trades at once. When I close the trade, the TS2 charts (Marketscope), will actually show me the entry and exit level on the charts. A good example is below;
The benefit of this feature allows to me to take screenshots of trades I missed, then store them for analysis at the end of the trading week so I can isolate patterns behind my winners and losers. But with MT4, these are not available. Once the trade is closed, the entry and exit levels on the chart are gone, which makes for more work.
Although this is a small feature, it’s all these little features that add up to a big result. When it comes to a trading platform, user friendliness is critical, and the more work you have to do to execute a trade, the more time and profits can be wasted.
I hope this article now has conveyed to you 1) the New York Daily Forex Close Charts being superior is a myth, and 2) there is a far superior alternative platform for trading then MT4 which also uses the NY 5pm Close should you wish.
For those wanting to learn which pairs and price action systems are profitable in your server time, then make sure to check out my Price Action Course where you will learn which pairs, time frames, and systems are profitable across specific server times.
After working with thousands of trader, along with my 13+ year trading career, I have seen the dozens of pitfalls and traps developing or struggling traders continually fall into, that I myself have fallen into early on, and that separate oneself from trading profitably and consistently.
In this article, I am going to share 5 things all forex traders must avoid, but will wait to hear your responses as to what would be the solution to these traps which most traders fall into.
#1 Focusing on Obstacles
Do you come up with reasons why you cannot be successful? Blame the broker, or number of screens you don’t have, your background, your account balance? Do you come up with justifications why you cannot fill out your trading journal, follow your trading plan, or simply put – be successful at trading?
One thing you must avoid when learning to trade successfully is focusing on obstacles – particularly what is stopping you from trading successfully. Ask yourself how/if you do this in with trading now, and see if you can discover why it may be holding you back.

#2 Focusing Only on Your Sub-Conscious Ability
What is your favorite subject or type of article to read? I’m willing to bet its more often about trading and a particular strategy – perhaps about a price action system, or an ichimoku strategy. How much time do you spend looking at charts, studying systems, looking for systems, setups, and trading methods? Then ask yourself how much time you spend on risk management and your trading mindset?
Focusing on the former is only focusing on your sub-conscious mind, and by itself, no matter how developed it is, or how many hours of screen time you have, cannot lead you to profitability or consistency (by itself).
Ask yourself how much time you dedicate to this in relation to the other aspects of trading.
#3 Focusing on Problems
After a big loss, what do you spend your time thinking about? For the mistakes you make over and over again, where does your thoughts, mind and energy go to? Ask yourself how much time you spend focusing on the problem when it comes to your trading. Ask yourself how much time you spend focusing on what happened (in the past that you cannot change).
#4 Focusing on Outcome
I know, it’s hard not to focus on the results, the profits (or losses), your account balance, your accuracy and overall performance. But ask yourself how much time you spend focusing on the outcome, and what you think that does to your self-image and mindset about trading. How much time do you focus on the result of your trading for the day, on your lack of profits, success, or consistency?
#5 Not Protecting Your Capital – Your Mental Capital
There has been tens of thousands of words written by keyboard and ink about preserving your capital, but what about protecting your mental capital? How much effort and time do you spend protecting your mental capital, your self-image, and your trading mindset? What kind of effect failing to do this has on your mind, your confidence and performance?
In Closing
Take some time to really meditate on these things, how you may be doing some (or all) of them currently, and how they may be affecting your trading. Please do not hesitate to share your experiences around these as well as the info can be valuable for all.
Later this week, I will write a follow up article as to why it’s important to avoid these mistakes, how they impair your performance and growth, and then discuss solutions to avoid making these mistakes in the future.
Looking forward to your comments and thoughts about this.
Kind Regards,
Chris Capre
In this forex order flow video I discuss how to read the price action, order flow and the transitions behind trends or reversals.
Today’s article is going to discuss and dispel the 50% retracement entry myth on the pin bar strategy. The goal today is to talk about why this entry by itself is a complete misunderstanding of price action, order flow, and the pattern itself.
During this article, I will share two key points on why this is a sophomore entry on this commonly used pattern, how you can find a more optimum entry, and what you should be looking for.
Key Pin Bar Point #1
By itself – the 50% retracement entry is a completely arbitrary method. For those of you unfamiliar with this pin bar forex trading strategy, the idea is to take a fib-retracement of the pinbar itself, and enter on a 50% pullback into it.
Pin bars do not have some magical retracement level institutions and bank traders are looking at for getting into the pattern. The real power of the pattern is in both the trap and rejection of the price action.
Looking at the chart below on the 4hr Gold chart, we can the pin bar at the top of the chart marked A, and how its body and tail stick out of the prior bars (A’) high & close. When the price breaks the high of the first bar (A’), this brings in new intra-day breakout trend traders to get long.
Now the tail and wick of the pin is formed by sellers rejecting the bulls advance, and reversing their gains intra-day.
Once the market breaks below the highs of A’, this “traps” and stops out those bulls who got long on a breakout of A’. This trap forces them to cover their longs with shorts, thus fueling the sell side even further. But a few details have to be pulled out of this chart first.
- The highs of A’ are at the open of the next candle
- The close of the pin bar A is parked on a 38.2% fib retracement
- Neither of the above line up with a 50% retracement, so taking a long at the 50% retracement is completely arbitrary, and ignores the most recent price action
Now in relation to the first bar after the pin (B), we can see it never makes it to the 50% retracement, and stops right on the 38.2% level which was the most logical conclusion, as that is where the more active order flow was.
Taking a more detailed look with the 1hr chart below, we are looking at the same intra-day price action from the chart above, but with a little more detail using the 1hr chart.
Now the numbers 1-4, represent the 4hrs in the pin bar from the first chart. Even looking at this chart, do you see where the more dominant price action formed? You should be seeing it at the 38.2% fib retracement.
We can easily see this as the high of 1, the open and close of 2 and 3, the entire body of 4, along with the highs of 5, 6 and 7.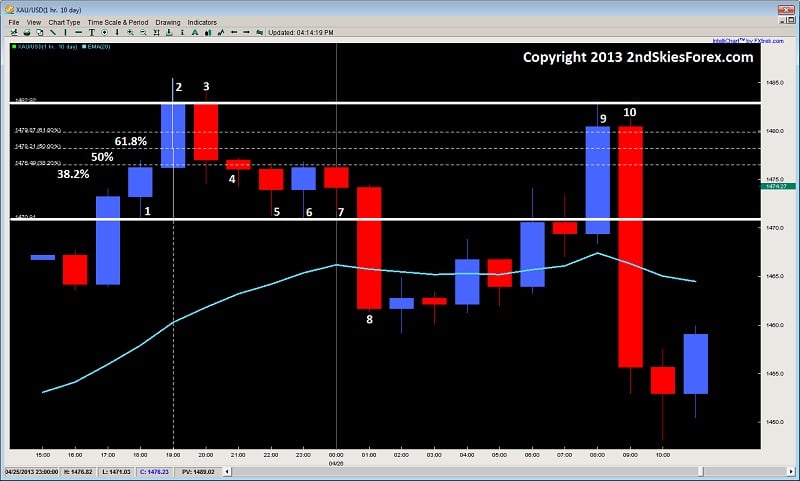
So as you can see, the 50% level has no meaning here, and is thus irrelevant as it ignores the most recent (and thus most important) price action.
Even the bars 9 and 10, blow right past the 50% retracement without even looking, and touch the close/open of bars 2 and 3.
This illustrates why the 50% retracement entry is a complete myth, and a sophomore understanding of both the pin bar, and how price action works. Thus, basing your entry on such an arbitrary play makes no sense and at all, and completely ignores what price action is about.
Key Pin Bar Point #2
If it’s not obvious by now, what you should be doing is basing your pin bar entry on the most recent price action around the pin bar.
This would mean using the prior bar at a minimum, along with the pins high, low, open and close.
The most ideal entry is not some arbitrary 50% retracement, but the actual high/low of the pin bar, or where the nearest key level comes in at.
Before all this, you need to understand price action context first.
Are we in a trend, or in a range? The difference between the two can have a significant impact on your entry.
From here, after you have assessed all this, you can see get a good gauge of where to place your entry.
Using another example from a proponent of the 50% retracement entry, the EURUSD recently formed a pin bar on the daily chart. The suggestion was to get short on a 50% retracement. Below is the daily chart of the EURUSD, and the projected entry.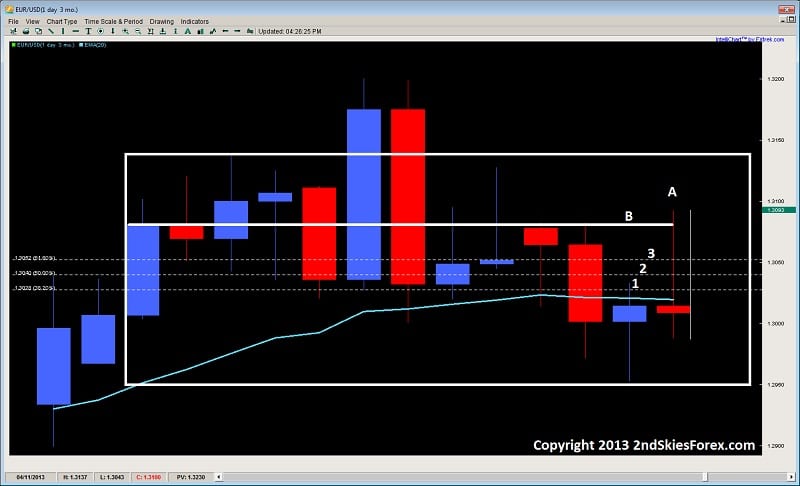
Now first thing we have to do is ask ourselves what kind of price action environment are we in?
Are we in a trend or a range? It should be obvious we are in a range. Thus the golden rules apply, that when in a trend, trade it like a trend, and when in a range, trade it like a range.
Now using this chart above, we can see the range outlined by the box.
The pin bar is marked A, and the fib levels are 1, 2 and 3, for 38.2, 50, and 61.8% retracement levels. Now, although there is some decent price action around both the 38.2%, and the 50% retracement levels, the bottom line is we are in a range – so selling at the arbitrary 50% level is selling in the middle of a range!
Do you really want to sell in the middle of a range? I didn’t think so.
If you really look at this chart, you will notice a ton of rejections around the key resistance level line at B, so your minimal entry should be to get short at B. But, since its a range, we don’t want to consider getting short till the upper regions of the range.
This would mean the pin bar high at a minimum. The more premium entries would be above this in the last 10-15 pips (i.e. upper end of the range).
So hopefully you can see how the 50% retracement entry is not only arbitrary, but a complete myth, and a huge misunderstanding of price action and the pin bar.
Going for a 50% retrace entry each time will get you a retail traders entry, not a professional one.
What we need to be doing as traders is
- Knowing what environment we are in
- Looking at the most recent price action, and
- Then determining our entry and how to trade the price action.
But, it has to be asked what was the end result of this 50% play?
The Euro naturally went above the pin bars top, stopping just under the range high, and thus stopping out those who entered on the 50% entry.
In Summary
When you breakdown this arbitrary entry method to trading the pin bar, and start really paying attention to the most recent price action context, along with how PA really works, you will begin get a better understanding of how to trade both pin bars, and price action as a whole.
This skill works for any pattern, environment, pair, time frame, or instrument.
Thus, I hope you found this article both challenging & provocative, but more importantly – insightful on how to trade pin bars, and price action as a whole.
Today I’m going to share an unconventional approach to creating a successful forex trading mindset I employ every day before I hit the buy/sell button. A small confession though – it actually took me a while to realize it was a major ingredient in my success.
The funny thing is, I never read it in any trading book, video or blog. Perhaps it should be – perhaps it needs to be talked about more often, because doing this one thing has changed my mindset in trading and life.
So what is this one unconventional approach I’ve used that’s help to build a successful trading mindset?
Hello Traders,
Often times I share my own personal trades that I use from my price action course strategies, but today I wanted to share some from a student who has banked over 1640+ pips in just the last two days, using our strategies. This student (we’ll call him Stan) had joined our course only a few weeks ago, and has already paid for it several times over. How Stan came to me is quite interesting and worth noting.

He took another course from someone else on price action just this last January and had the following to say;
“I started a course from him in January, and I do not want to waste any more time on his course. I like your forex videos, but moreso wanted to learn from your unique perspective on trading and life, so I’m going to join your course.”
He joined on March 10th of this year.
For the next two weeks, he did nothing but study and ask questions, really digging himself into the material and constantly getting feedback. He without a doubt has the passion and drive, and is using these to fuel his growth without a doubt.
After a few weeks of study, questions, practice and feedback, he emailed me on April 4th with the following;
“I have been watching the videos on the price action course, and today I nailed 3/3 trades which I’m still in at the moment. I just want to thank you for being such a good teacher and gifted instructor. Thank you for passing on the knowledge.”
Making a good chunk of money to have the time and freedom to do what you want is one thing – but having an impact on another person’s life is a completely different thing. This is what I strive for, as making money is not difficult, but being able to impact a person’s life like this student – is as rewarding as it gets.
Stan made these trades the day before NFP, and was up over +1060 pips heading into the big announcement.
After a few back and forth discussions on how he should handle the positions, Stan stayed in them through NFP, and has profited even more – currently up +1640 pips on just those three positions.
Here are the trades below from the screenshots he sent me on Thursday:
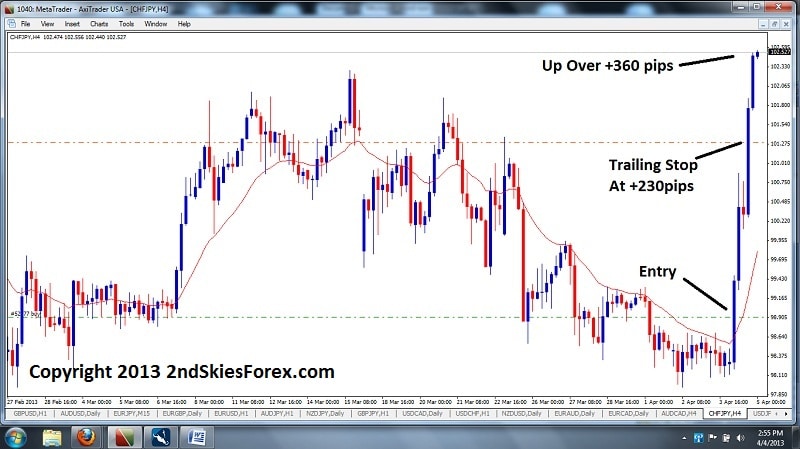
CHFJPY 1hr Chart
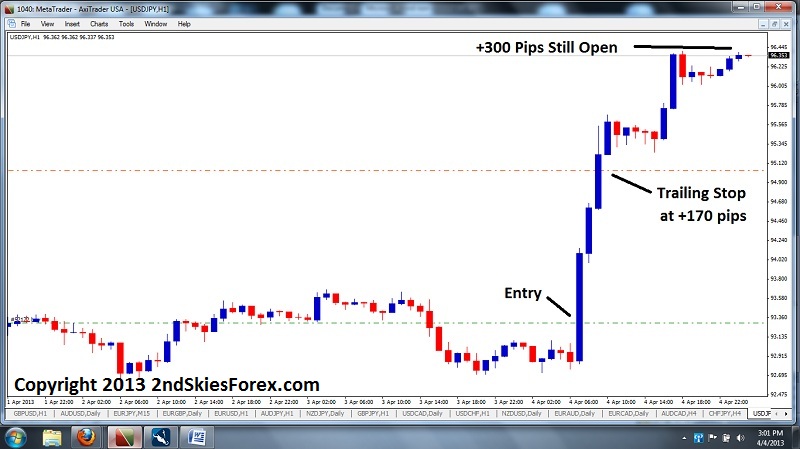
USDJPY 1hr Chart
GBPJPY 1hr Chart
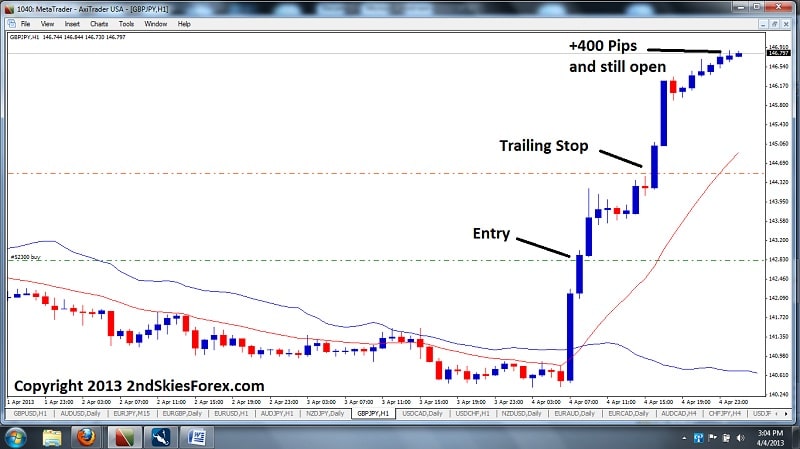
As you can see, Stan got pretty darn good entries on the positions considering the JPY volatility – but has also held his nerve as they developed, which has allowed him to make several multiples of R (reward) per trade, with some over 10:1 reward to risk plays.
As of Friday just after the NFP report came out, Stan sent me another screenshot of him holding the positions, and even adding onto it using one of our price action setups.
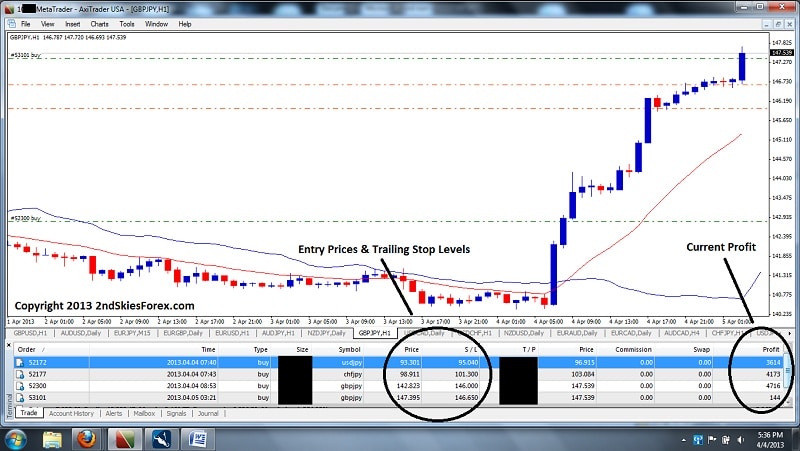
As you can see buy the date and time on his broker platform, Stan was still in the position heading into NFP and added more. If you include the new position he added, he’s up another 221 pips, so a total of +1861 pips in the last two days, and each trade is no less than a 7:1 reward to risk play, with one being over 10:1.
Keep in mind, Stan only joined the course a few weeks ago, and has learned tools and methods to take advantage of these huge moves in the market. The irony of it is, he was not the top performing trader in the course this week, who banked over +6300 pips this week from trading Gold and Silver!
Perhaps you have not been profiting lately in the markets, and having trouble catching these great price action setups and large moves. But seeing the above, I hope you realize how you can profit from trading the market, with the right education, study and practice.
Making money in the markets is a real thing, and its not just something that I do, but my students do as well, and continue to do. My belief has always been – if they can do it, then there is no reason why you cannot as well.
My job is to give you the strategies, training and mindset to be successful, but you must meet me on the path. I can only do so much, and my job is really to do 50% of the work for you (although it ends up being like 75%). But for those that meet me along the way, and do their part, the rewards are there, just like they were for Stan in his excellent trading above.
Hopefully, you will be next.
Kind Regards,
Chris Capre
With liquidity dying down heading into the Easter holiday coming this Sunday, instead of writing my evening price action market commentary article, I wanted to write a little two part series today and tomorrow about some of the overlooked aspects of trading – the little details.
Wasn’t Ted Williams a baseball player?
Yes he was – and a great one at that.
This lesson actually centers around a great story about Ted, although not during his trading career, but well after it had ended.
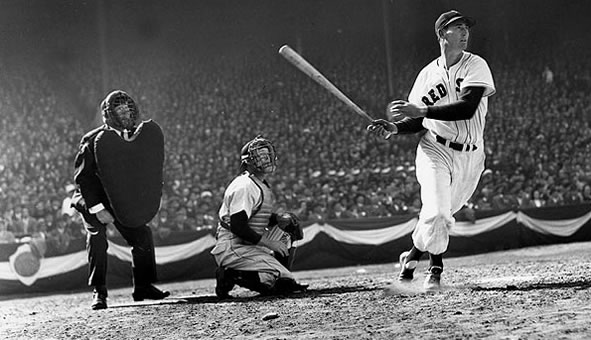
Several years ago, the Ted Williams museum was collecting several items from Ted’s great career to be stored in the museum for all to appreciate. For those that don’t know much about Ted, he is considered to be one of the greatest hitters of all time, and in 1941, he hit a .406 average – which makes him the last person in over 70 years to finish a season above .400.
Williams was known to pay attention to the details of everything he did when it came to baseball, especially hitting. His famous bat during the 1941 season was suspected to have been bought initially by a collector for over $20,000. When the museum had bought the bat, they had asked Ted to come to the museum and verify if it was his bat.
He saw the bat, closed his eyes, and put his hands firmly around the handle just as he held the bat to hit a baseball.
After a short pause, he said the following;
“Yep, this is one of my bats for sure.”
One of the members at the museum had asked him how he had known it was his bat.
He responded;
“Back in the years 1940 and 1941, I had cut a groove in the handle of my bats to rest my right index finger in. I can still feel the groove in this bat here.”
You will find amongst some of the greatest concert pianists, guitarists, athletes, and anyone highly skilled in their craft, they pay attention to the details and the smallest aspects of their game. Often times, these small details and steps will lead to a large result, often times separating success from failure, breaking even to profitability, and from just good to great.
Ted Williams realized that if he could rest his index finger more naturally into the bat, it would influence his swing. That is attention to detail.
Jimmy Hendrix would adjust and oversee every guitar he ever used. Anytime he got a new guitar, he would bend the ‘tremolo‘ (whammy bar) by hand for hours at a time.
Why?
By bending it and getting it closer to the body, he could tap the strings while raising and lowering the pitch, sometimes down three steps instead of one.
That is attention to detail, and just one in the dozens he did when adjusting his guitar.

All highly skilled professionals look towards the details as a way to refine their game. And this is something you have to do in your forex trading. You have have to constantly refine your trading to greater and greater levels of precision, detail and performance. Maybe you have to adjust your equity threshold, or maybe you have to adjust your engulfing bar entry, as the vanilla one is quite inefficient.
As Michael Jordan once said;
” Take small steps. Don’t let anything trip you up in reaching your goal. All of those small steps are like little pieces of a puzzle. Eventually they come together to form a picture of greatness. But doing things step by step – I cannot see any other way of accomplishing anything.”

So take some time to think of all the little details where you could refine your trading. We all have them, regardless of our level, profitability, or account size. I’m willing to bet that if you look at the numbers, and run the data on your performance, perhaps even adjusting your risk of ruin, if you just changed one little detail, you would be completely amazed at how it would affect your performance.
This can make the difference between being profitable and losing money, between barely breaking even and consistently profiting, or the difference between being good or great. Ask yourself where you are on that spectrum, and where you’d like to be. Then get to work.
Keep in mind, I’ve never met a single profitable trader who cut shortcuts, who tried the easy way out, who wanted something for free, or was willing to steal to get there. Food for thought…but without having the mindset of abundance, how can you expect to be a professional trader who works with bigger and bigger amounts of money?
Tomorrow before the weekend, I’ll write the second part of this article, where I share one piece of data I’ve recently discovered in my personal trading, that would be the difference between my current performance, and a six-figure car…per year…without compounding.
See you then…
Today’s article will focus on forex trading support and resistance key levels as this seems to challenge many developing traders. Learning how to trade support and resistance key levels is critical, because in essence, this is where;
a) you will be placing your stops and targets, and
b) this is where the institutional traders are getting in
In reality, forex support and resistance trading levels are like ‘doors’ or ‘walls’, either they will be open or closed – either they will break or they will hold shut. Your success in support and resistance trading will be in determining when they will hold, and when they will break.

Thus, it becomes essential to learn how to read key levels so you can have a well defended stop, a highly efficient entry, and also have proper timing. In this resistance and support trading strategy article, I will cover two powerful tips for finding these key support and resistance levels.
#1: Minimum of Two Touches
Before you can consider a level to be used as support or resistance, you will want a minimum of two touches.
Why?
Imagine you are in a strong downtrend, and the pair rejects off a particular price heavily – perhaps via a long tailed pin bar. You have to consider, with trend traders are just going to see this as a test. The bears know there are buyers off the price where the bottom of the pin bar formed, but they are not going to give up control of the trend just from a simple pin bar.
They are going to retest this level to see if the buyers there are strong enough. If they break it, then the trend and profits will continue. If not, then they will take profit, but it’s unlikely a reversal will start immediately. A good example of this is in the chart below.
GBPUSD Daily Chart
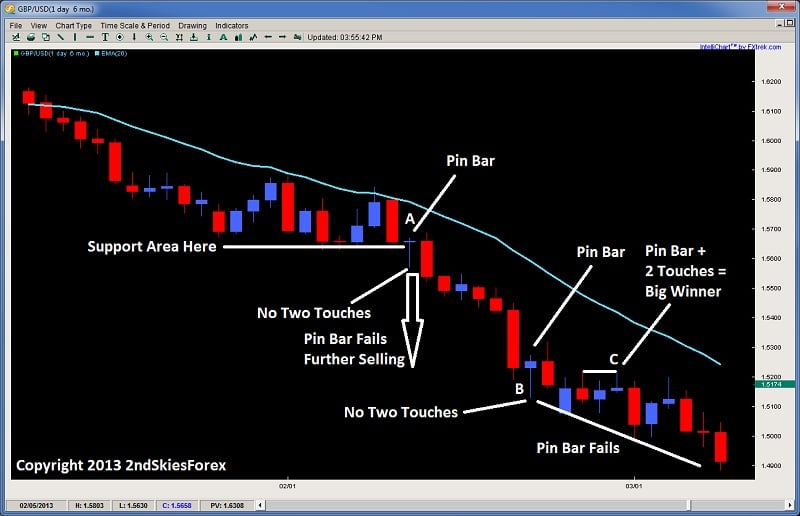
Looking at the chart above, we can see the pair is in a strong downtrend. In the middle of the chart at A, it forms a counter-trend pin bar. Now although the pin bar body is at the prior support area, the tail is way below, and its the bottom of the tail where the buyers entered in, not at the support area.
Thus, the bulls at the support area were likely stopped out when price dipped 100 pips below, & the rejection from the pin bar occurred at a place with no two touches. So this would not be a pin bar to buy as you can see failed whether or not you used a 50% retrace entry (which can be quite inefficient).
You will also see the same later on with the pin bar at B, which also had a low at no known support area or formed a second touch. This also would have been a loser.
Now notice the pin bar at C which is with trend. You will notice the pin bar formed a second touch off the level two candles back. This would have been a good price action setup to get in because the second rejection would have confirmed the level. And you will notice, it turned out to be a winner.
So the main takeaway from here is look for the two touches, because with a one touch, the with trend traders will re-attack that level. And it should be noted there is a far more efficient entry than the 50% retrace entry which I will discuss in next week’s article, but keep in mind, after long tailed pin bars, you don’t have to worry about missing the entry.
Why?
Because if it is going to reverse, the greater probability is that a re-balancing, or ‘re-distribution‘ of the order flow will begin. This mostly likely will creating a range, or a corrective pullback. This is also why when you have an impulsive price action move, followed by a corrective price action move, it is more often followed by another impulsive price action move.
This is also the reason why an impulsive price action move is rarely followed by a counter-trend impulsive price action move. From an order flow perspective, this is because if the sellers are heavily in control, the buyers will have to overwhelm the sellers, and this requires a lot more money and orders then the current bears in control. This is the reason why V-bottoms are more rare than common.
#2: Trading With Trend Increases the Probabilities
You might have noticed with the chart above, that trading with trend was more powerful than trading counter-trend. As a whole, counter-trend trades are a lesser probability trade, so they take more skill, experience, and precision. This is simply because you are trading against the majority of the order flow, so the odds are already stacked against you. For those still having trouble getting consistency, I’d recommend trading with trend as much as possible.
Now if you are in a range, then there is no dominant trend, so trading reversal type plays are suggested, particularly at the tops and bottoms of the range. But when a strong trend is in play like the one above, you will find greater profit potential and accuracy trading with trend instead of counter trend.
This also holds true for trading support and resistance levels.
Why?
In a strong trend, the larger players are just looking for key levels as areas they can get in with trend. This is traditionally known as a breakout pullback setup, and generally does not need two touches off the level to confirm its effectiveness.
Why?
Because likely, in a trend, there will be a support or resistance level that is already being challenged, which would confirm there are buyers or sellers at the level trying to defend it, while the other side is attacking it. Once it breaks, the with trend traders often look for a pullback towards this level to get back in with trend. A great example of this is in the chart below.
AUDJPY With Trend Setups 4hr Chart
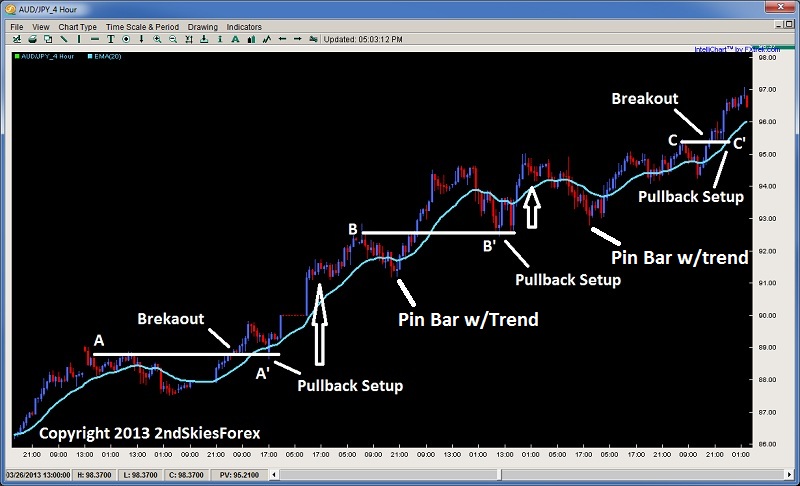
Using the chart above, starting with the bottom left, price climbs consistently, gapping up, but then forming a resistance area at A. After a brief pullback, we can see price breaks through forming a new SH (swing high). The market then pulls back to the level at A, and at A’, forms an aggressive engulfing bar which starts the next up leg for over 400+ pips before forming a pullback.
The pullback at B which forms the next resistance high, dips just below the 20ema and forms a with trend pin bar. This marks the new impulsive leg up towards 95.00. Then price pulls back towards the level at B, and at B’, double bottoms (two touches) and starts another leg up and a nice with trend entry.
After a marginal break higher, price pulls back and forms another with trend pin bar below the 20ema, which starts another up leg towards a resistance at C. Sellers enter at C, and after a short pullback, break above it, with a brief consolidation at C’, offering a great breakout pullback setup to get in with trend.
Keep in mind, in all of these with trend pullbacks, the market pulled back towards the levle that it hat the strongest rejection from at A, B and C. The strong rejections at those levels are counter-trend players, trying to stop the trend. But when the bears tried to get past the last major resistance, now turned support (forming a role reversal level), the bulls used this as an opportunity to get long.
Yet in almost every case where the market formed a resistance, when the market attacked that level again, the sellers failed to hold the level. This is because they were going against the major order flow, which highlights how much easier it is to find key support and resistance levels that work when you are trading with trend, and not counter trend. So hopefully this highlights the difference.
In Summary
Finding key levels, and major support and resistance trading levels is not some Da Vinci code type endeavor. Two key things which really help this are using the two touch rule, along with trading more with trend than counter trend. Of course, there are other key clues to understanding support and resistance, but if you can employ these two techniques, they will greatly enhance your ability to find key levels, and make highly effective trades around them.
Today I am writing a potent article about pre-qualifying forex breakouts, particularly understanding them from a price action & order flow perspective. When you pre-qualify a breakout, you put yourself in a position to identify it as a high or low probability breakout. To do this however, you have to understand what makes a successful forex breakout trade both from a price action and order flow perspective.
In my prior article 3 Keys for Identifying Breakouts, I talk about 3 such parameters for pre-qualifying forex breakouts. They are;
1) Well Defined Support/Resistance Level
2) Pre-Breakout Squeeze/Pressure/Tension
3) 20ema Carry
When you can identify these prior to a potential breakout, you highly increase the probabilities of trading a successful breakout. But let’s dig into this a little deeper as to why from a price action and order flow perspective.
Order Flow Behind Breakouts
From an order flow perspective, breakouts generally start with an initial balance between buyers and sellers. This usually results in a range of sorts, with two clearly defined support and resistance levels. When you get several touches on these levels, this clearly communicates where both sides of the players are parked (and likely their stops as well). The more touches on these barriers, the more players are brought in.
Those who are bullish will get in on the bounces off support, while bearish players on rejections off resistance.
However as time goes on, tension starts to build between the two camps as someone will eventually want to take control. In almost all cases, the side with the largest number of orders and money behind their camp, will win this tug of war.
This usually manifests in a higher low (HL) or lower high (LH) being formed inside the range, and more aggressive pushes towards the other line in the sand, while less or no touches on the other side, almost as if the sellers or buyers could not reach the other support or resistance level. It usually looks something like the chart below.
EURJPY 5M Chart
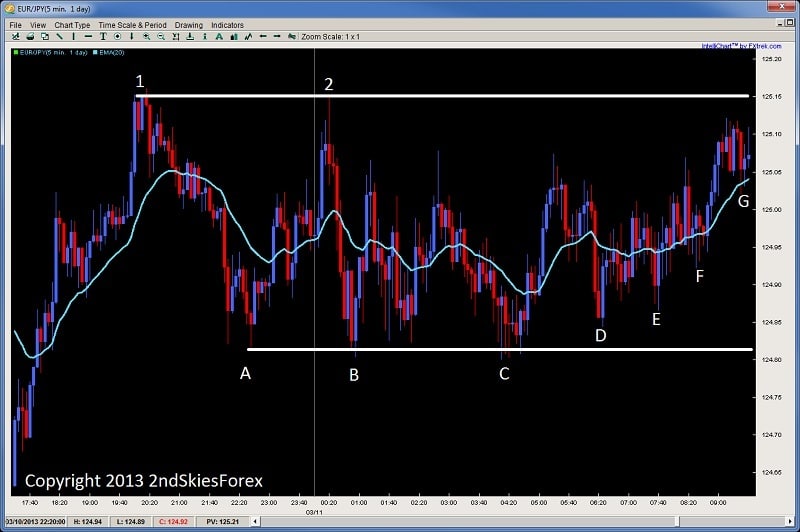
Looking at the chart above, you’ll see a clearly defined support and resistance level with a minimum of two touches on each side. This tips us off to where the bears and bulls are parked on the chart with stops just above/below the levels.
Now you will notice each rejection at A & B minimally went up to 125.05 before coming back down and touching the same support level at 124.80.
C pushes price back up to 125.05, but this time the rejection fails to reach 124.80, and can only make it to 124.85. From an order flow perspective, the buyers are starting to get more aggressive and confident their level will hold, so they are buying up higher (at a more expensive price).
The next pullback at E is also higher, so we are seeing a continual change of hands by the bulls buying higher from support (and their defenses at 124.80).
Now notice every push up from B, C, D, and E only makes it to a maximum price of 125.05. But with F, it goes to 125.10. There were probably some intraday bears shorting at 125.05 (now stopped out), while the rest were still short at 125.15.
Now that price is pushing up towards the resistance without ever touching the support, this communicates the bulls are taking control of the price action with more orders and money, and will likely continue to squeeze the bears out.
This price action squeeze takes out smart sellers early as they recognize they are about to get stopped out if they stay in. The slower players stay in until they are at breakeven, while the slowest and most stubborn bears stay in till they are stopped out.
EURJPY 5M Breakout Chart
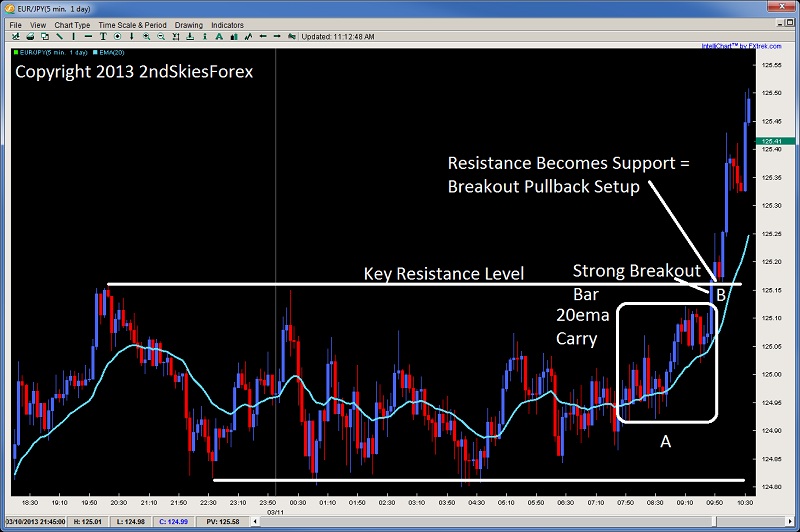
Using the chart above, we see the final stage of the breakout which is the 20ema carry in Box A. This “20ema carry” is a common price action formation prior to a good breakout, as it shows;
a) the mathematical representation of price gaining
and
b) gives bulls who haven’t entered a chance to get in prior to the breakout
This is followed by a strong breakout bar at B. This large bar should be curious, for why would bulls buy up so strongly heading into a resistance level if they were worried about sellers parked there. Usually, institutional traders can smell an upcoming breakout like this, so will push really hard to take out any stops as they go after the barrier.
A “strong breakout bar” is usually a really good sign the breakout will continue as it means stops were tripped above the resistance level, and price jumped aggressively in one bar. More ideal is if it has a good “clearing distance“, for if it does, then it increases the chances all the stops were tripped by going further away from the resistance level where most of the stops were near.
Tripping The Stops
It is this latter part – the stops getting tripped, which helps fuel the breakout even further, because those bears who were short now have to buy back, and this buying back to exit out helps further fuel the upside breakout. This is why if you ever watch the prices on your actual platform during a breakout like this, it generally reads (using 4 decimal places);
1.2999
1.3000
1.3001
1.3002
1.3003 (stops tripped)
1.3006!
You can always tell where the stops were parked and tripped, because price then jumps a few pips in a shot. The reason for this is – there were no sellers between 1.3003 and 1.3006, meaning the brokers could not print a price there since there were not enough orders there to hold that price. The stops being tripped at 1.3003 were sellers who now had to buy back, and when they did, they helped to push the next market price up 3 pips in a single tick or print.
When you see this, it usually means the breakout will likely continue – as long as you have done your pre-qualifying ahead of time.
One Final Note
Like all things, we have to pre-qualify a forex breakout using several price action characteristics ahead of time. The ones listed above are just a few of the ones we use in my Course, and there are several others which will clue you off and enhance the probability of the breakout being successful or not.
When you can pre-qualify them correctly, you will find breakouts quite easy to trade and accuracy levels around 60-70% as this is what my more profitable students are doing consistently just trading breakouts.
But, you have to pre-qualify them, like any price action setup. We never just trade them in isolation, as we are not pattern traders. We are price action traders, and we always trade setups & price action in context.
Any good system can perform badly without the proper context. Pin bars can be a highly effective system, if traded in context. But without understanding the type of trend, or volatility levels, you will likely lose money trading pin bars in isolation, even if you trade them at key chart levels.
Thus, we are never just trading patterns on a chart. We are always trading them in context, and this is exactly the same for breakouts, so always pre-qualify them ahead of time.
Look for the three characteristics above, try to trade them with trend more often then counter-trend, and you’ll find they can offer highly profitable trades, with some of the better reward to risk ratios out there, such as 3, 4, 5, or many reaching 7 or 9:1 reward to risk ratios.