I am going to start this article talking about one of the most important things developing traders will need to know – that is to ‘Know Thyself‘. This recently came up for me as a newer student sent me a few emails which made me realize how important this is for anyone starting on the learning process, but hasn’t found the right trading system to trade from every day.

First I will start off with the student of mine and how critical it is for the trading process. Then I will discuss the importance of this rule, how it relates to you, what system you decide to trade, whether it is price action strategies, or ichimoku cloud trading (or whatever), and how this applies to your trading.
I will end by giving the rule which should immediately follow this one, which, my guess is will surprise you.
How It Began
This student of mine (we’ll call him James), had signed up for my Price Action Course not too long ago and was definitely an eager beaver. He jumped right into the material, asked a ton of questions, and wanted to know the details of the systems inside and out so he could use them properly. So far so good.
He eventually decided on mastering one system which was an intraday price action system focused on the 5m time frame. For weeks, that was all he traded, asking questions each day, sending me screenshots of all his trades to make sure he did them correctly, etc. He decided to demo the system until he was sure he had it down. Again, so far so good.
However, this is where things got interesting. He was having trouble getting comfortable with the frequency of the system (active). After trading the system for a couple of months, he decided to move on to another system, this time on a slightly higher time frame (1hr).
Obviously it was less active, but still active enough throughout the week (on average – a trade a day). Again, he took the same approach – trade it on demo to learn it inside out. Interestingly though, the same thing happened again. He was making money with it, but still felt uncomfortable with it when it went for runners.

So what did he do?
He hired a programmer to write an algo for it. He thought maybe the problem lie in himself (it usually does) but that an algo would solve his problems. Remember his process which was the same at every turn;
1) choose a system
2) learn it inside and out
3) practice it on demo for a few months
4) makes money (key note), but was uncomfortable with the trading process
5) looks for another solution
It was the last two parts of his process where I started to question things. My golden rule is;
If it happens once, its an occurrence
If it happens twice, its a pattern
If it happens three times, its a program (or with humans, a conditioned response)
The Common Denominator
To me, something wasn’t quite right as he was making money with the systems (most people would be happy with this), but was still uncomfortable in the process and thus searched for another solution. I decided to see where this leads before making my suggestions.
After getting the system programmed, he decided to let it run. It started to lose money and he couldn’t figure out what was going on. He questioned himself, why he paid for the programmer, if he picked the wrong system to program, was it a bad time in the markets, etc. Turns out the programmer had made a mistake in the coding so the system wasn’t trading properly.
So what was his response? He emailed asking about my shadow system. This is the system I wrote about in Ode to The 4hr Charts.
Remember this one…whereby my student Tony traded one system, on one pair (AUD/USD) on one time frame (4hr charts – go figure). Tony did 110% on the year, was profitable on every trade for the last 2.5mos of the year, was about 60% accurate with his largest winner far larger than his largest loser.
It turns out James (looking for answers where to turn next) read this article and thought this was it. So he started asking me about it, emailing a ton of questions, a lot about performance, if he could learn it, what would it entail using this system, etc.

Now before we continue, lets map out his progression of the systems he has gone through;
-5m intraday reversal system
-1hr momentum trading system
and now, wants to learn the next one…
-4hr swing/trend trading system
Do you see the pattern here? Other than each system gets progressively higher on the time frames – there is no pattern. Its all over the place. There is no consistency in the style, type of system, time frame – nothing. The common denominator in this process is not the system, it is him.
Has this ever happened to you in your trading process, or is this happening to you now? Have you gone full polygamy on systems, that you’ve traded every time frame imaginable, every type of system imaginable, but still haven’t found your weapon of choice, one that performs the way you want it? What is the one root cause of all this?
Rule #1 – Know Thyself
As a trader, my job is to find opportunities in the market, exploiting my edge week in-week out, to make a living from this and profit for my clients.
However, as an educator, my job is not just to provide systems to students that make money. My job is to help them with the educational process (wherever they are at) and find a solution to help them turn the corner.
Considering very few students are the same, I have to find out what is their trigger, what is holding them back, and how they can correct their mistakes while strengthening their weaknesses. But, if there is one response I get a lot from developing students, it is this one to the following question:
‘What type of trading are you looking to do and what are you looking for in a system?‘
This is really a probing question to gauge where they are in the process and what will be their best path forward.
Can you guess what answer I get most often is?
‘I want a high probability system that consistently makes money every month with very low draw-downs‘
No shit, that’s what everyone wants. But here is the kicker…
What if I provided you with a system, which does virtually that, which made over 100% last year on one pair and one time frame.
But…(big but here), you had to hold a position for several days, perhaps over the weekend? What if that system only traded 8x in one month, or 18 the next, and you were not trading everyday? What if you had to go through a two month draw-down period, but would still do over 30-50% return on capital at the end of the year? Would you still want to learn that system?
If the answer is YES because all you care about is making money, then your not understanding rule #1 – Know Thyself.
If the answer is YES because you are comfortable holding positions for days, don’t want to trade every day, and are ok with having one or two months of draw-downs, then this would be a good system for you, because you understand who you are..
The same goes if your answer is NO because you want to trade everyday, and do not want to hold positions overnight, or over the weekend. That is being honest, and that is ‘knowing thyself’.

The Importance of It
Why is this rule so critical to your development and learning process?
Because your personality, style of thinking (left brain, right brain, whole brain, no brain, whatever), personal schedule, temperament, level of patience, etc. will all come into play when trading your system. If your allegiance is only to profit, this will become a problem.
Why?
If the system doesn’t match who you are as a person (style, temperament, schedule, etc), a tension will be there everyday which will eventually turn into a friction in your mind – like having a car which doesn’t fit your needs (2-Door Scion when you have 5 kids).
What good will it be, if you only have an hour to look at charts, and trading a system whereby you need to be at the computer for 3-4hrs at a time?
What good will it be to trade a system which requires you to wait for days to get a signal, when you have ADHD?
What good will it be if you do not want to be in front of the computer for hours, want more free time to enjoy life, yet have a system which you have to be there at certain times for hours on end?
It won’t.
By Knowing Thyself well, you can find a system and style of trading which matches best with you, your lifestyle and mentality. Perhaps you prefer trading with no indicators and want something simple and completely rule based? Then maybe you would want to learn how to read and trade price action.
Perhaps you are comfortable with more intricate systems, like ichimoku cloud trading. It doesn’t really matter what the system is, whether it has a 10%, 20% or 50% edge.
What matters more than anything else, is you find a system and style of trading that works best for you. And to do this, you have to start with rule #1 – Know Thyself.

Maybe it is not rule #1, which is certainly open for debate. But it is definitely up there in the top 5, and could be in a photo finish for first place. What matters is, unless you are totally settled into your system and consistently making money, you will need to start by knowing yourself – figuring out who that is, style of thinking, what is your current lifestyle, what kind of lifestyle do you want to have, and what systems will match up with this.
Once you have found this, then you can begin the journey by working with a mentor, and finding a system which suits you most.
I hope this helps and that you found it useful. I definitely look forward to your comments and wish you all the best in trading.
Kind Regards,
Chris Capre
Facebook: 2ndSkiesForex
P.S. Oh, I forgot to mention, the follow up rule which succeeds this one……is to ‘Forget Yourself‘. But this is a more advanced rule, which we will get into later.
Tag Archive for: price action
Here is a new trading video on how to spot key elements to enhance your counter-trend setups using price action triggers and reading the key price action elements.
In one of my most recent webinars on FXStreet, I talked about a key method for detecting when a trend is over-extended, which is to look for a climax or exhaustion reversal bar. I had mentioned how from an order flow perspective why these exhaustion and climax bars tend to represent a high probability reversal coming based on the various participants and how they tend to trade trends.
Before I get into today’s forex reversal pattern article which will be an expansion and amplification of this, to recap – the key things you want to be looking for in spotting these exhaustion and climax reversal bars are;
1) a bar that is much larger than the previous price action and ideally the largest bar in the move
2) it occurs at/near a key support or resistance level, or after breaking a key support/resistance level
3) it occurs after several bars have been trending in an impulsive fashion in one direction
Although there are other many subtle clues you can look for to amplify the possibility of these climax and exhaustion reversal bars, these are the three main ones you want to see in the price action to look for a trading opportunity.
The goal of this article will be to demonstrate a recent example of this, how you can trade these price action setups and what to look for from a price action perspective.
I will begin with an example of this in the DOW which gave a really good signal just the other day using this method. Then I will get into the anatomy from a price action perspective all the key characteristics to identify these bars. After this, I will discuss how you can trade these using price action with some simple rule based methods.
I will begin starting with the daily chart for the year in the DOW, the general uptrend, how it found a key resistance, and then look into the 4hr time frame to show how price action reacted after breaking the key level.
The DOW Hits Key Resistance
In the chart below, notice how price has a very stable relationship to the 20ema and dynamic support. It rejects off of it three times before finally breaking below it. But when it eventually does, it quickly jumps back above it, telling us buyers are still interested in driving this pair higher being happy to scoop this up on pullbacks.
Price action then forms a triple top just shy of 13300 which is the first time the entire year it needed three attempts to break a key level, suggesting there is possibly over-extension in the trend along with some sellers who are willing to hold a line the bulls cannot penetrate.

In the next chart below, starting with the top left of the chart, we can see how each pullback from the triple top (save the last one) created a pin bar off the 20ema (bars 1 and 2). This was suggesting the buyers were happy to get back in on the pullback, but still could not break the key resistance just shy of 13300. Price then sold off aggressively for the first time all year, dropping over 500pts in about 6 days.

After finding support at a prior pullback level, price resumed the uptrend. Notice how as it came up to the resistance level that formed the triple top, it formed a doji and inside bar suggesting hesitation for two bars in a row.
If the inside bar had formed after a strong bull bar, it would have suggested a little more strength and possible breakout. But the hesitation from the day before, combined with the inside bar communicated two days of hesitation and an inability of the bulls to take out a key level.
Now on the next day, price does break above the key level forming a new high. But this ends up failing intraday, then pulls back below the resistance level along with producing a range bar.
One should notice how the rejection to the topside is equal to the downside suggesting false break as a) price failed to hold the gains, and b) there is an equal balance between the buyers and sellers. Ideally, we’d have a very strong imbalance between the buyers and sellers when looking for a breakout, but we are not seeing that in the chart below.

Anatomy From a Price Action Perspective of Exhaustion/Climax Bars
Now that we have highlighted a potential area of contention, I am going to zoom into the 4hr chart to show the exhaustion or climax bar specifically, break down the anatomy of it from a price action perspective and then talk about how you can trade this setup.
Beginning with the next chart, the first bar to concentrate on (which should naturally stand out) is bar 1 – the breakout bar which is the largest bar in the entire series. Up to this point, we can see consistent buying all the way up to the resistance level with the bulls dominating price action winning 25 out of the 36 candles (69% bull-bear ratio) up to the breakout bar which is bar 1.

Now if you remember from the very beginning of the article, an exhaustion or climax bar will generally mark long or over-extended trends. These bars should have the following characteristics;
a) the largest bar in the series
b) occur near key support/resistance level or on the break of one
c) occur after several bars have
Why do these bars tend to be so large?
When trends are over-extended, they have had a lot of time to attract various players into the market, with the institutional players being first, the more advanced players who sniff out the new trend second, and the retail traders third. The retail traders tend to be last as a whole because they need the greatest confirmation to enter a trend (generally).
By the end of a trend, as the retail traders get in, you have the greatest imbalance between buyers and sellers. Those who have not profited from the trend will often chase it feeling like they have to make money on this move by buying breakouts instead of pullbacks. Additionally, the institutional players will try one last push to get as much out of the market as they can – thus producing a climax or exhaustion bar.
Sometimes, this has an additional purpose of not just squeezing out the most of the current trend, but trapping new traders long into the market so when they exit, they can also look at reversing the market using those trapped to fuel the upcoming sell-off.
This is why these bars tend to be larger than usual and the largest in the series. They will also occur at key levels, especially on breakouts which helps to further trap traders who bought on the break. So hopefully this explains the basic anatomy of these moves.
Now getting back to the chart, if price action had maintained the breakout and held above the key resistance level, along with extending the gains, then it would communicate the breakout will continue. But look at the next bar (bar 2) and how price action responded. Notice how it immediately reversed back below the resistance level which was definitely a warning sign the breakout could not hold the gains.
In these circumstances, you have to ask yourself;
if the bulls were in control, how come they could not extend the gains?
Where did they go?
How come such a strong bar did not extend price further?
Why did sellers immediately push back?
Why did the resistance level not hold as a breakout pullback level?
All of these questions should have immediately come into mind because they held the key to whether this was a legitimate breakout or a false break.
But even if you did not ask all these questions, all the ingredients for the exhaustion or climax bar was in play telling you this was likely the end of the move. Even after bar 2, notice how price then treated the resistance level not as support (continuation) but as resistance (false breakout). Again, go back to the questions and the breakout just doesn’t add up. So we have a textbook example of an exhaustion or climax bar.
How To Trade This Price Action Setup
Usually in an uptrend, I’ll look for a second attempt at the key level or a LH (lower high) before attempting to reverse a strong trend. For those wanting a secondary entry, you’d look for a pin bar, engulfing bar or outside bar, then consider taking it in combination with the exhaustion or climax bar. But the price action should already show weakening ahead of the exhaustion before letting you know the offers will hold.
Most often with exhaustion moves, there will be a second failed attempt either at the key level, or producing the lower high giving you the final confirmation the exhaustion bar is in place and it is time to reverse.
Depending upon which of these situations will present itself will determine how I get in, but if I see any of them and they have all the ingredients, then I’m going to sell that looking for the market to reverse heavily since the trend has become over-extended. Either it will retrace a good portion of the move, or it will consolidate before making a new leg (up or down).
Now looking at the chart below, although we had in bar 2 a solid bear bar, it barely took out 50% of the gains in the exhaustion bar. Generally I’d want to see 60+% of the prior bars gains taken out before feeling like the bears are mounting a good attack and thus look for a reversal. If I fail to see this minimum push-back, I will stand aside and wait for another trigger.

Even though this threshold was absent, if you notice bars 3, 4 and 5, they all were being held in check by the level which was the key breakout level, suggesting the market was using this as resistance. If it was a trap, price would not have made its way to the 20ema (so far away) nor kept producing small candles below this level (should have been above the level). However, none of these were in place.
The most aggressive entry would be to sell after candle 3 or 4 closed.
Why?
They were weak candles after a strong selling candle just below resistance telling us the buyers were not pushing back with enthusiasm. This would be one way to get in to this with a stop minimally above the highs of these candles and possible higher.
Another entry would have been to sell below the low of candle 3, or on a close below candle 3 with a stop above the high of candle 5 if it had made a break above the resistance level (which it did in this case, but will not always be the case).
The advantage of selling below the low of bar 4, or on a close below bar 4, is at this point, any traders who are trapped long are starting to exit their longs as the losses are starting to mount and increase since they are below their entry. If candle 5 does not have a wick above the breakout level, then the stop has to go above the level minimally, but better to have it above bars 3-5 or possibly higher.
One conservative entry would be to wait for a breakout pullback to the 20ema treating it as resistance (not support) suggesting a new relationship to the 20ema. There are also a few other methods to get into these reversal moves, but these are a few which should give you a good start to trade these setups on exhaustion or climax bars.
In Summary
The goal of this forex reversal pattern article was to demonstrate from a price action perspective how exhaustion or climax bars can and will often represent the end of a trend and what key characteristics you will want to find in these bars. We went over a really good example of this in the DOW showing how all the ingredients were present, what to look for and how you could identify them. Then we ended by giving you a few methods to trade these price action setups and find either an aggressive or conservative entry along with what to look for.
I hope you enjoyed this forex price action trading article and found it useful in helping to identify exhaustion and climax bars and how to trade them.
Please make sure to comment, along with sharing the article by liking and tweeting it to pass it on.
For those wanting to learn rule based price action systems and reversal bar trading techniques, access to the traders forum, lifetime membership & more, check out my Trading Masterclass Course.
Kind Regards,
Chris Capre
2ndskiestrading.com
Facebook; 2ndSkiesForex
Have you ever tried to trade engulfing bars? Maybe you are currently doing so?
How has that been working out for you so far? A guess would be not so good.
There is a reason why your engulfing candle trading strategy isn’t working.
A simple but powerful truth the so-called price action authorities out there won’t tell you. A truth that reveals trading engulfing bars or any other one- or two-bar reversal pattern for that matter, not only puts you at a great disadvantage in the market, but it also has a very negative impact on your trading performance.
Now you must be asking yourself, if trading engulfing candles is a sub-optimal way of trading, why do so many price action sites and teachers market this way of trading as much as they do?
The reason behind that is very simple. The whole concept of trading simple 1- or 2-bar candlestick patterns from key support and resistance levels is very easy to understand, teach and learn. Thus, it is also very easy to market and sell to any new retail trader entering the trading arena.
Most retail traders come to the markets with unrealistic expectations and are therefore extra vulnerable to the “quick fix” trading approach these patterns offer. “Trade X, Y and Z patterns at A, B and C spots in the market and you’ll be making a lot of profit in no time.”
Other reasons this concept is so attractive for beginning retail traders is:
- a) It gives the trader a clear “signal” (reason) to enter the market which means less headache/work for the trader.
- b) It gives the trader a false sense of “confirmation”. A way of “confirming” the validity of a level creating the illusion of certainty.
This is of course a myth which we’ve discussed in earlier articles such as this one.
Keep in mind, quick and easy processes rarely lead to high quality results. More often than not, the output equals the input.
Before we go deeper into why trading engulfing bars puts you at a disadvantage in the markets, we have to give a very simple definition of the engulfing candle pattern.
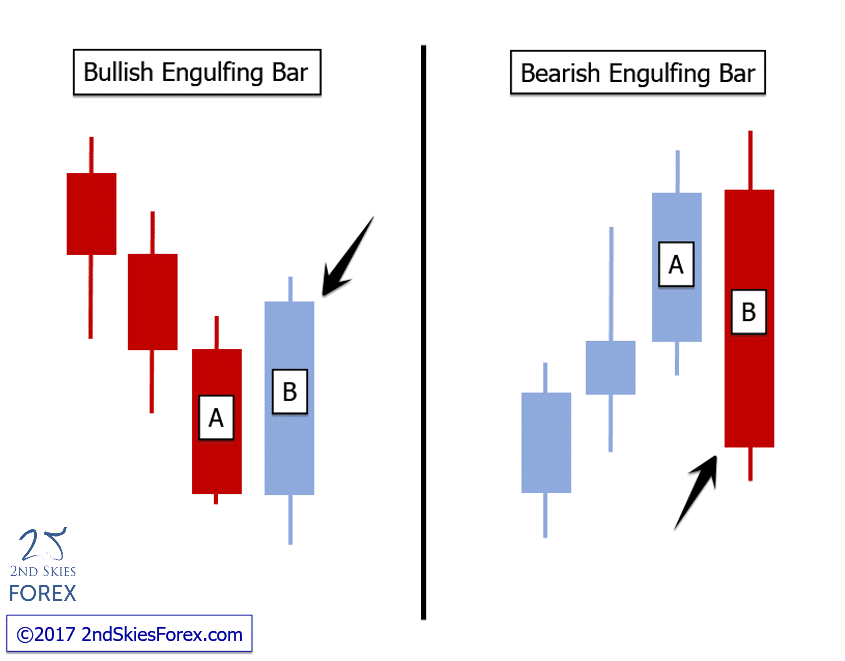
For a bearish example of an engulfing candle pattern:
The A bar is a bullish bar (bar that closed up) and the B bar is a bearish bar (bar that closed down), whereby the high of the B bar is above the high of the A bar, but the close of the B bar is below the low of the A bar. If the low of the B bar is below the low of the A bar, but closes inside the price action of the A bar, then it is an outside bar pattern which is a different reversal pattern.
For a bullish example of an engulfing candle pattern:
The A bar is a bear bar, and the B bar is a bull bar, whereby the low of the B bar is below the low of the A bar, and the close of the B bar is above the high of the A bar. If the high of the B bar is above the A bar, yet the B bar closes inside the price action of the A bar, then it would be a bullish outside bar pattern.
Below are two visual examples of Bearish and Bullish Engulfing Bars:
Now that we’ve established what an engulfing bar is, let’s take a look at why using engulfing bars as a “signal” and/or “confirmation”, is a sub-optimal way of trading and puts you at a disadvantage.
Professional traders do not trade based on any kind of 1-2 bar candlestick patterns, why should you?
There is a reason professional traders make money, whilst the majority of retail traders don’t.
It can also easily be said that when retail traders are getting in the market, professional traders are already in profit.
Why’s that?
Let’s look at an example using a chart to illustrate this.
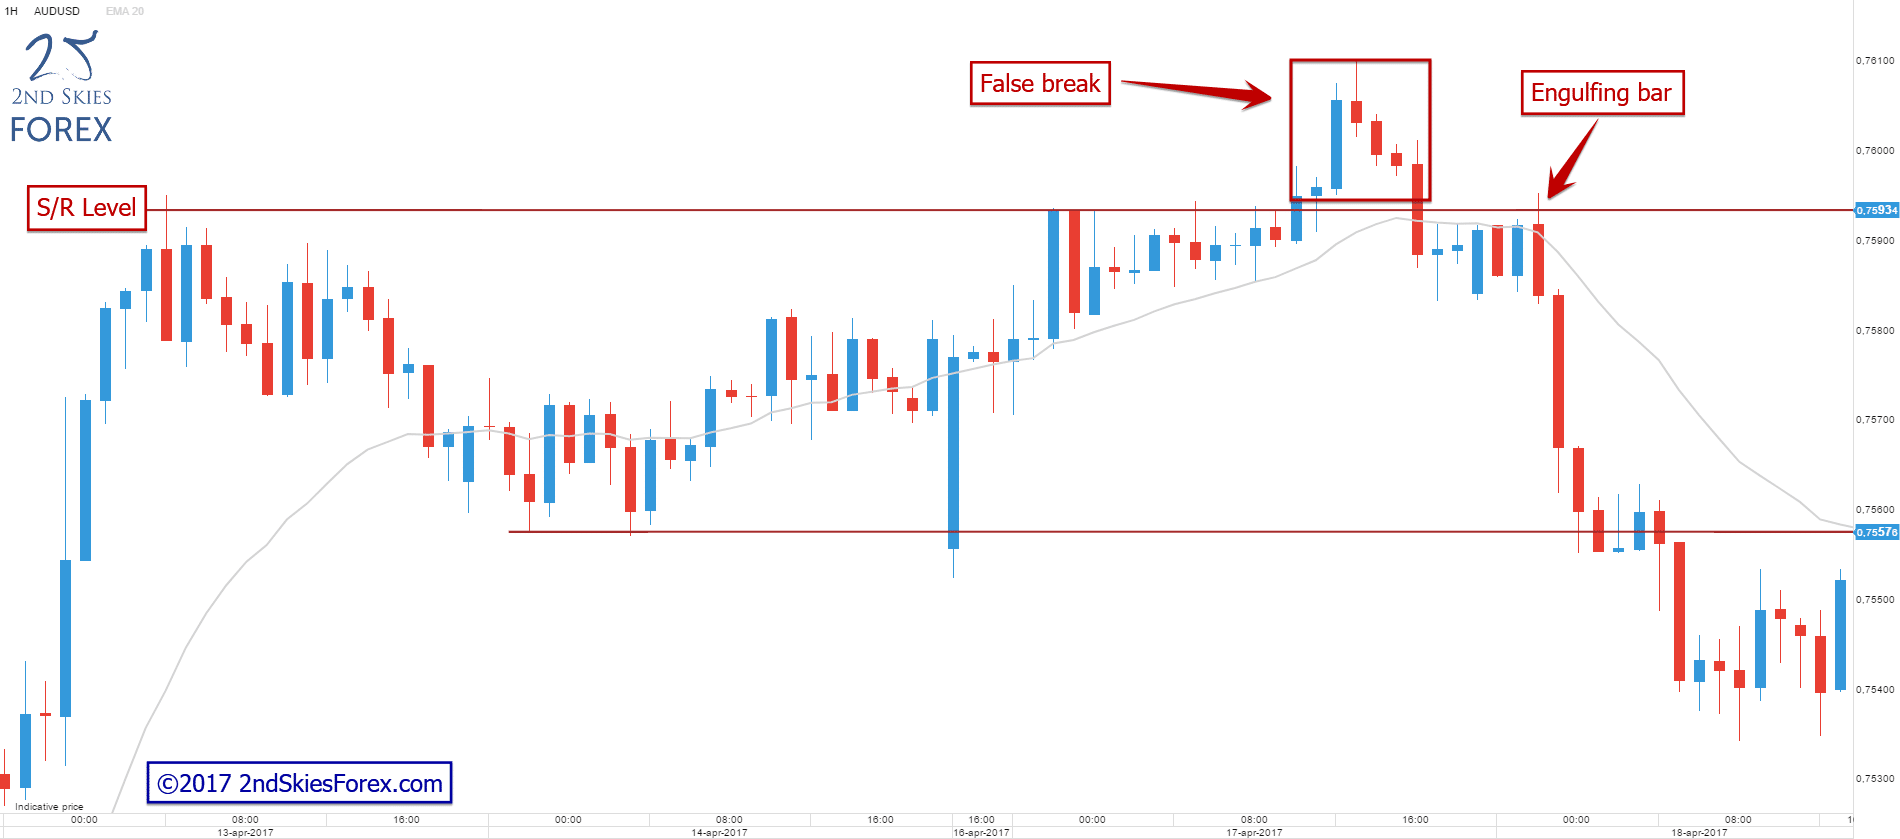
Below is a 1 hour chart of the AUD/USD in which we can see a short-term resistance level that rejected price followed by a breakout and false break. Price then came back to re-test the level again and formed an engulfing bar.
Now, there are two ways to trade these engulfing bars according to the majority of candlestick teachers/sites.
- a) Enter at the break of the low of the engulfing bar, or…
- b) enter on a 50% retracement into the bar.
Let’s assume we trade this engulfing bar the way it’s taught by most and compare both types of entries to a professional way of trading the same level. We will use the same stop loss- and target location in all three examples.
First out, the trade entering on a break of the low of the engulfing bar. The stop loss is placed at a healthy distance above the resistance level.
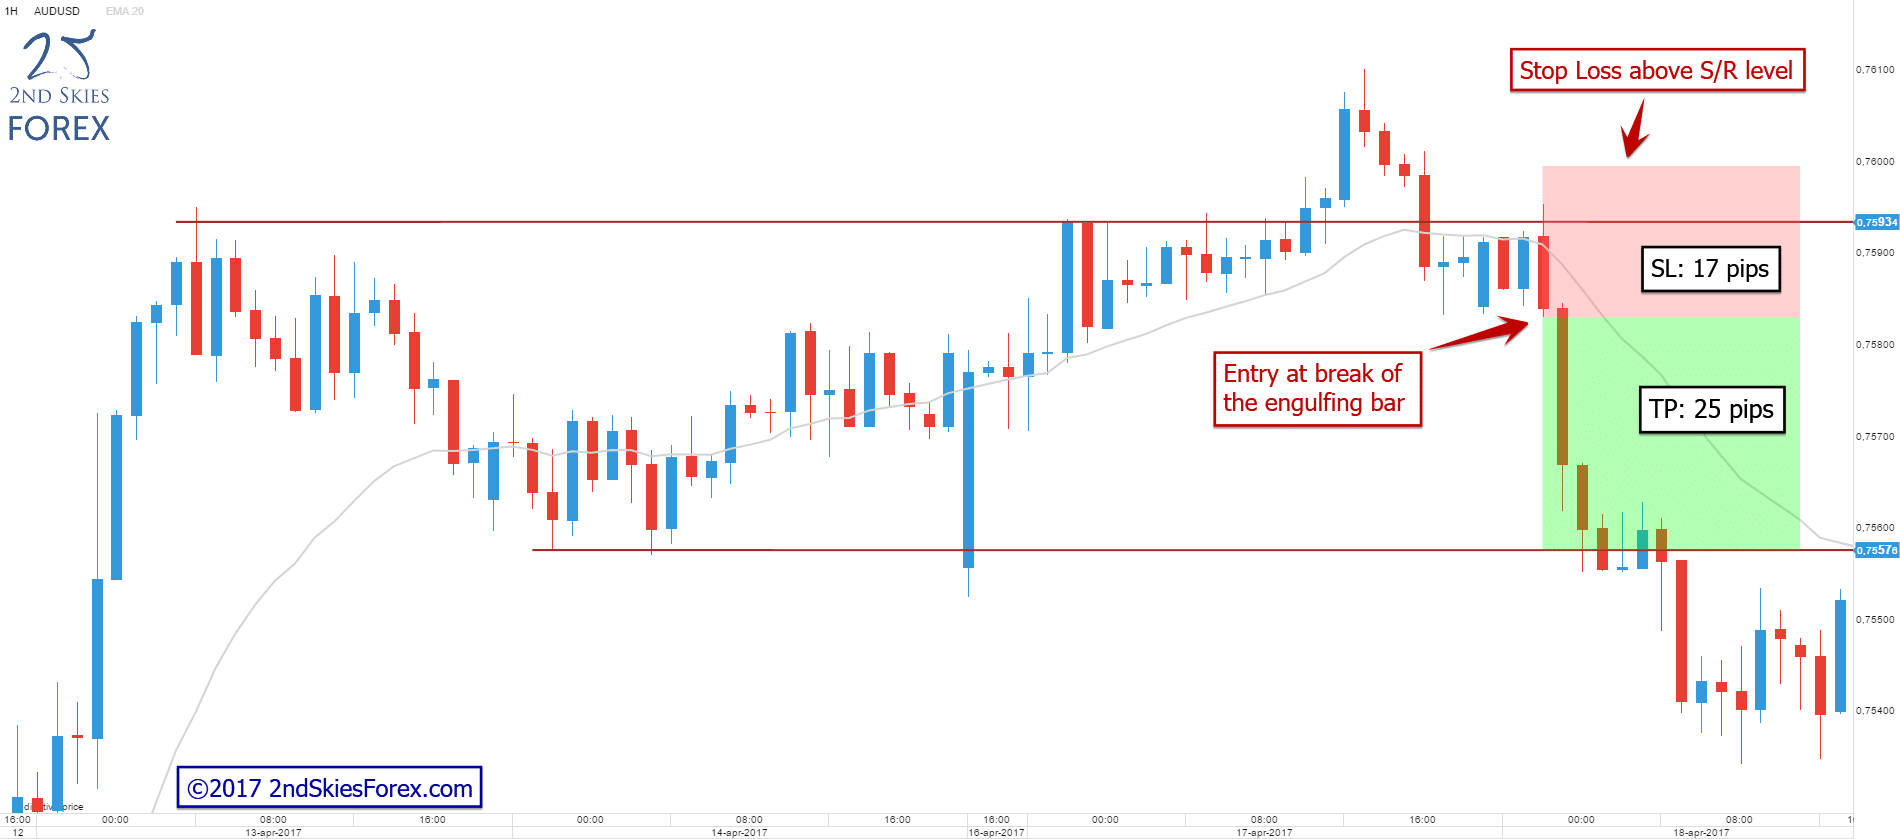
As you can see from the screenshot, this trade would have a stop loss of 17 pips and a target of 25 pips resulting in a potential +1.47R
Now, this is how a possible 50% retrace entry would have played out not changing anything but the entry location.
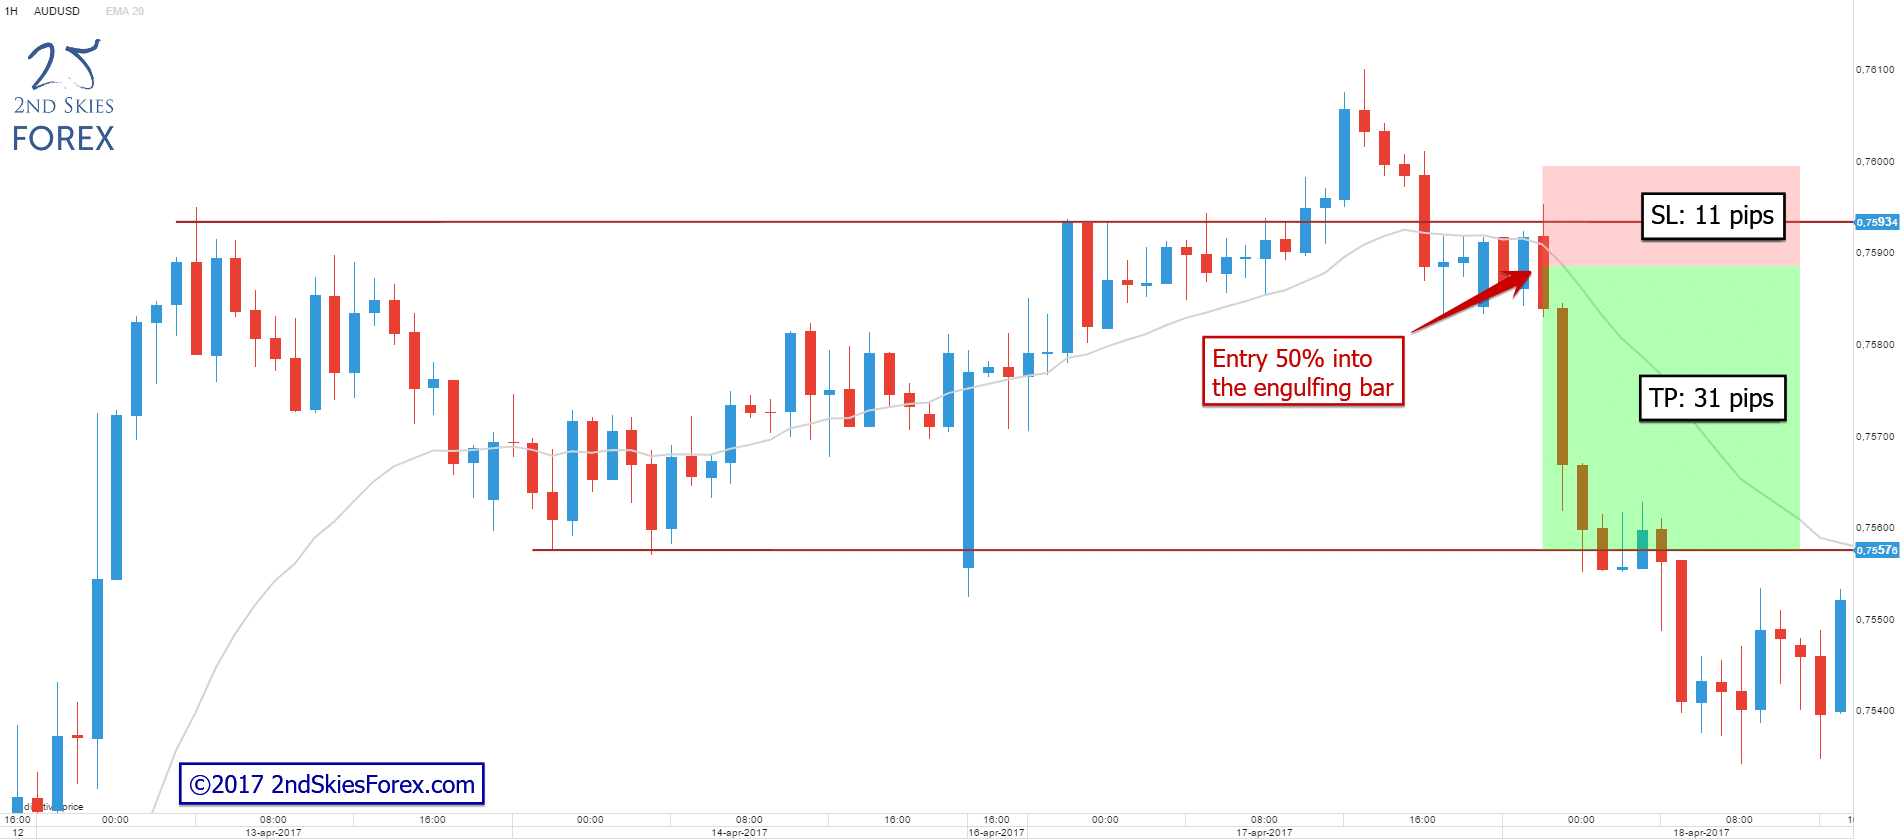
In this example price never retraced back into the bar and continued to sell off. Using this approach, we would have missed out completely on this trade opportunity.
For the sake of this comparison, let’s assume price did pull back to the 50% mark into the engulfing candle. We then would have had a stop loss of 11 pips and a target of 31 pips resulting in a risk/reward ratio of 2,81R.
Not bad, almost a 100% improvement in risk vs. reward.
Let’s compare this to taking the trade directly off the resistance level, again, leaving the stop loss and target untouched.
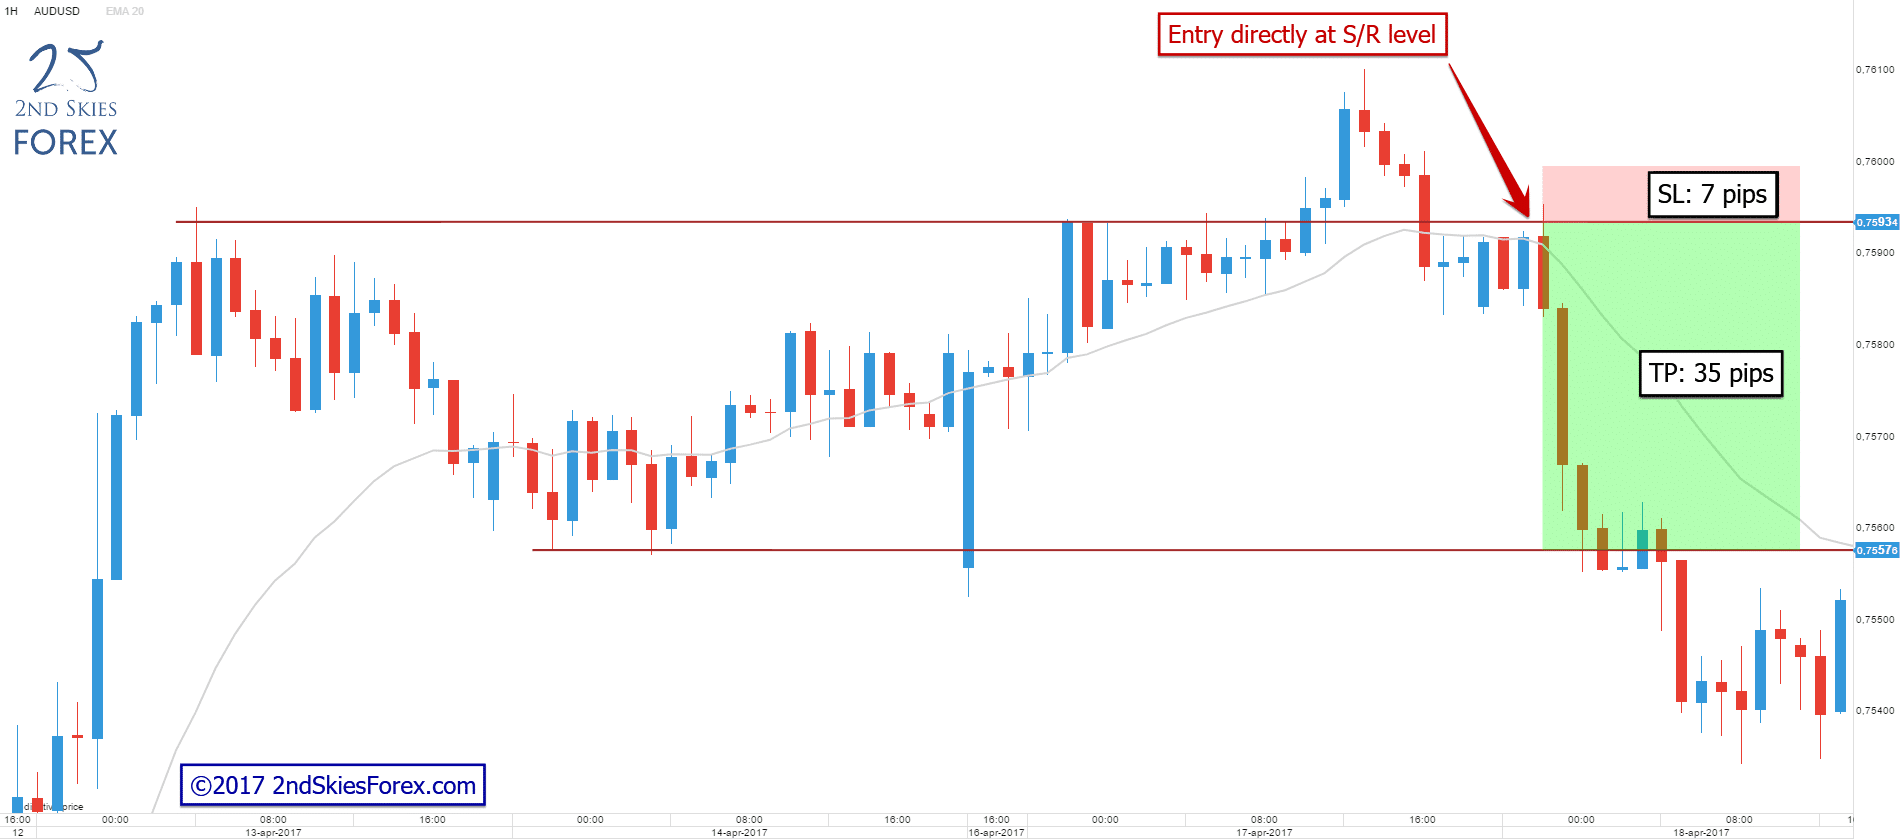
This is where it gets interesting. This trade would have had a stop loss of only 7 pips and a target of 35 pips, resulting in a risk/reward of 5R(!).
This fact alone should make you raise your eyebrows and realize that using engulfing bars as a way to enter gives you a sub-optimal entry at best.
Now, most engulfing bar traders would argue that using engulfing candles as “confirmation” of a level increases their win rate (which isn’t true!). But, for the sake of the argument let’s play with the thought that it is and give the engulfing bars a +20% higher win rate.
To be able to compare the 3 different examples above in detail, let’s put the numbers against each other over a 100-trade sample size.
Example 1 – Entry at break of engulfing bar:
Entry: 0.75830
Stop loss: 0.76000 (17 pips)
Target: 0.75580 (25 pips)
# of trades: 100
Win rate: 60%
Losing trade: -1R
Winning trade: +1,47R
Calculation: 60 x 1,47 + (40 x -1,00) = 48,2
End Result: +48.2R return over 100 trades
Example 2 – Entry at 50% retracement into EB:
Entry: 0.75890
Stop loss: 0.76000 (11 pips)
Target: 0.75580 (31 pips)
# of trades: 100
Win rate: 60%
Losing trade: -1R
Winning trade: +2,81R
Calculation: 60 x 2,81 + (40 x -1,00) = 128,6
End Result: +128.6R return over 100 trades
Example 3 – Entry at S/R level:
Entry: 0.75930
Stop loss: 0.76000 (7 pips)
Target: 0.75580 (35 pips)
# of trades: 100
Win rate: 40%
Losing trade: -1R
Winning trade: +5R
Calculation: 40 x 5 + (60 x -1,00) = 140
End Result: +140R return over 100 trades
Comparison
Entry at break of engulfing bar (win rate 60%): +48,2R
Entry at 50% retracement into engulfing bar (win rate 60%): +128,6R
Entry from S/R level (win rate 40%): +140R
These numbers should put this discussion to bed once and for all. Why?
Engulfing bars won’t increase your win rate by 20%. Even if they did, the best entry option of the two engulfing bar examples would still produce less profit compared with our entry at the level.
On top of this there are even more things to consider…
- You will not always be presented with an engulfing bar at your chosen support and resistance levels which further works against you.
- It will render you passive when perfectly good trade opportunities present themselves.
- You’ll sit there waiting for a pattern to emerge only to see the move play out in front of your eyes (a move which professional traders are profiting from).
To summarize
Using the engulfing bar “confirmation” to enter trades is a sub-optimal way of trading, working heavily against your overall trading performance by:
- Decreasing your trading opportunities drastically and reducing the number of times you can apply your edge in the market.
- Giving you a worse entry.
- Increasing the size of your SL.
- Decreasing the size of your target.
Engulfing bar traders only have one argument to counter the above. They claim that trading using engulfing bars increases their win rate and thus makes up for the drawbacks mentioned above. Even if that was true (which it is not), the so called “blind entry” still performs better as shown in our calculations above.
By looking at this objectively and comparing the numbers we can see that trading using engulfing bars is a sub-optimal way of trading. The only reason it is so widely spread throughout the retail market is because it makes trading easy, plus the “confirmation” part caters to the lack of trust beginning traders have in the markets and their own trading.
So, the differences between a professional trader’s entry and a retail entry should be very clear by now. Especially with all the other content we’ve posted before.
If you want to continue to have sub-optimal retail entries, then you can use the forex engulfing candle as tool to trade the markets.
If you on the other hand want an entry location that gives you a lot more trading opportunities along with a better overall performance, then you’ll want to adjust your trading method.
This is what we teach in our price action course. Now, if you found this article useful, please make sure to like, share and tweet it below, and we’d love to hear from you what “a-ha” moments you have from this article.
So, please come over to see more content like this on our website at 2ndskiestrading.com where all the discussion is happening and leave your comments there.
But thank you for reading this forex engulfing candle article from 2ndskiestrading.com, where we teach you how to increase the way you trade, think and perform.”
Now that you’ve read the article and had a chance to analyze the two methods and how they perform differently, which one wins?
What do you think? Please share and comment below.
I have been working really hard lately on my upcoming book ‘Trading Price Action‘ which I am seriously looking forward to finish and deliver to the world at large. Currently I am dissecting a chapter on pattern recognition and came across this interesting chart. In trading, we often look for fixed patterns we are trained to see, such as;
Inside Bars
Pinbars
Outside Bars
etc.
Although this has its benefits to spotting key formations in the market which can lead to good price action setups, we can actually get stuck into a routine of just looking for patterns with relatively fixed variables. This can actually hinder our overall pattern recognition skills to spot newer patterns and this is one of the most important skill sets of a trader – pattern recognition.
I have talked about methods to build this pattern recognition ability, such as brain gyms, like Lumosity as a way to build up the neural connections and spot patterns more easily in the market as one method. Another is going back and looking at historical price action, and in I thought this would be a good exercise for you to work on a particular chart I am writing about in my book.
The Exercise
First off, you will need a watch or a something that keeps track of time as you will want to time yourself on this. If your phone has it, set the stopwatch feature whereby you hit go, and it starts counting the time. For this forex pattern recognition quiz you will also need either a sheet of paper and pen, or a word document open to type your answers.
What you are going to do is for the next several minutes (as much as you need) look at the chart below and tell me what patterns you see in the market. Not what kind of bars you see, (pinbar, inside bar, etc.) as that does not take too much skill and is something that can be easily learned. Practicing something that is easily learned does not breed new neural connections which is what we want to do here.
What you are looking for is patterns in the price action behavior, what do you notice about the price action, what patterns are you seeing that repeat themselves. There are actual behaviors in this chart you are about to see that repeat themselves. This is what you are looking for – patterns in the behavior. They can be of any kind, but ideally, the ones you find that are most useful for trading.
Remember, if something happens once – its an occurrence. If it happens twice – its a pattern. If it happens three times, its a program derived from minimally one pattern. So what you are looking for is anything that repeats itself 2x or more. Thus, take as much time as you need.
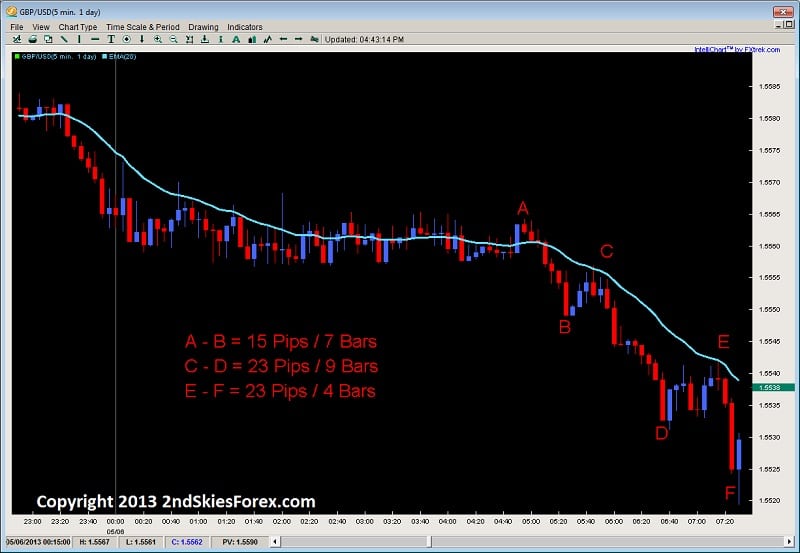
Write down or type all the patterns you can find in this chart. I am going to cover up the name of the pair, and the dates, but I will tell you what the time frame (1hr chart). There is one line on the chart which is a 20ema which can be used if you so wish in your discoveries.
Keep in mind, I have gone back anytime in the last 30yrs to find this chart, so even though the prices may seem like they offer a hint, there are a lot more possibilities of pairs that had these prices so try not to think about the pair. You are just looking for patterns in the price action behavior.
With that being said, get your stopwatch, pen/paper or word document open. As soon as you begin, start your stopwatch and begin to write or type as many patterns as you can see. Once you are done, then mark down the time as you will need this later.
Ready? Begin with the chart below.

Ok, now that you are done, make sure to write down the time and how long it took you to find all the patterns that you did.
The next step is to look at all the patterns and price action behaviors, then come up with a few strategies based on what you noticed. This is because I am going to show you the very next candle in the chart, and if you really did a good job at isolating some key patterns, you probably have at least one strategy for the next candle (regardless of what it is).
Once you see the following chart with the next candle in this series, the go back to your list of strategies, and decide what you think is the most appropriate for the new candle. Make sure you have written all the rules for the strategy, such as your entry, stop and limit. Position sizing is not important – just that you can isolate a pattern, make a trading strategy off this, then apply it on the next candle.
Ok, so you should have all your strategies and rules in place for taking (or not taking) a trade on the next candle, which you will see in the chart below.

So this is the chart one bar later. To make it a little easier for you to make a decision, I have decided to provide the data on the last blue candle with the black dot above it which has the following pieces of data;
Open: .8275
High: .8285
Low: .8260
Close: .8280
One more piece of data, the low on the red candle prior was .8259.
So armed with all that data, along with all the patterns you recognized in the price action, and with the strategies you came up with, take a moment to figure out what is the best strategy to trade this blue candle. You can either decide to;
a) trade this blue candle
or
b) not trade this blue candle
If you decide to do A and trade this blue candle, then what you are going to do is decide what is the best strategy to trade it. This means having all the rules for entry, along with placing your stop and limit. Now here is the kicker;
Whatever strategy you use, has to be out of the position in 3 candles.
Why?
Because these are the last 3 candles for the week, and the market will close for the weekend which is also a holiday weekend and there is a G20 meeting which will have a major impact on the market.
So, that is the challenge. Come up with a strategy that you think is best to trade this pair now that the blue candle is closed. You have to be out of it in three candles so you can be out for the holiday weekend, hopefully in profit with a smile on your face.
With that being said, I am going to post the next three candles tomorrow on the following page around this same time;
https://2ndskiestrading.com/strategies-for-forex-trading/forex-signals/
You will want to look for the post which will be called ‘Forex Trade Signals and Setups Feb. 21st‘
In this post I will provide the chart with the next three candles, and then you can compare how your strategy did and share with me what your strategy was, rules for entry, stop and limit, and what the final result was.
What I am going to do is share with you my strategy, what patterns I isolated to come up with it, and how it played out. I will give you a few details ahead of time, but want to explain the background to this challenge:
I came to this chart as I was doing some practice through my charting program, which will take any pair, hide the dates, the actual pair, change the numbers on the prices, but will correlate them to the real historical price at that point in time.
Then what it does is challenge you to trade that chart in that point in time bar by bar. If you want to trade at the end of the bar, you do, if not, you don’t. It does a very good job at giving you real practice in reading price action because you are trading bars as they come in real time, just like real trading.
Sure, its not real money, but the point is to learn to find patterns in the price action which is a great exercise to do, especially when the market is closed on the weekends.
Now here are some points I’d like to share;
1) When I started looking at this chart, in < 1 min, I was able to isolate 4 key patterns, even though there were many more
2) from these 4 key patterns, in < 1 min, I was able to come up with a trading strategy for the next bar if it had certain characteristics
3) with this new blue bar, I was able to trade it having a R:R ratio of 3:1 based on the strategy I came up with
And I will leave you with that for now. So make sure to come back tomorrow to the link I shared above, to see the next 3 bars, and how your strategy did. Then make sure to leave a comment how your strategy did, what was the entry, stop and limit, or if you didn’t trade at all.
Remember, there are no points for cheating, so only honesty here. It really does nothing for your trading process if you are;
a) not honest, and
b) only try to inflate your ego by looking cool on this post
Remember, in a week or two from now, this post will rarely be seen, and nobody will really care how you did so skip the ego part of trying to look cool, and just be honest with what you did and how it played out.
The whole point of this forex pattern recognition quiz is to be an exercise whereby you;
a) test your pattern recognition skills
b) see how quickly you can come up with the patterns
c) see how quickly you can formulate a strategy (or strategies) based on the patterns you noticed in the price action
This is about as close to what you are doing in real trading – spotting patterns, finding opportunities, and trading the right edge of the charts as they come to you, bar by bar. You have to make decisions based on what you see and what you think will happen.
But in reality, nobody knows what will happen with the next bar – and that is the friction we all love (or dislike) in trading. Its the mystery, of what will come next, of not knowing, but seeing if we can find the answer ahead of time by being a detective and looking at all the available clues. Some of us are closer to Sherlock Holmes, and others are closer to Inspector Clouseau.
Regardless of where you are at, the mind has a neuro-plasticity to it which means you can learn to be an expert in spotting patterns and key price action clues from charts just like these. In an article I will write on this Thursday, I will discuss some key things you can do to improve your learning process, so you can enhance your pattern recognition skills, along with tailoring your educational process to help accelerate your learning curve to trade profitably and successfully.
I look forward to your responses tomorrow.
Kind Regards,
Chris Capre
Twitter; 2ndSkiesForex
If you liked this article, make sure to click the ‘Like’ button at the top of this article 🙂
And also check out my latest article called Ode to the 4hr Charts whereby I share an entire years trading report of one my students and how they made 110% in year, just from learning two of my strategies.
I want to share with you some results and tell me if you think these would be considered professional grade, or highly impressive to say the least;
110% gain for 2011
124 Trades, 74 winners, 50 Losses
59.67% Accuracy Rate
Largest Win: $14,360
Largest Loss: $8,180
Max Win = 43% larger than Max Loss
Max Consec. Wins: 16
Max Consec. Losses: 6
Max Consec. Win Streak 2.66x Larger Than Max. Consec. Loss Streak
Largest Trading Position: 1M
Overall, this could make the grade for a professional trader. In fact, I know many that did worse (a lot worse) then him and would be happy with his results.
The 4hr Charts
There has been a lot of talk and garbage being spoken about trading off the 4hr charts, how its trading as a hobby, how you’ll only be an amateur, how if you want to be a professional trader, you need to trade off the 1m, 5min, 15m, smaller time frames. Ridiculous, but we are going to demonstrate why.
I’ve been wanting to show people the power of trading the 4hr time frames for a while. Although I have many students doing it, nobody is solely trading off the 4hr. They usually add the daily, or 1hr and have a mix of time frames and systems. In comes Tony.
Do you remember Tony? I wrote about him in the Pyramid of Trading article whereby I talked about him back in early Oct. At that time he was up 76%, and ended the year up 110%. Meaning, he gained another 34% in the last three months – impressive to say the least.
Tony had one thing going for him which was the best edge one could have – discipline. Tony had very little experience, no business/finance degree, just a desire to learn, patience and discipline. He came to me in late 2009 wanting to take some private mentoring sessions.
I taught him less than a handful of systems which he learned well and practiced on in 2010. By the end of the year, he settled on his two favorites:
Price Action
& my Shadow System.
He learned his risk parameters, his style, how he wanted to trade, what was the best pair for him, then went for it. He settled on trading the AUDUSD only on the 4hr time frames using those two (Price Action & the Shadow System).
I am going to show you his entire trading report, which averages about 10-12 trades a month with the max being 16 and the least being about 8. You already have the stats above so lets show you the entire trade history for 2011. I have covered his personal details and acct number to protect his privacy, but all the trading is there which you can see below.
Screenshot 1

Screenshot 2

Screenshot 3

Screenshot 4

Screenshot 5

Screenshot 6

So there you have it, an entire year of trading. To recap his performance;
110% gain for 2011
124 Trades, 74 winners, 50 Losses
59.67% Accuracy Rate
Largest Win: $14,360
Largest Loss: $8,180
Max Win = 43% larger than Max Loss
Max Consec. Wins: 16
Max Consec. Losses: 6
Largest Trading Position: 1M
This should finally put to rest the ridiculous talk and idea you only have to trade one time frame or smaller time frames to be a professional or highly successful trader.
All of this is thanks to Tony for sharing his results with me. He traded only on the 4hr time frame for an entire year. A lot of his trades were done in a day, but many went a few days, with several going 4-6 days holding time. All he traded was Price Action and my Shadow System on one pair for an entire year. Disciplined, patient, and highly profitable.
How many educators show results from their students, especially of this caliber? I believe I am one of the few, and Tony will not be the last. Maybe the next person is you – hopefully it is.
To also separate myself and end the debate, at the end of this year, I’ll show you audited results from an account I opened up just to demonstrate I am not just a good teacher, but a good trader as well. I will publish the audited results from a professional accounting firm, on my site so you can all see I am the real deal.
I have no idea how i’ll end up for the year, but whatever it is, you will see it. Even though my fund has an 8+yr audited track record (which should be proof enough), this will settle it, as it will only be my trading, only me pushing buttons, not anyone from my trading team, or any account from my fund. Just my own individual account opened just for this. This should end the debate. Hopefully then I can stop answering questions about my legitimacy, focus on trading, and teaching people who are serious about learning to trade successfully.
There are 3 things I live and breathe every day and have been for over the last 10yrs;
Yoga
Meditation
Forex Trading
I make my living and have been for almost a decade from trading. I study it every day and every moment I can get a chance. The only thing that is right up there with the three things I listed above is Teaching People to Become Successful Traders. I’ve seen every kind of trader you can imagine (from time frame to profitability), and there is no one person who holds the monopoly on the truth of trading and the learning process.
And to the rest of you with open minds and a serious desire to learn, this demonstrates you can be a profitable and highly successful trader, regardless of your time frame, system or background. With the right effort, discipline, and patience, you can be a profitable and successful trader as well.
Ode to the 4hr Charts and profitable trading.
Kind Regards,
Chris Capre
2ndskiestrading.com
Twitter; 2ndSkiesForex
One of the questions I get most often about reading price action has to do with breakouts.
How to spot them?
How to know when it is a false breakout?
How to get in after it’s already broken out?
Ok, i’m in one now, how do I know it’s for real?
It is the last question we are going to focus on – how to determine if the breakout you are in is for real.
Over a series of three articles, we are going to cover 3 key elements to a breakout, dissecting the anatomy of a breakout such as;
what they should look like
what you will want to see
and what are the key characteristics of them.
By learning to read these price action patterns or elements inside a breakout, you will get a more unique grasp of how to understand breakouts. This can be done on any time frame as the price action pattern is the same.
From an Order Flow Perspective
Before we get into what a breakout bar should look like, let’s explain what is happening from an order flow perspective in a breakout.
Using an upside breakout as an example, a resistance level has been established, with a minimum of one rejection, perhaps 2 and possibly more. This rejection in price denotes sellers over-powered the buyers and wrestled control of the market. The rejection could be slow, or it could be violent, but nevertheless, the bulls were in control, failed to break above a level, and the market pulled back.

Since they were successful in doing it before, there is a good chance previous or new sellers will be parked at the same rejection level to short the market again. Naturally, their stops will be placed just above the key rejection level. This is critical to know, because it is these stops when they get tripped which can help accelerate a breakout.
Why?
If there are players short at a key level, to exit they must buy back the pair which in turn, helps the bullish breakout get more steam. Keep this in mind for later while we start to discuss the first key element of a breakout.
Key Element #1 – The Breakout Bar
When witnessing a breakout, the first bar (or breakout bar) should be given the most scrutiny. This bar should be anything but timid in nature. Keep in mind, when a breakout is forming, there is a fight between the bulls and the bears which creates a tension. Sellers have placed a lot of money believing the market will reverse, while the bulls believe it will clear the key resistance above.
Thus, when the bulls are trying to break a key level, if the price action and bar approaching the key level is timid in nature, say with a small body, perhaps a wick on both sides, this will only give the sellers confidence they (the bulls) do not have enough dollars, buyers, or both, to break the key level. The sellers will sense this weakness and push back with a vigor if they really want to defend that level.
So the breakout bar should be strong in nature, signifying;
a) the buyers are putting a lot of force (either dollars, number of buyers, or both) into the breakout
and
b) they were able to clear out the sellers by tripping their stops
What does a strong breakout bar look like?
It should minimally be large in nature, meaning it has a large body (larger than usual). This large body demonstrates strong buying power and participation from the bulls. The stronger the force in a breakout, the more momentum it will likely have as it tries to make new ground. A large body shows commitment and force on the buyers part.
Another important element of a good breakout bar is it has little or no wick to the downside.
Why?
A bar that opens and has few or no pips to the downside, communicates to us the buyers were present and strong in the market from the open of the candle. They wasted no time buying from the open giving the sellers no time to enter. Their strong buying from the open suggests commitment to drive prices up and establish control from the beginning. Thus, look for little or no wick to the downside on the breakout bar such as in the example below.

Thirdly (and consequently), the breakout bar ideally has little or no wick to the upside as well. The presence of a little wick suggests the buyers maintained control going into the close, thus not taking profits, and likely communicating they think there is more upside to be had, thus staying in the market. This will also deter sellers from entering as they are reading the strong close from the bulls, thus, they will be hesitant and likely wait for a better price action trigger. Take a look at the example below.

Lastly, a good breakout bar will have clearing distance. This is the distance the bulls have cleared from the previous resistance level which was containing the upside. If they only clear the resistance level by a small amount, its possible they did not trip any stops, thus failing to add steam to their breakout play. This could also suggest to the sellers the bulls do not have a strong punch, so the bears may see a weakness, and thus enter the market.
However, if the breakout clears the resistance level by a good distance, then stops were almost certainly tripped, thus adding to the upside break. This will also communicate to the bulls they have taken out all the barriers and thus can push for higher ground with less orders from the bear side.
To be specific, the clearing distance is the distance in pips from the high of the resistance level broken (or low in a downward break), to the close of the breakout bar. The high of the breakout bar is useful as it tells us how far the bulls were able to push (and clear) from the resistance level in the breakout bar. However, if it pushes really high, but gets rejected strongly and barely closes above the lows, this would communicate to us sellers did not accept the value of the pair that high above, and rejected it strongly, taking control from the bulls (who were in control during the breakout). So the key is how far does it close above the high of the previous resistance level. This is known as the clearing distance and is demonstrated in the chart below.

In Closing
We have just covered 4 critical characteristics to what a strong breakout bar would look like. They are;
1) Large Body
2) Small Wick to Downside (for upside breakout, while a small wick to upside for downside breakout)
3) Strong Close
4) Clearing Distance
These four things communicate to us from an order flow and price action perspective why they will likely lead to a strong breakout.
This is part one of a three-part series on reading price action and how to identify key elements to a breakout. Stay tuned as next week we will cover the second aspect of a strong breakout and how this communicates the breakout will likely continue.
Please remember to leave your comments below and to ‘Like’ and ‘Tweet’ to share the article.
Also make sure to check out our most recent article on Awareness, Negative Habits, and Concentration in Trading.
Here is a new video on trading intraday price action trading. In this video, I am demonstrating how to read forex price action on an intraday basis for short term price action trading. For those of you wanting to learn advanced price action, make sure to check out my price action course where you learn rule-based systems to trade the forex market using high-probability setups backed by quantitative price action data using simple to learn price action strategies.
Many people will talk about their forex Risk-Reward ratios such as it’s important to have 2:1, 3:1, or whatever to one ratio, but this is just the tip of the iceberg of risk-management and leaves you uninformed and un-empowered. You can actually have a 3:1 Reward-Risk ratio and lose all the money in your account. You can also have a 1:1 Reward-Risk ratio and make money day in day out.

How can you understand the difference between the two? Through the Risk-of-Ruin formula.
We did a 1hr webinar on Risk Management, the Risk of Ruin formulas and how critical they are, whether you are trading Price Action Strategies, Ichimoku Kinko Hyo, or any other system.
I got many requests for the information contained in the Risk of Ruin formulas so I am posting all the tables here so you can see the mathematics of your trading and whether you have the numbers in your favor. Here they are below:
Risk of Ruin Formula using 10% Risk / Trade
| ROR% with 10 capital at risk | |||||
| Win Ratio % | Payoff Ratio 1:1 | PR 2:1 | PR 3:1 | PR 4:1 | PR 5:1 |
| Win Ratio 10% | 100 | 100 | 100 | 100 | 100 |
| Win Ratio 15% | 100 | 100 | 100 | 100 | 100 |
| Win Ratio 20% | 100 | 100 | 100 | 100 | 46.6 |
| Win Ratio 25% | 100 | 100 | 100 | 30.5 | 16.3 |
| Win Ratio 30% | 100 | 100 | 27.7 | 10.2 | 6.1 |
| Win Ratio 35% | 100 | 60.9 | 8.2 | 3.53 | 2.33 |
| Win Ratio 40% | 100 | 14.2 | 2.5 | 1.24 | 0.888 |
| Win Ratio 45% | 100 | 3.41 | 0.761 | 0.426 | 0.329 |
| Win Ratio 50% | 100 | 0.813 | 0.226 | 0.141 | 0.116 |
| Win Ratio 55% | 13.4 | 0.187 | 0.0635 | 0.0438 | 0 |
| Win Ratio 60% | 1.73 | 0.0401 | 0 | 0 | 0 |
| Win Ratio 65% | 0.205 | 0 | 0 | 0 | 0 |
| Win Ratio 70% | 0 | 0 | 0 | 0 | 0 |
| Win Ratio 75% | 0 | 0 | 0 | 0 | 0 |
| Win Ratio 80% | 0 | 0 | 0 | 0 | 0 |
| Win Ratio 85% | 0 | 0 | 0 | 0 | 0 |
| Win Ratio 90% | 0 | 0 | 0 | 0 | 0 |
Risk of Ruin Formula using 5% Risk / Trade
| ROR% with 5 capital at risk | |||||
| Win Ratio % | Payoff Ratio 1:1 | PR 2:1 | PR 3:1 | PR 4:1 | PR 5:1 |
| Win Ratio 10% | 100 | 100 | 100 | 100 | 100 |
| Win Ratio 15% | 100 | 100 | 100 | 100 | 100 |
| Win Ratio 20% | 100 | 100 | 100 | 100 | 21.7 |
| Win Ratio 25% | 100 | 100 | 100 | 9.33 | 2.67 |
| Win Ratio 30% | 100 | 100 | 7.67 | 1.03 | 0.372 |
| Win Ratio 35% | 100 | 37.1 | 0.672 | 0.124 | 0.0544 |
| Win Ratio 40% | 100 | 2.03 | 0.0623 | 0 | 0 |
| Win Ratio 45% | 100 | 0.116 | 0 | 0 | 0 |
| Win Ratio 50% | 100 | 0 | 0 | 0 | 0 |
| Win Ratio 55% | 1.81 | 0 | 0 | 0 | 0 |
| Win Ratio 60% | 0 | 0 | 0 | 0 | 0 |
| Win Ratio 65% | 0 | 0 | 0 | 0 | 0 |
| Win Ratio 70% | 0 | 0 | 0 | 0 | 0 |
| Win Ratio 75% | 0 | 0 | 0 | 0 | 0 |
| Win Ratio 80% | 0 | 0 | 0 | 0 | 0 |
| Win Ratio 85% | 0 | 0 | 0 | 0 | 0 |
| Win Ratio 90% | 0 | 0 | 0 | 0 | 0 |
Risk of Ruin Formula using 2% Risk / Trade
| ROR% with 2 capital at risk | |||||
| Win Ratio % | Payoff Ratio 1:1 | PR 2:1 | PR 3:1 | PR 4:1 | PR 5:1 |
| Win Ratio 10% | 100 | 100 | 100 | 100 | 100 |
| Win Ratio 15% | 100 | 100 | 100 | 100 | 100 |
| Win Ratio 20% | 100 | 100 | 100 | 100 | 2.2 |
| Win Ratio 25% | 100 | 100 | 100 | 0.266 | 0 |
| Win Ratio 30% | 100 | 100 | 0.163 | 0 | 0 |
| Win Ratio 35% | 100 | 8.37 | 0 | 0 | 0 |
| Win Ratio 40% | 100 | 0 | 0 | 0 | 0 |
| Win Ratio 45% | 100 | 0 | 0 | 0 | 0 |
| Win Ratio 50% | 100 | 0 | 0 | 0 | 0 |
| Win Ratio 55% | 0 | 0 | 0 | 0 | 0 |
| Win Ratio 60% | 0 | 0 | 0 | 0 | 0 |
| Win Ratio 65% | 0 | 0 | 0 | 0 | 0 |
| Win Ratio 70% | 0 | 0 | 0 | 0 | 0 |
| Win Ratio 75% | 0 | 0 | 0 | 0 | 0 |
| Win Ratio 80% | 0 | 0 | 0 | 0 | 0 |
| Win Ratio 85% | 0 | 0 | 0 | 0 | 0 |
| Win Ratio 90% | 0 | 0 | 0 | 0 | 0 |
Risk of Ruin Formula using 1% Risk / Trade
| ROR% with 1 capital at risk | |||||
| Win Ratio % | Payoff Ratio 1:1 | PR 2:1 | PR 3:1 | PR 4:1 | PR 5:1 |
| Win Ratio 10% | 100 | 100 | 100 | 100 | 100 |
| Win Ratio 15% | 100 | 100 | 100 | 100 | 100 |
| Win Ratio 20% | 100 | 100 | 100 | 100 | 0.0485 |
| Win Ratio 25% | 100 | 100 | 100 | 0 | 0 |
| Win Ratio 30% | 100 | 100 | 0 | 0 | 0 |
| Win Ratio 35% | 100 | 0.701 | 0 | 0 | 0 |
| Win Ratio 40% | 100 | 0 | 0 | 0 | 0 |
| Win Ratio 45% | 100 | 0 | 0 | 0 | 0 |
| Win Ratio 50% | 100 | 0 | 0 | 0 | 0 |
| Win Ratio 55% | 0 | 0 | 0 | 0 | 0 |
| Win Ratio 60% | 0 | 0 | 0 | 0 | 0 |
| Win Ratio 65% | 0 | 0 | 0 | 0 | 0 |
| Win Ratio 70% | 0 | 0 | 0 | 0 | 0 |
| Win Ratio 75% | 0 | 0 | 0 | 0 | 0 |
| Win Ratio 80% | 0 | 0 | 0 | 0 | 0 |
| Win Ratio 85% | 0 | 0 | 0 | 0 | 0 |
| Win Ratio 90% | 0 | 0 | 0 | 0 | 0 |
Hopefully after viewing the Risk of Ruin tables and underlying forex trading risk mathematics, you will begin to look at your trading differently, analyze whether you have the mathematics in your favor to make money day in day out, or are setup to lose money. Understanding the mathematics of risk can make all the difference in the world so make sure you study these numbers in relation to trading your rule-based system.
We have a Risk of Ruin Calculator available here, for your convenience.
Remember to leave us your comments which are always appreciated, and also to click the ‘Like’ and ‘Tweet’ buttons below to share it.
The 4-Hour Chart
No, this is not a Timothy Ferriss promotion or new book, but an examination of the 4hr chart, along with the how and why I recommend using it for your price action trading.
If you are in the beginning or developmental stages for learning how to trade the forex market, I definitely recommend learning to read price action off the 1hr, 4hr an daily time frames. For our purposes, we will concentrate on the 4hr chart.
Some Advantages of the 4hr Time Frame?
Price Action is the result of order flow (the total summation of all buy and sell orders). It really matters not why people buy and sell, or if they are buying and selling, what matters is who has dominant control of the market, where is the market most likely to go, and how can we trade it.
With that being said, a few minutes of price action can more often than not, represent a false move, perhaps Toyota buying some USD with JPY, and very likely have any significant force behind it to drive the market, bring in other players, and be the start of a big move.
Think about it…how many 1min, 3min, 5min, 10min, 15min, or even 30mins of price action throughout the day will really be representative of a major move and driving force throughout the day?
Now, think about the 4hr chart. No matter how you slice it, 4hrs is half of a trading session (for the most part). For any trading session, a 4hr candle will represent a large sum of order flow, sentiment, continued or sustained buying/selling, etc. If a rejection happens on a 4hr chart, it likely represents a large rejection because to sustain that rejection, the market had to close the entire 4hr candle while maintaining the rejection till the end. If it rejects during the 4hr candle, but closes exactly where it rejected, then it wasn’t that important because it couldn’t sustain that rejection in time.

Time is a critical component when reading price action and representing order flow. In many cases, the longer price reacts/rejects off a key level, the longer it holds from that rejection, the stronger it can be. Of course the price action context leading up to it is key and informative, so make sure to understand this.
But if a key level can sustain the directional move for 4hrs as opposed to 5mins, then it had to do so through increased order flow and participation from the market. That communicates there were more players and more money behind this move.
But on a 5min candle, or even a 1min candle, this could be nothing and represent little/meaningless order flow with no real potency behind it. It could be the result of some minor profit taking which creates a negative feedback loop in terms of order flow and price action. But do this for 4hrs and sustain it into the close, and we are talking more participation, orders, money and participants.
For price to sustain a particular price action move for 4hrs means no matter how many players, sentiments, and ideas there were participating in the market, the dominant theme held for half the trading session and quite a long time. But on a one min time frame, a 5min, or even 30min time frame, these moves could be simple noise which can move the market up to 30pips without having any major force behind it. Think about how many 5min candles in between the NY close and Tokyo open and how much order flow will really be behind that? Think about how many 1min and 3min candles will be between the 3rd and 4th hours of the london session (where volatility and pip ranges generally decrease) and how they will represent less order flow and participation. Then you will see how ineffective these candles can be and how what your reading has very little meaning.
One and Two Bar Patterns
Continuing with that logic, for those who trade pure price action patterns, like an inside bar (which is a 2 bar pattern) shows up on a 1min, 3min, 5min or even 30min time frame, it is much more likely to be absolutely meaningless than an inside bar which shows up on a 4hr time frame.
Think about it, if price holds inside the previous price range on a 5min candle, that could mean almost anything and be the result of a laundry list of order flow environments and situations. 5mins of price going nowhere could mean anything and have very little direction on upcoming order flow.
But apply an inside bar on a 4hr time frame, and you are talking 4hrs of price action being held in a range for almost half an entire trading session. That means no matter how many players participated in the market, nobody was able to break the previous price range for an entire 4hrs which tells you a) price was pretty suppressed, b) very little directional control in the market, c) very little participation. That is much more communicative in terms of information than any passing 5mins.
The market could be in a dominant trend, but be simply pausing for 5mins because its coming to lunchtime, there were some short term counter-orders/forces in the market that will be quickly absorbed, a little profit taking (again, a negative feedback loop on price action and thus, not great for trading). Technically, for an inside bar pattern, you would be basing your decision on 8hrs of price action since an inside bar pattern is a 2bar pattern (thus 8hrs), so there is a lot more information in this then an inside bar pattern on a 5min time frame (10mins of price action).

Furthermore, to get any real significant amount of data with confirmation and continuation of the order flow (and price action), you need far more 1min, 3min, and 5min candles to make sure the noise is filtered out. That means more moving parts and more variables to manage. Contrast to the 4hr chart where one candle (or two) can give you all the information you need to make a trade while filtering out any noise and meaningless price fluctuations.
For an interesting story about meaningless price fluctuations, make sure to put in a question in the comment box below and i’ll tell you a story which will blow your mind.
In Conclusion
As we can see, when trading and reading price action, a 4hr candle will offer us much more information, and have a cleaner look and feel to it than any 1min, 3min or 5min chart. This will make it easier for you in your learning process as you’ll be making decisions off of less false signals, more information and cleaner charts.
The 1hr, 4hr and daily time frames will have a greater communicative value about direction, clear support/resistance levels, what is a key rejection, who’s in control, while filtering out noise and meaningless order flow and price action. This will give you less confusing information in the beginning, and teach you how to be patient with your trading.
Once you have developed your skills, have some experience and confidence under your belt, it’s really up to you from there how you want to trade, whether it be on the smaller time frames (1min – 30mins) or larger time frames (1hr, 4hr and daily). At that point, it’s a question of style and life-style.
But it should be noted we aren’t saying trading on the lower time frames is meaningless. One can trade price action on any time frame and make money. In fact people are making money on almost every time frame available.
Just understand you have to increase your price action skills and ability to read price action context before trading lower time frames. For some people’s brains, it doesn’t work with their natural wiring and dispositions. For other traders it does, so the key is finding what works for you. If it hurts your brain, then it likely isn’t for you, so make sure whichever style you trade isn’t hurting your brain, but engaging it well.

For those of you wanting to learn how to read price action and the order flow behind it, take a look at our Advanced Price Action Trading Course where you will learn rule-based price action systems to trade the forex market.
Please remember to leave your comments below and to ‘Like’ and ‘Tweet’ to share the article.
Also make sure to check out our most recent article on Price Action Trading.