Tag Archive for: support and resistance

What’s Inside?

  • How to find key support and resistance levels in any market
  • How can I trade support and resistance zones, either using end of day price action or intraday strategies?
  • Why is it hard to find good support and resistance levels to trade?

If there is a subject which repeats itself amongst traders who are struggling with price action, understanding and trading key support and resistance levels would be near the top of the list.

Common questions struggling traders ask are:

  • How do I know if a support or resistance level will hold?
  • If I have a full time job, and am trading end of day (or daily/4hr time frames), how do I choose the best support and resistance levels?
  • How can I find the best support and resistance levels for trading?

Have you asked any (or all) of the above questions when learning trading online? Felt confused about understanding key support and resistance levels? If so, then pay attention to this article as we’re going to put many pieces of this puzzle together regarding key support and resistance levels, along with how to trade them.

support and resistance trading

Key Point #1: How Professional Traders Relate to Support and Resistance Levels

Anyone who has seen how professional traders trade know they often place their orders ahead of time and less often do market orders. A general theme that shows up is about 70+% of all institutional orders are placed at prices ahead of time, while <30% are market orders.

Now every institution and trader has their own approach. Some use price action, some use the ichimoku cloud, some use fibonacci levels, some use indicators, etc. Regardless, none of that matters.

What does matter is all of them are paying attention to key support and resistance zones. These ‘zones‘ are where they most often place their orders. Now it’s important to understand that each trader and institution has their own ‘holding time‘, meaning how long they like to hold their positions.

Traders who have shorter holding periods will often require a smaller stop. Hence they will want to get as close to the support/resistance level as possible to create the smallest stop available while maximizing their upside. Traders with longer holding times won’t require as much precision and will likely have a larger stop loss to avoid getting kicked out of minor swings to capture the underlying trend.

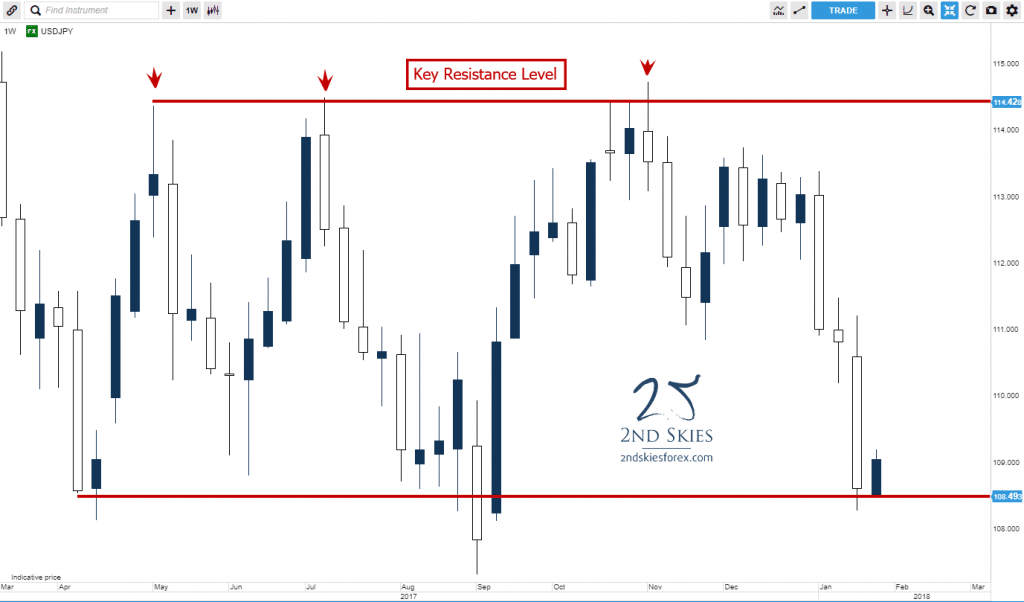
Now to give you a visual of how this works, lets look at the chart below on the USDJPY weekly chart.

usdjpy key resistance level zone 2ndskiesforex

As you can see from the chart above, I’ve drawn a line on top near 114.42 which I denote as ‘resistance‘.

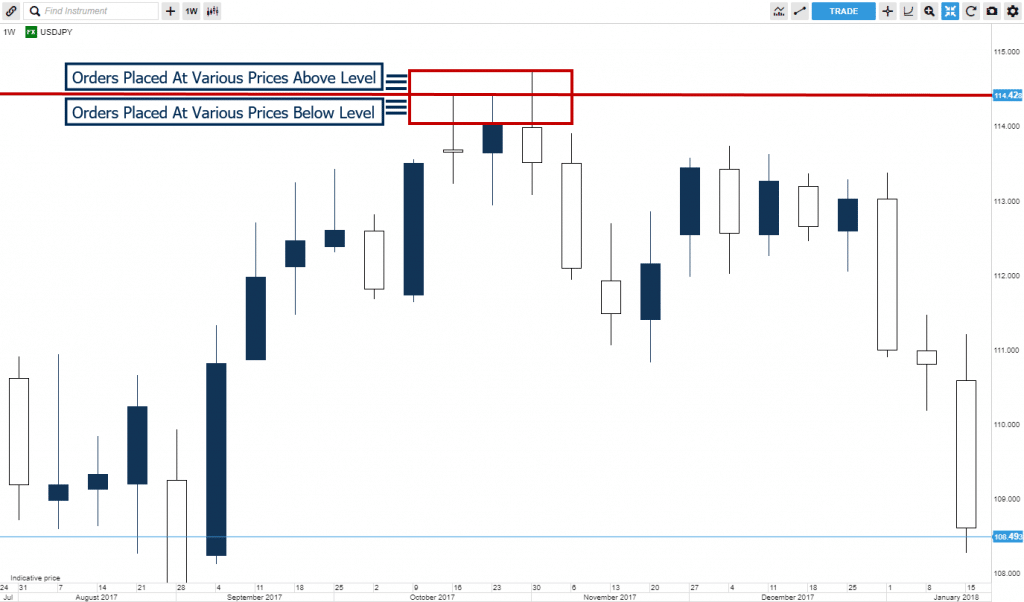
Now here is how professional traders will attack this using the next chart below.

usdjpy order flow key support and resistance levels 2ndskiesforex

If a professional trader is bearish on the USDJPY (or thinks it’s in a range), they’ll sell the pair at or near 114.42. However, as I stated above, they’ll have different holding times and stop loss sizes. So what the order flow will look like is you’ll see various orders placed below the 114.42 level, while some will be above.

In this case, because two of the 3 wicks (in the chart above) which hit the resistance level stopped on a dime, you can assume there were a fair amount of orders just below the level. What you’ll also notice is the 3rd wick pierced through the 114.42 level, either due to a) bulls trying to push through resistance and see if they can produce a breakout trade setup, or b) traders finding liquidity just above it.

If you were able to somehow see the combined global order book for these 3 candles, most likely you’d see something like below:

Sell 10m 114.00
(with various orders selling between here and 114.42)
Sell 10m 114.42
(with various orders selling between here and 114.72)
Sell 20m 114.72
(with only a few orders above, perhaps up to 115).

While this is an overly simplified description of the order flow around this key resistance level, it serves an important point. Which is, it’s important to understand professional traders will place their orders at or around key levels. The variance in how they place their orders above/below these levels creates a ‘zone‘ of orders, which defend a level, and thus create ‘resistance‘.

If the sell orders are enough to hold any bullish pressure, the pair will sell off. If not, a breakout will likely occur, or a complex corrective structure will form.

Now the key take-home point here is: professional traders who are spotting the same level/price will most likely place their orders at/above/or below said price. This is what creates the ‘zone‘ effect, so try to avoid thinking key support and resistance levels as clear/perfect lines in the sand.

Key Point #2: The Larger The Support or Resistance Zone, The Greater the Variance in Orders Behind That Zone

In the prior USDJPY chart, the resistance zone was pretty small (about 30 pips from top to bottom). This makes it pretty easy to get some precision when selling at a key resistance zone.

But what happens when the support or resistance zone is much wider, say 100 pips or more? How do I trade that? Great question which I’ll answer below.

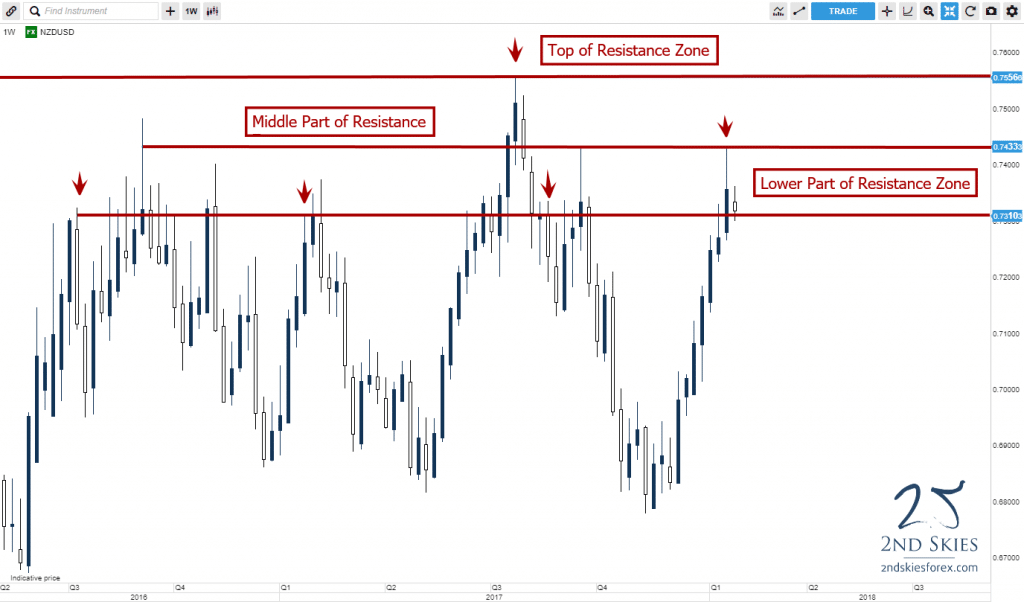
Meet the NZDUSD weekly chart, which currently has a wide resistance zone between .7312 and .7556, over 240 pips!

nzdusd resistance zone 2ndskiesforex

When you have such wide resistance zones, it means there is less ‘agreement‘ in the order flow between the bears in the market.

There are bears which feel .7310 is a decent resistance (as evidenced by the fact only 13 candles have closed above this since late Q2 2016). There are bears which feel strongly about .7433 being resistance as the pair has had only 2 weekly closes above this price since Q2 2016. And then there are bears which felt the extreme values for this pair should not exceed .7556. This is clearly shown since the kiwi could not produce one weekly close above this price.

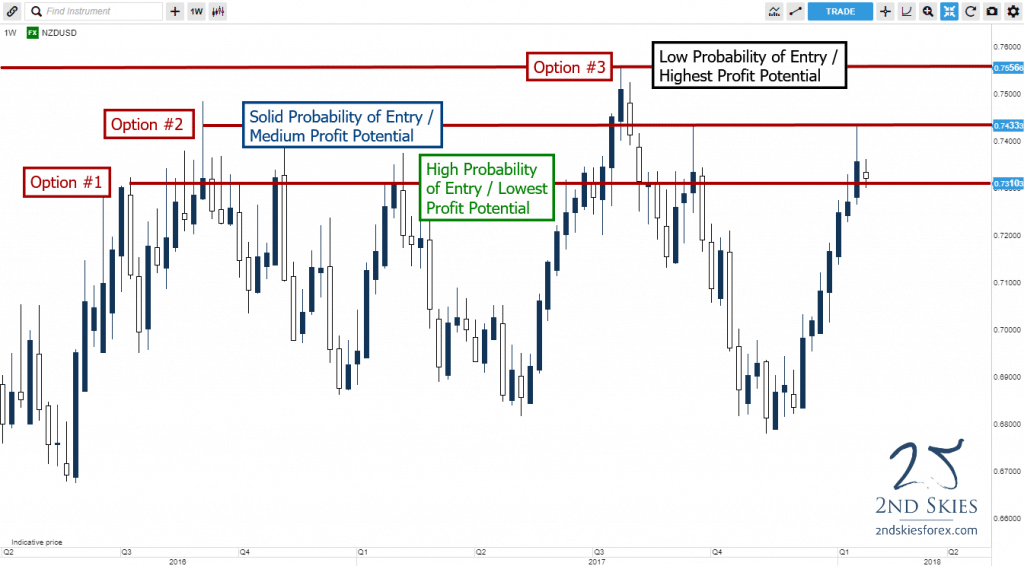
So there is a lot of ‘disagreement’ specifically where resistance is, but there is agreement that this ‘zone‘ is resistance. Now anytime you encounter a zone (wide or small), you are faced with the same 3 trading choices when it comes to shorting it:

Support & Resistance Zone Trading Option #1: If you want the highest probability of getting in the trade, you’ll want to target the bottom of this resistance zone (flip this for support zones…e.g. top of the zone). By getting in a part of the resistance zone frequently touched, you’re increasing the probability you’ll get into the trade. The downside = a wider stop loss, which also reduces your potential profit.

Support & Resistance Zone Trading Option #2: If you want a solid probability of getting in the trade, while not wanting such a huge stop loss, you’ll want to get in somewhere inside the zone (ideally closer to the middle). This will slightly decrease the probability your trade will activate, but will increase your profit potential since you’ll have a smaller stop loss and thus greater target.

Support & Resistance Zone Trading Option #3: If you want the highest profit potential, then you’ll want to get in at the highest point in the zone (.7433 or above). The upside here is you can have the smallest stop loss possible, and thus the greatest profit potential. The downside is your trade is less likely to get activated (i.e. .7433 was only hit 4x since Q2 17′, while .7310 was hit almost 25x).

To clarify, I have a chart below for you using the same Kiwi pair to demonstrate this.

trading key support and resistance levels 2ndskiesforex

So that is the ‘framework‘ for how to think about support and resistance zones and how you should trade them. You’ll need to decide how you want to trade that zone based upon probability and profit potential. Neither choice is better or worse per se stylistically. You’ll have to find which of the 3 is most natural to you.

Key Point #3: Trading Support and Resistance Zones Means Trading ‘Probabilities’

I think one of the biggest confusions about trading price action using support and resistance levels is understanding probabilities, and relating to trading (or taking your trades) based on probabilities. This ‘confusion‘ has been perpetuated by a common ‘narrative‘ that you should wait for ‘confirmation price action signals‘.

confusion about confirmation price action signals

Supposedly you do this to ‘confirm‘ the level will hold, and thus be more ‘probable‘. The fact of the matter is, most professional traders have already decided what level and price they want to enter, well before any said pin bar, fakey or ‘confirmation price action signal‘ has formed.

The underlying order flow is generally clear to most professionals before these 1-2 bar candlestick patterns have even formed, so they know which direction is more ‘probable‘, along with their trade location.

And considering nobody to date, after decades, has been able to establish with a verified live trading account, or with statistics that trading pin bars off key levels gives you a greater probability the trade will work out (+ profit), this narrative is quite dubious and making traders more confused about trading key support and resistance levels. But I digress…

When you boil it down, there are two key points to understand here:

#1: Either the level will hold or not

#2: The order flow (and probabilities) are most likely in place whether a key support or resistance level will hold (or not)

“What the above means is you will never ‘know’ if the level will hold or not. You only have probabilities to work with. Hence you have to approach it ‘probabilistically’ (which negates looking for ‘confirmation’)”

The best way to determine either of the above is by learning how to read price action context and the order flow behind it. The context will create a ‘structure‘ which is reflective of the underlying order flow. 1-2 candlesticks likely isn’t going to change that, nor are they more important than an entire structure. Hence, when you can learn to read price action context and structures, you’ll be able to see which level is more likely (and probable) to hold (or not).

By doing this, you’ll be getting better trade locations than you would with any pin bar or confirmation price action signal. I demonstrate this clearly in my latest live trade video for +480 pips and +5R profit. Try to find a better entry using a pin bar (you won’t).

Hence by learning to trade without confirmation price action signals, and to understand the context in terms of probabilities, you’ll avoid missing perfectly good trades.

And if you look at my USDJPY or NZDUSD charts, you’ll see there were very few confirmation price action signals here, which = lost trades and profits.

USDJPY Weekly Chart

usdjpy key resistance level zone 2ndskiesforex

NZDUSD Weekly Chart

nzdusd resistance zone 2ndskiesforex

My guess is if you were to identify many key support and resistance levels over years and years of price action that produced great trading opportunities, you’ll see many times there were little or no pin bars, or any kind of confirmation price action signals, thus a lot of lost profits missing these high quality trades.

In Summary

So I’ve covered a lot of ground here regarding key support and resistance levels. The key points and methods I talked about above apply to any instrument, any time frame, or environment.

It’s important to note there is a lot more to understand when trading or finding key support and resistance levels. Such as how ‘clean‘ a level is, when a level is more likely to hold (or fail), what are the best levels to trade, how to find key levels using daily chart strategies, trading intraday, and more.

This is a big subject that cannot be unpacked fully (or well) in a single article. And it’s a skill you’ll need to build over time through practice, analysis and feedback from a professional trader and mentor.

Now if you want to learn more about forex trading key support and resistance levels, and improve your ability to find the best ones to trade, then check out my online price action course where we have over 5 hours of video lessons on this, along with quizzes, analysis and feedback from me and my senior students on how to find and trade the best levels.

Now Your Turn

Did you find this support and resistance level article useful and learn something new? If so, then make sure to leave your comments below, along with share/like/tweet it with others.

I’ll look forward to hearing from you.

One of the most important trading, technical and price action skills you’ll need in forex trading, stock trading or trading any major market, is the ability to draw and find key support and resistance levels and zones. This is a trading ‘skill’ you’ll need to build.

However, did you know there are two types of support & resistance? The first one is horizontal support and resistance, which we did a video on recently here.

The second type of support and resistance you’ll find in trading is dynamic support and resistance, which is fundamentally different in terms of how it’s constantly moving, while offering a floor or ceiling to the price action.

In today’s trading video, I’m going to share with you one method I use to find dynamic support and resistance in the markets, whether its trading stocks, forex, commodities, or global indices.

Read more

One of the most important trading, technical and price action skills you’ll need in forex trading, stock trading or trading any major market, is the ability to draw and find key support and resistance levels and zones. Make no mistake, this is a trading ‘skill’ you’ll need to build.

One of the biggest questions I get is “how do I draw and find support and resistance on my chart?”

In today’s free trading lesson, I’m going to share with you 5 tips on how to draw support and resistance so you can learn to find the best levels for your trading.

Do you want a FREE practice trading account?

Make sure to sign up via our preferred multi-asset platform below (certain country restrictions apply): https://2ndskiestrading.com/xtb-demo/

Want to get my Price Action Course for FREE? Click here to find out how: https://2ndskiestrading.com/xtb/

⏰TIMESTAMPS⏰

0:50 – Support and resistance levels without the price action context is…

2:17 – why you want to draw the most important levels (and not go cray-cray with your s/r levels)

4:03 – do you draw your support and resistance levels using the wicks, or the bodies of the candles?

6:27 – why you need to think of support and resistance in a different way

9:59 – levels respected in this way will always be much stronger

Read more

This is part 1 of a 4 part forex price action strategy series. Read the next one here: The Blind Entry (How It Will Leave You Trading Blind)

I can always tell where people are in the trading process based on how they speak about confirmation. Why is that? Watch, and find out!

Here’s the transcription for the video:

“There’s a really big misunderstanding about confirmation.

When I hear people talk about confirmation and how they talk about confirmation, I can always tell where people are in the trading process based on how they speak about confirmation. Why is that?

Because there’s been this proliferated idea in the trading education world that to trade a setup or trend or something like that you need this thing called confirmation and the confirmation comes in the form of a pin bar, an engulfing bar, an inside bar or whatever.

So that’s the general idea that’s out there when it comes to trading price action.

The thing is, is that when I hear somebody talk about price action in this way, I know exactly what level of trader they are and what level of trader they’re not, because how somebody speaks about confirmation is very indicative of where they are in their trading process.

If a trader is looking for confirmation that a trade will work and they’re doing this because they’re saying “ok, we gotta wait for a price action confirmation signal from support or resistance“.

Well, where does this idea and need for confirmation come from? It comes from a beginner’s understanding of trading.

Why is that?

Because beginning traders are looking for certainty in the market. They’re looking for solidarity, they’re looking for something really really potent that says “I need confirmation”.

The reason why they need confirmation is because they don’t trust price action, they don’t trust their skillset.

They don’t trust trading as a whole. They don’t trust trading with trends, they don’t trust reversals. They don’t trust support and resistance, they don’t trust price action as a whole.

In the beginning, traders want solidarity, they want certainty. And because of that, they’re looking for confirmation in the form of a pin bar or something like that.

The pin bar ‘confirms’ that this trend is going to continue.

The thing about it i,s is that this is something that professional traders have let go of that a long time ago. And they have to let go of it to become a professional trader.

The reason why that is, is because that idea of certainty, of confirmation and the way that a beginning trader is looking for it, that wanting things to be really certain, that A++ setup.

Where that comes from is a beginning understanding of trading.

“Professional traders don’t look for certainty, because they’ve realized it’s an illusion.”

What professional traders are looking at, which is a different perspective, is trading and thinking probability.

So if you hear somebody talking about confirmation, “we wanna trade with the downtrend and we’re gonna wait for a pullback towards resistance and a pin bar off that resistance as confirmation that the trend is still in play and we can trade it“.

How many have heard that story before?

The reason why you’ve been told that is because the people who are teaching that aren’t trading professionally.

If they were you would know this, and all professional traders would know this because professionals aren’t looking for confirmation signals via a pin bar.

So if you hear somebody talking about that, you know where they are in terms of their level of trading.

They’re still a beginning trader themselves, and if you think about it, if somebody is talking about an A++ setup or they’re saying “hey, we’re waiting for a pin bar from resistance for confirmation“, besides the fact that I would suggest running from them as far as possible, because they’re still beginning traders.

You have to ask yourself “look, if you’re only willing to wait for a pin bar or an inside bar, or a false break, if you’re only willing to wait for those signals before you enter the market, well then you really don’t trust price action, do you?”

You don’t trust trends, you don’t trust price action context, impulsive vs. corrective, volatile vs. non-volatile trends, you don’t trust support and resistance, you don’t trust your own ability to trade.

You have to wait for all these other things to be in place and then this one final supposedly magical pattern and supposedly there’s only like 3 of them, which is amazing to me that this idea is actually out there, that there’s only 3 possible ways that the market is telling you a trend’s going to continue.

I don’t know about you but that seems kind of absurd to me. It seems a little insane to think that a market that is so complex, across so many players, across trends that continue.

Confirmation via a pinbar is an illusion, it’s a beginning way to look at trading.

So, your job as a professional trader… you know you’ve kinda crossed the Rubicon and made a big leap in your trading when you look at trading in terms of probabilities, not confirmation in the ordinary sense.

Confirmation, the way it’s normally talked about is a very dubious notion. It’s a very slippery idea that doesn’t really exist in the way you think it does.

If you’re constantly looking for those things you’re going to miss thousands and thousands of pips in a trend that is already well-esablished.

If you’re looking for confirmation, you won’t be able to make this trade and this trade and this trade and this trade. And that’s… what is that? +240-250 pips?

In a period of, what, 3 days? On one pair? You won’t be able to do that.”

This is part 1 of a 4 part series. Read the next one here: The Blind Entry (How It Will Leave You Trading Blind)

Have you been trading price action via ‘confirmation’? If so, I want to hear from you and what you see as the difference, so please make sure to comment below.

Was this article helpful? Please make sure to like, share and tweet it below to anyone you think can benefit from this.

Today’s article will focus on forex trading support and resistance key levels as this seems to challenge many developing traders. Learning how to trade support and resistance key levels is critical, because in essence, this is where;

a) you will be placing your stops and targets, and

b) this is where the institutional traders are getting in

In reality, forex support and resistance trading levels are like ‘doors’ or ‘walls’, either they will be open or closed – either they will break or they will hold shut. Your success in support and resistance trading will be in determining when they will hold, and when they will break.

trading support and resistance key levels breaking through resistance 2ndskiestrading.com

Thus, it becomes essential to learn how to read key levels so you can have a well defended stop, a highly efficient entry, and also have proper timing.  In this resistance and support trading strategy article, I will cover two powerful tips for finding these key support and resistance levels.

#1: Minimum of Two Touches
Before you can consider a level to be used as support or resistance, you will want a minimum of two touches.

Why?

Imagine you are in a strong downtrend, and the pair rejects off a particular price heavily – perhaps via a long tailed pin bar.  You have to consider, with trend traders are just going to see this as a test. The bears know there are buyers off the price where the bottom of the pin bar formed, but they are not going to give up control of the trend just from a simple pin bar.

They are going to retest this level to see if the buyers there are strong enough.  If they break it, then the trend and profits will continue.  If not, then they will take profit, but it’s unlikely a reversal will start immediately.  A good example of this is in the chart below.

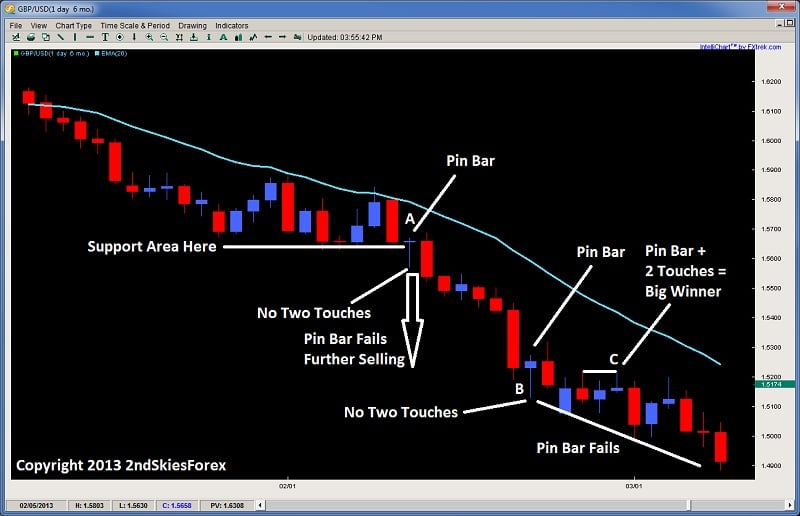
GBPUSD Daily Chart
pin bars support and resistance key levels price action 2ndskiestrading.com

Looking at the chart above, we can see the pair is in a strong downtrend.  In the middle of the chart at A, it forms a counter-trend pin bar. Now although the pin bar body is at the prior support area, the tail is way below, and its the bottom of the tail where the buyers entered in, not at the support area.

Thus, the bulls at the support area were likely stopped out when price dipped 100 pips below, & the rejection from the pin bar occurred at a place with no two touches. So this would not be a pin bar to buy as you can see failed whether or not you used a 50% retrace entry (which can be quite inefficient).

You will also see the same later on with the pin bar at B, which also had a low at no known support area or formed a second touch.  This also would have been a loser.

Now notice the pin bar at C which is with trend. You will notice the pin bar formed a second touch off the level two candles back.  This would have been a good price action setup to get in because the second rejection would have confirmed the level.  And you will notice, it turned out to be a winner.

So the main takeaway from here is look for the two touches, because with a one touch, the with trend traders will re-attack that level. And it should be noted there is a far more efficient entry than the 50% retrace entry which I will discuss in next week’s article, but keep in mind, after long tailed pin bars, you don’t have to worry about missing the entry.

Why?

Because if it is going to reverse, the greater probability is that a re-balancing, or ‘re-distribution‘ of the order flow will begin.  This mostly likely will creating a range, or a corrective pullback.  This is also why when you have an impulsive price action move, followed by a corrective price action move, it is more often followed by another impulsive price action move.

This is also the reason why an impulsive price action move is rarely followed by a counter-trend impulsive price action move. From an order flow perspective, this is because if the sellers are heavily in control, the buyers will have to overwhelm the sellers, and this requires a lot more money and orders then the current bears in control.  This is the reason why V-bottoms are more rare than common.

#2: Trading With Trend Increases the Probabilities
You might have noticed with the chart above, that trading with trend was more powerful than trading counter-trend. As a whole, counter-trend trades are a lesser probability trade, so they take more skill, experience, and precision. This is simply because you are trading against the majority of the order flow, so the odds are already stacked against you.  For those still having trouble getting consistency, I’d recommend trading with trend as much as possible.

Now if you are in a range, then there is no dominant trend, so trading reversal type plays are suggested, particularly at the tops and bottoms of the range. But when a strong trend is in play like the one above, you will find greater profit potential and accuracy trading with trend instead of counter trend.

This also holds true for trading support and resistance levels.

Why?

In a strong trend, the larger players are just looking for key levels as areas they can get in with trend.  This is traditionally known as a breakout pullback setup, and generally does not need two touches off the level to confirm its effectiveness.

Why?

Because likely, in a trend, there will be a support or resistance level that is already being challenged, which would confirm there are buyers or sellers at the level trying to defend it, while the other side is attacking it. Once it breaks, the with trend traders often look for a pullback towards this level to get back in with trend. A great example of this is in the chart below.

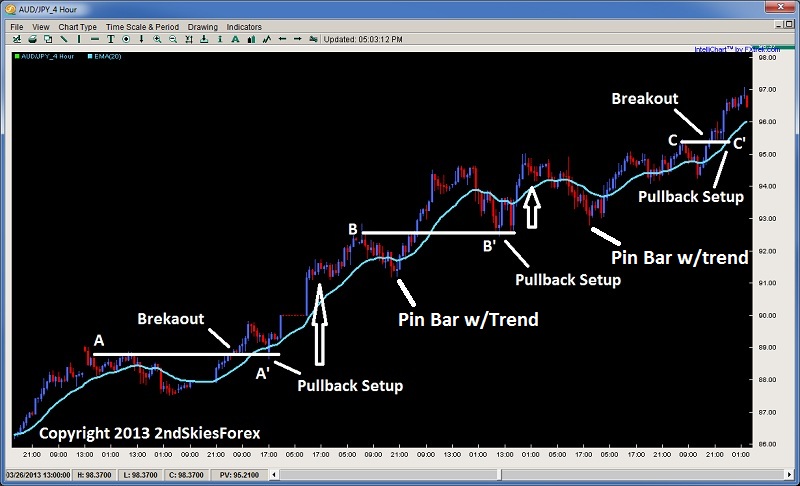
AUDJPY With Trend Setups 4hr Chart
breakout pullback setup trading with trend price action chris capre 2ndskiestrading.com

Using the chart above, starting with the bottom left, price climbs consistently, gapping up, but then forming a resistance area at A. After a brief pullback, we can see price breaks through forming a new SH (swing high).  The market then pulls back to the level at A, and at A’, forms an aggressive engulfing bar which starts the next up leg for over 400+ pips before forming a pullback.

The pullback at B which forms the next resistance high, dips just below the 20ema and forms a with trend pin bar. This marks the new impulsive leg up towards 95.00. Then price pulls back towards the level at B, and at B’, double bottoms (two touches) and starts another leg up and a nice with trend entry.

After a marginal break higher, price pulls back and forms another with trend pin bar below the 20ema, which starts another up leg towards a resistance at C. Sellers enter at C, and after a short pullback, break above it, with a brief consolidation at C’, offering a great breakout pullback setup to get in with trend.

Keep in mind, in all of these with trend pullbacks, the market pulled back towards the levle that it hat the strongest rejection from at A, B and C. The strong rejections at those levels are counter-trend players, trying to stop the trend. But when the bears tried to get past the last major resistance, now turned support (forming a role reversal level), the bulls used this as an opportunity to get long.

Yet in almost every case where the market formed a resistance, when the market attacked that level again, the sellers failed to hold the level. This is because they were going against the major order flow, which highlights how much easier it is to find key support and resistance levels that work when you are trading with trend, and not counter trend. So hopefully this highlights the difference.

In Summary
Finding key levels, and major support and resistance trading levels is not some Da Vinci code type endeavor. Two key things which really help this are using the two touch rule, along with trading more with trend than counter trend. Of course, there are other key clues to understanding support and resistance, but if you can employ these two techniques, they will greatly enhance your ability to find key levels, and make highly effective trades around them.

Today I am going to give a lesson on how to find some of the best support and resistance levels in the market.  If I had to say – I think there are three types which are the best support and resistance levels you could find.  But it would take a long time to go into each type, what are the characteristics of each, what they mean from an order flow perspective, and how to trade each type.

So I am going to cover in today’s lesson, what are some of the most critical variables to look for when evaluating support and resistance levels.  If you can learn to spot these levels, read the price action and key variables before the market reaches these levels, you will greatly enhance your trading, by finding better entries, knowing how the market is likely to react off a level, and how to increase the probability of your trades.

By first learning to read these key variables which I will list below, they will provide you with a lot of information in terms of;
-how the order flow is relating to them
-how these levels will improve the probability your trade or rule based price action system
-how you can trade these key levels 

Note: I want to hear your feedback on this lesson, like what key points stood out for you, what you found useful, how you can apply this to your trading, or…even if you want to throw tomatoes at me, I want to hear your comments 🙂

I will start this lesson by talking about what are some key things to look for when evaluating support and resistance levels.  I will then describe with some details how each variable informs you of the order flow behind the price action.  Then I will go over some basic methods of how you can trade them.  I will also give examples to demonstrate how these elements work, then end with a brief overview of what we covered.


Key Things To Evaluate Support and Resistance Levels

If I had to list what are the key things I use to evaluate support and resistance levels, it would be the following;

1) How price reacted to this level in the past (held, became a breakout – pullback level, bounced violently or timidly off of it)
2) How significant is it (lower time frame, higher time frame, held for how long?)
3) How is price reacting or responding to it now
4) What is the speed or impulsiveness price is approaching it now
5) What is the price action context prior to this level

All of these things communicate information to me about the uniqueness of this level, how the buyers/sellers reacted towards this level in the past, how likely they will respond to it in the future, and what they are most likely to do at this level.


Zones & Areas

It should be noted that I do not consider support and resistance levels to be lines in the sand, but more of a ‘zone‘ or ‘area‘.  That means I do not consider a resistance level to be one price, but likely several pips on either side.  This could be due to differences in price feed, server time, what other traders think of that level, and how they would play it.

A scalper will more likely get as tight to the level as possible, but scalping orders rarely are large in volume or market movers.  However, a swing trader or large institution will likely be getting in at several levels, and the level you might be spotting may be one of them they are placing a large order at.

Because of this and all the different ways institutional players relate to these levels, support and resistance levels for me are zones or areas which could be anywhere from a few pips wide to 10+, maybe more depending upon the time frame the level relates to.

Obviously a level from a weekly time frame over years would have a little more play then an intraday level on the 1hr chart so take this into consideration.


What Each Variable Communicates

Although I could spend an entire treatise writing about all the things each variable above communicates, I will go over the key points here.

1) How Price Reacted To This Level In The Past – this is a big one as it tells me what the major players thought of this level.  Was the pair highly over/under valued here and it produced a violent reaction in the past?  If so, then the first time it comes back to this level, we can expect a strong reaction.  Why?

If the reaction off a level was fast, that translates into heavy buying/selling with some large player initiating the rejection.  This is followed by other players quickly rushing in to get as close to that price as possible, essentially chasing for the best price, but agreeing with the initial rejection.  These levels are defended with a lot of money, and if price does not come back for some time because it traveled fast and furious off this level, then the next time it gets there (especially if it’s the first time back), expect a strong reaction.

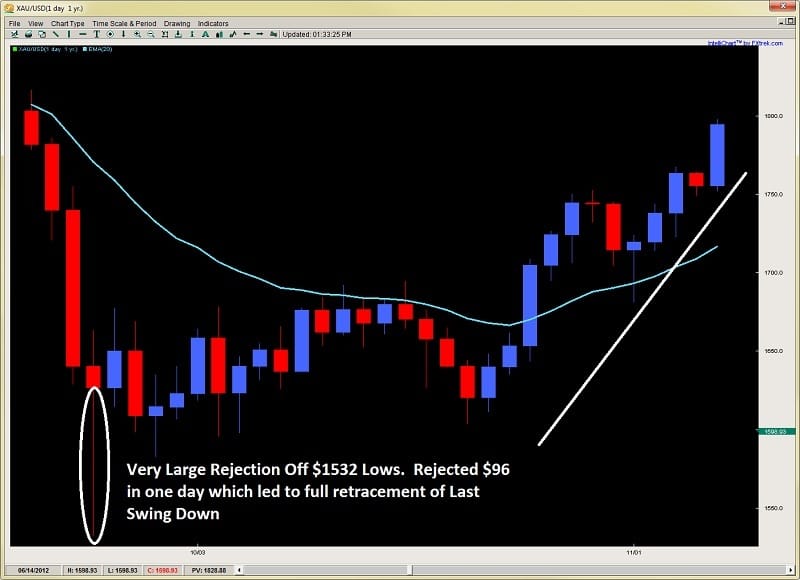
Exhibit A – Gold Daily Chart
best support and resistance levels gold chart 1 2ndskiestrading.com

When gold sold off massively due to huge margin increases by the metals exchanges, it crumbled hard and everyone was wondering where the bottom was.  It found it eventually at $1532 where in one day, it opened at $1640, jumped up $23, dropped $130, then bounced $96 from the lows which was quite an amazing rejection inside one day.  This is a violent reaction, so traders were definitely taking notice of it the next time it approached this level.  Can you guess what happened when it got there again?


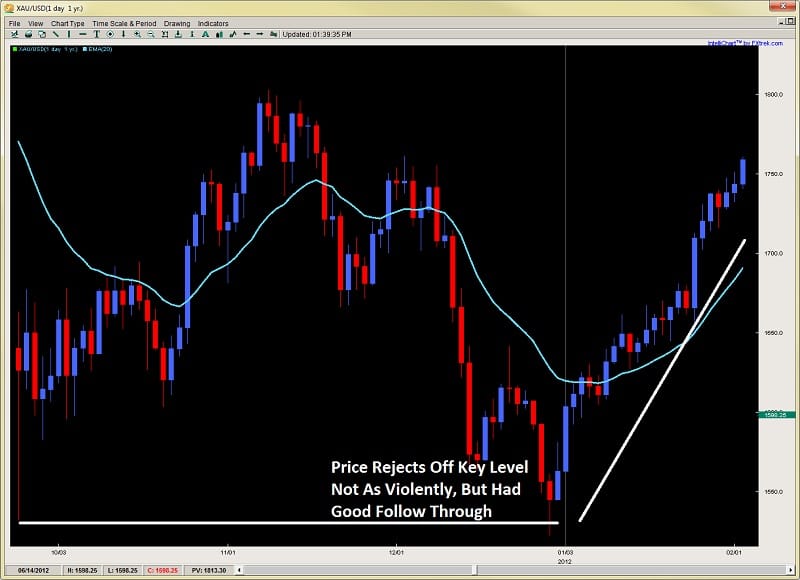
Second Approach Gold Chart
best support and resistance levels gold chart 2 2ndskiestrading.com

As you can see, price held this level with a tiny breach, then bounced the next 4 days in a row, suggesting strong follow up buying on this rejection.  The first time back usually is a slightly lesser bounce since many know of the level, and thus less traders are trapped (or surprised) from a violent rejection the first time around.  But usually, this level will hold.

Remember, this is one scenario of how price has related to it in the past.  All the other types of reactions communicate a different story.

2) How Significant Is It (lower time frame, higher time frame, etc) – this really has to do with time as all support and resistance levels have what I call a ‘time degradation‘ to them.  Simply put, traders have a memory, but they are more inclined to take recent information as more valuable then information a while ago, especially if they are short term traders.  Generally, higher time frame levels will dominate and last longer than lower time frame levels.  Also, when possible, I’m more interested in drawing levels that are more likely to maintain the trend as that is the more probable scenario.  I particularly relate to these when reading the impulsive vs. corrective moves in the market.

For more information about understanding impulsive vs. corrective moves, make sure to watch the video here.

But once you have established the trend according to the impulsive vs. corrective series, look for breakout pullback level where the trend continued, or major swing highs/lows where the trend paused and pulled back to.  These will often present great opportunities to get in with trend.

3) How Price is Reacting To It Now – Is price closing on a support level, and just sitting there, with smaller and smaller bounces off it? If so, a breakout through the level is more likely as there is no strong buyers able to push back, and the sellers continue to squeeze them out of the market.  Was there a strong pin bar reversal off this level?  If so, it could be telling you it will likely hold on a second attempt and start a reversal, hence look for an entry close to the level.  How price reacts to the level in the moment can tell you if it’s likely to hold or not, but this analysis should be done before it reaches the level.

Often times the market will demonstrate a price action reversal signal at these levels.  Keep in mind, this is the ‘effect‘ of how players responded to the level, not the cause.  Order flow was the initial cause, and the level was the location.  Everything else was a response to the initial reaction off this level.  Hence these price action triggers are often ‘secondary entries’ (or sub-optimal) regarding the level.  Sometimes a price action trigger, say a pin bar on a 4hr chart can be an engulfing or piercing bar on a 1hr chart.  So sometimes it helps to look at a lower time frame to see what the more micro responses off this level are, or what the price action context was leading up to it.

But no matter what, there will always be clues as to what the major players are doing at this level, and what the more likely scenario is.  Look for impulsiveness (strength) off the level, or weakness (corrective price action) off this level for initial clues.

4) What Is The Speed Or Impulsiveness Price Is Approaching The Level – this will really tell you a great deal of information whether a level is likely to hold or not.  If you are trading with trend, and with the move when it is approaching a level, how strong the move is heading into it, and what is the underlying characteristics behind the price action (speed, acceleration, etc), will tell you what is more probable.

If a level is an intraday level, or one from only a day ago, a really impulsive move is likely to break through it. If it’s a daily low or high, or a level that held for a week or longer, it will have a better chance of holding. Think of it like a moving object.  Consider the size of the object in relationship to what the obstacle in its way is.  Normally, force x acceleration (& mass) will tell us whether the obstacle ahead will cave or not. Unfortunately, we do not have exact information about the orders at a level, such as the number and size of them which would equate to mass and volume of the object.  Level 2 quotes would help in this fashion, but if you don’t have that, then what?

Why not use the other principles above, such as;
-how did price react there in the past
-how significant is it
-how is price reacting to it on first touch

Weigh those against the force, or impulsiveness of the move, and you’ll be able to get a better idea.


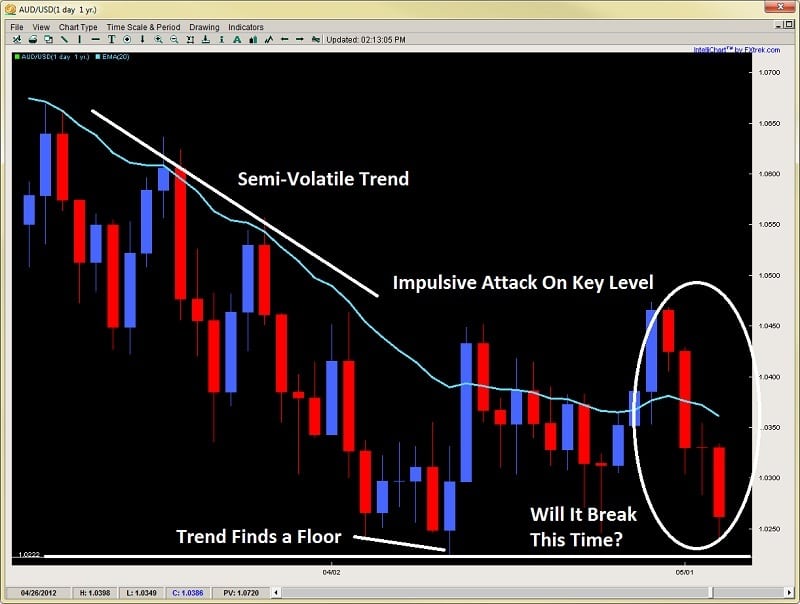
A good example would be the following chart below of the AUD/USD on the daily time frame
best support and resistance levels 2ndskiestrading.com AUDUSD chart 1

Price approaches the level with some volatility, as there are solid moves on both sides of the fence with bears maintaining control on the way down.  Price bounces off the level with a piercing pattern and then a second attempt forming a pin bar reversal.  But then after a small retrace, price attacks the level with vigor, selling off 4 days in a row, taking out the last 13 days gains.  Does this resonate strength to you?  Do you think it will break?  See the chart below

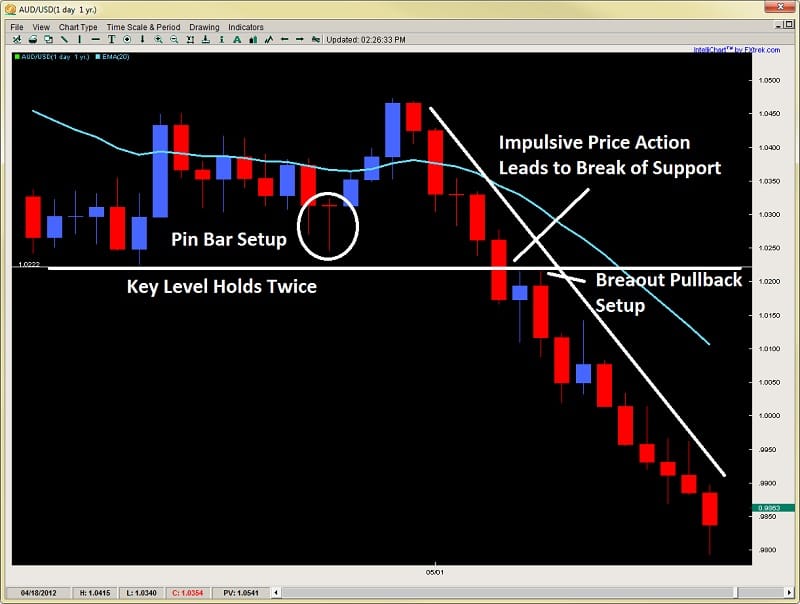
Exhibit B
best support and resistance levels 2ndskiestrading.com AUDUSD chart 2

As you can see, price was exhibiting a lot of strength and impulsiveness heading into the support level. There were definitely some clues ahead of time this was going to break.  Such as how price barely lifted off the level each time, and attacked it twice without ever gaining much ground to the upside.

Keep in mind, the trend was already down leading up to it, so with trend traders used these pullbacks to get back in the trend.  The last time they said enough is enough, and went to take out the barriers at this level.  The buyers at the support level likely exhausted themselves on the first two rejections which failed to gain traction.

Putting all these components together would have communicated a breakout was likely, which would have helped your current short, or give you a second opportunity to get back in on a textbook breakout pullback setup for a high probability-low risk trade.


In Summary

So there you have a few key variables to look for in finding the best support and resistance levels. Remember, price action patterns form at these levels and are the ‘effect‘, not the cause of the move. They do communicate information to us as traders, what we are looking for is the price action context before we reach these key support and resistance levels.  Hence, it is these key levels where orders are being placed first.

Thus, by learning how to read the price action and the key variables I listed above, you can greatly improve your ability to spot good setups, improve your entries, placing trades where weak players are getting in, and the stronger players are looking to enter.

Please make sure to comment below, and click on the like buttons to share this article 🙂

For those wanting to learn to trade price action, get access to the traders forum, lifetime membership & more, visit my price action course page here.