Tag Archive for: trading with the trend

Key Talking Points:

  1. False Breaks Offer Great With Trend Trade Setups
  2. Trading the False Break with Pin Bars
  3. Trading the False Break with Engulfing Bars

In my prior article on trading the false break strategy part 1, I shared the basic definition of a false break, covered what is the price action and order flow behind false breaks, and how we can trade them.

In this false break forex trade strategy article, I will discuss how you can trade them using pin bars and engulfing bars, along with entry, SL and TP techniques.

To Recap What A False Break Is
I generally define a false break as one of the two following scenarios:

  1. A break above/below a prior candle that fails to close above/below that candle
  2. A break above/below a key level, quickly reversing that level, and sparking a counter-trend move

Below is another example of a false break:
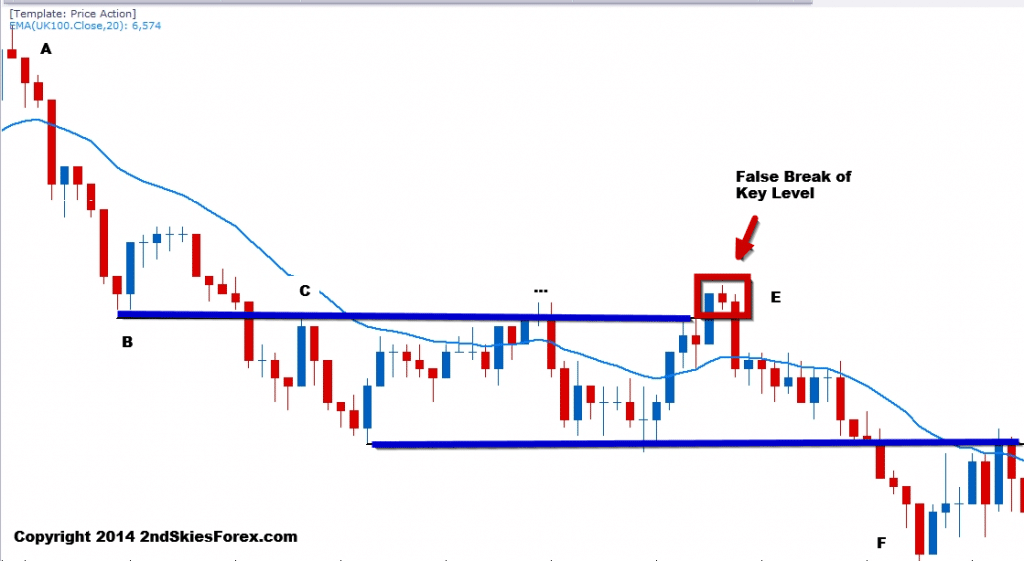
forex price action false break strategy 2ndskies c2

Looking at the chart above, we can see a clear downtrend, starting with A in the top left of the chart. The sell-off finds support at B, which eventually becomes a role reversal level at C.

Further along at E, we can see the textbook false break setup, just like we defined in the prior article. The pair breaks up above the key level CT (counter-trend), stalls, then sells off again breaking back below, and offering a great false break setup.

This sell off heads all the way down to F for a nicely profitable trade, and is a great example of a false break setup.

Now we will discuss how to trade the false break setup with a pin bar.

The Pin Bar + False Break Setup
Another type of false break setup is using the pin bar reversal pattern. In many ways, the pin bar by itself, can be a type of ‘false break’.

This is true if the body of the pin bar itself is housed within the prior bar. The breaking above/below the prior bar, and then closing back within that bar, is in and of itself, a type of false break.

What we are going to discuss is how we can use this to trade the false break strategy in combination with the pin bar.

A Pin Bar + False Break Example
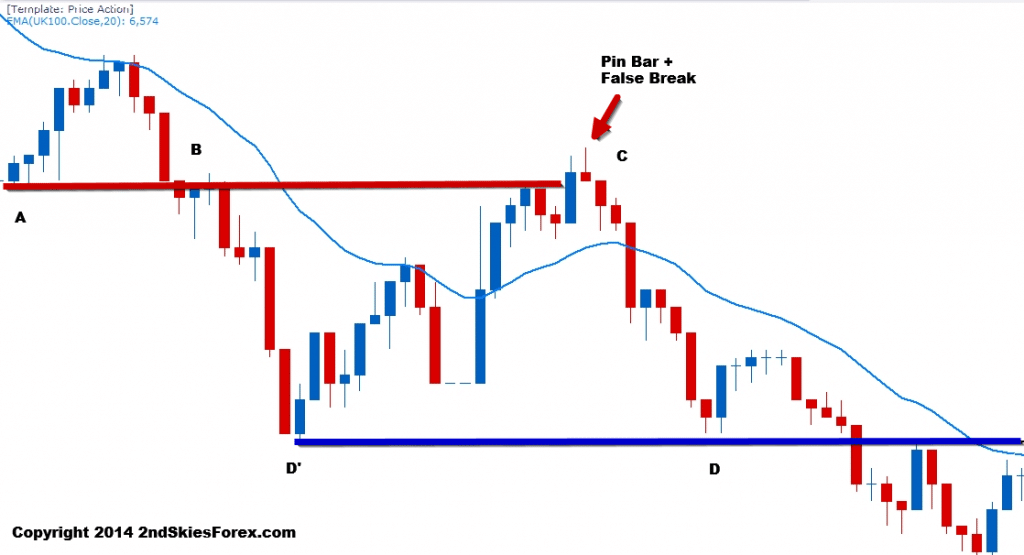
false break pin bar price action 2ndskiesforex c1

In this chart above, we can see at A (top left), there is a bullish move to the dynamic resistance (20 EMA). The sell off from the dynamic resistance to B only takes 3 bars, which means it was over 2.5x faster then the buying pressure at A.

From an order flow perspective, the sellers are stronger, since it took them less time to cover the same distance.

After breaking below the support level at B, the pair bounces at D’ towards C, (very same support level at A), hence a role reversal level.

Now notice at C how the pair briefly broke above A. If the buyers were really in control, they would have kept pushing prices. But the pin bar formed a false break above the highs of the blue bar (or prior bar).

This breaking above then back below, suggested a likely false break and more selling. The pair sold off from C to D, re-affirming the pin bar + false break setup.

NOTE: Observe how the support level at D and D’ formed another role reversal setup just after? This is a great example of trading with the trend.

Entry, Stop & Limit
If the pin bar represents a real false break, then the with trend direction should continue. Assuming I have read the price action context correctly, I generally like to enter using one of two methods:

  1. On a few pip break back below/above the key level
  2. On a pullback setup to the key level

The first entry method (more aggressive), can protect you from missing the move, as sometimes the false break never offers a second chance to enter.

For those wanting more ‘confirmation’, then I’d recommend the second entry method.

Now assuming the pin bar is the high/low in the move, I’ll put my stop just above/below the pin bar. For my take profit, if there is a prior level which caused the bounce/sell-off leading into the pin bar, then I’ll target that. One can use that as the only target, or as a first TP holding for a deeper move.

Trading the Engulfing Bar + False Break Setup
In reality, the engulfing bar + false break setup is not much different from the pin bar false break. I am still wanting to trade them with trend as much as possible, looking for a false break followed by an engulfing bar.

An Engulfing Bar + False Break Example
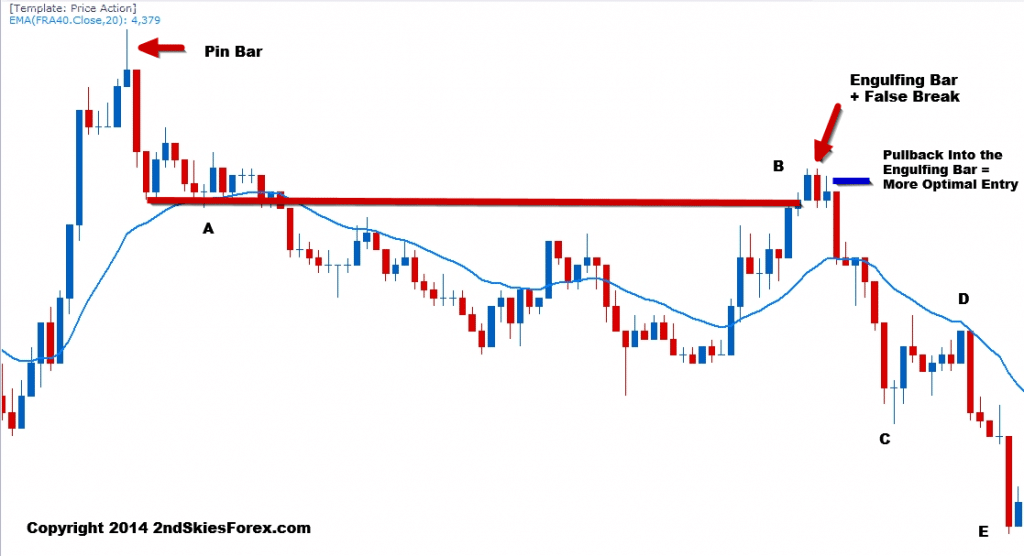
engulfing bar false break price action 2ndskiesforex c3

Turning to the chart above, we can see the strong selling stops at A. This forms a price action squeeze, which leads to a breakout and further selling.

The pair pulls back to B (the support level at A), and forms a false break. This is immediately followed by an engulfing bar.

Now ask yourself, if the bulls were truly in control, why did the price action immediately reverse after taking out A? This should have been a clue to watch for a false break.

You’ll notice right after the engulfing bar was an inverted pin bar. This is a failed attempt to rally, suggesting the buyers tried to push higher, but failed. What results is heavy selling from the open of the next bar down to C, and eventually E, resulting in a nice profit.

NOTE: Take a look at the move from C – D. This is a corrective pullback following an impulsive move. The corrective pullback went into the dynamic resistance (2o EMA), and then sold off heavily after.

This would have represented a great pullback setup, and is a good example of how impulsive and corrective moves manifest.

impulsive and corrective price action 2ndskiesforex
Entry, SL & TP
The entry, stop loss and take profit techniques are the same as the pin bar + false break. The only variation, would be if the engulfing bar closes back below/above the key level.

If it does, I’ll look to take a pullback into the engulfing bar, which is far more optimal entry as a whole. For more information on why the pullback is a more optimal entry for the engulfing bar, click here.

To Recap
In today’s false break forex trade strategy article, I talked about how false breaks offer great with trend setups. I then went into two more examples of the false break strategy, showing how you can trade them with pin bars and engulfing bars.

I shared entry, SL and TP techniques, along with explaining the price action and order flow behind these great setups.

These are just a few of the false break techniques available. If you want to learn more about trading the false break, along with other forex trading strategies, you can read more about my Price Action Course & Daily Members Commentary here.

Key Talking Points:

  • False Breaks Offer Great Price Action Trading Setups
  • You Can Trade the False Break Strategy with Pin Bars and Engulfing Bars
  • Look for False Break Setups Trading With the Trend

Ever tried to enter on a forex false breakout breakout setup, only to have the trade immediately reverse on you? I’m guessing this has happened to you many times (present trader included).
With the market volatility declining over the last several years, false breaks can and will happen all the time. The key to avoid getting stopped out, and actually profit from these false break setups, is to understand the price action context which often precedes them.
In this two part article series, I will begin today’s discussion by defining a false break. Next, I’ll go over a common false break setup, which is trading the false break with trend. Then I will go over a fundamental false breakout strategy, and conclude by recapping the key points.
What is A False Break?
I would prefer to define a false break as one of the following two scenarios: 

  1. A break above/below a prior candle that fails to close above/below that candle
  2. A break above/below a key level, quickly reversing that level, and sparking a counter-trend move

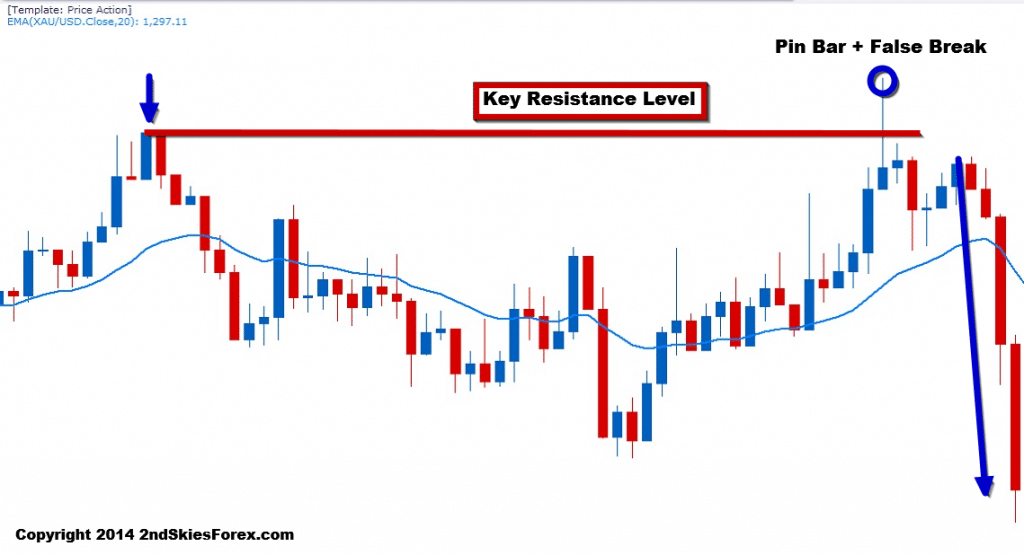
Below is an example of the first type with a pin bar + false break:
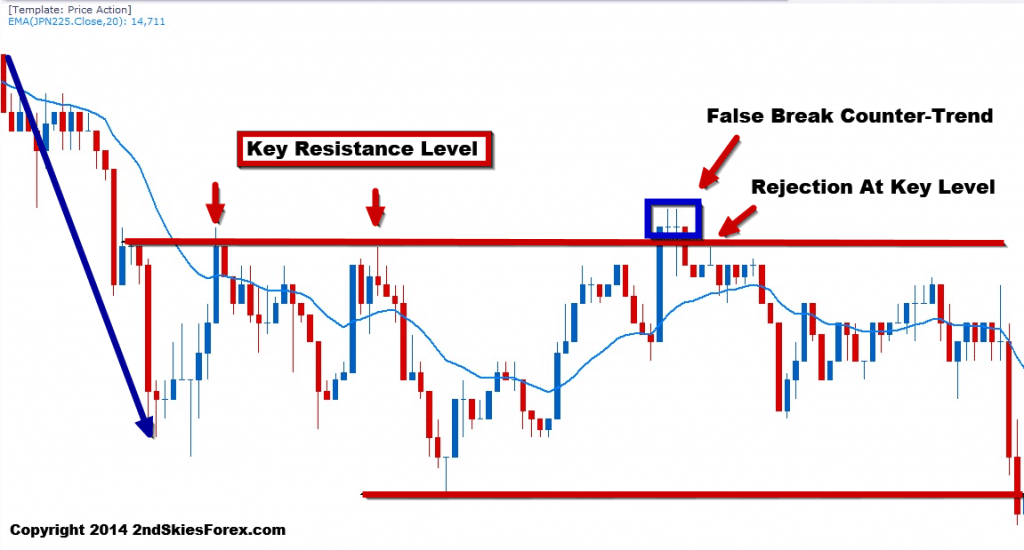
trading the false break strategy 2ndskiesforex c1
In the chart above, you can see the arrow to the top left, showing a bullish move running into resistance. The pair then settles back, and makes a second attempt to take out this key level.
But on the top right, you can see it forms a pin bar + false break.
From an Order Flow Perspective
Looking at this from an order flow perspective, the bulls were in control leading up to the level, and were able to push past it. Either there was massive profit taking on their part, or they ran into heavy sellers a few layers deep behind the level.
Regardless, the sellers over-whelmed the buyers, and pushed the pair back below the key resistance level. After a second attempt to regain the level, the sellers realizing they had control, sold even more, pushing the pair down impulsively.
Trapping Traders
In most false breaks, there are ‘trapped traders‘, meaning traders who are caught long when the pair is about to go short, or vice versa. Those trapped traders once the trade goes negative, will likely be stopped out, & further fuel the counter-trend move.
The more savvy traders will exit manually when they realize they are trapped, while the slower traders will likely get hit for the full stop. There are price action clues to tell when you’ve been trapped, but that is for another article.
Trading The False Break Setup With Trend
It should not be surprising, one of the best false break setups occur when trading with the trend. This is because the underlying order flow is heavily imbalanced, meaning it’s heavily bullish or bearish.
When a false break setup forms counter-trend, it usually runs into buyers or sellers who are happy to take the pullback getting a better price. Their overall strength in the market makes it harder for counter-trend false breaks to be maintained.
This is why false breaks present such great trade opportunities.
Below is a classic example of trading the false break setup with trend:
trading the false break strategy 2ndskiesforex c3
In the chart above, starting with the top left, we can see the heavy impulsive selling. Eventually this leads to a bounce which hits the key resistance level 2x (marked by two red arrows). After forming a new low (red line at bottom), the pair bounces to retest the bears at the same resistance level.
Now note how the pair breaks above this level with a really large blue bar, closing at the highs. Ask yourself, if the bulls were really in control, how come they did not produce any follow through?
The next two doji candles showed no real strength or follow up buying, which should have been a warning sign to any bulls already long. Bears wanting to trade with trend, should have been looking for the false break and close below which they got on the 3rd candle.
Entry, Stop & Take Profit
With such a clearly defined trend and resistance level, there are two general entry techniques;

  1. Sell on Break back below the key level
  2. Wait for pullback setup to the key level

More aggressive traders who feel confident in their price action skills may sell on the break back below the key level. This may or may not offer the best price, but you may not get a second chance to enter if the sellers came in hard on the false break.
More conservative traders can wait for a pullback setup to the key level. If the false break is real along with the level, then the trade should hold and not go much into the negative.
I generally recommend placing the stop above the high (or below the low) of the false break by a few pips, depending upon the volatility and liquidity of the instrument.
The first target should be the other end of the consolidation. If you want to go for multiple targets, then the next key support or resistance level would be suggested.
To Recap
In today’s forex false breakout article, I talked about the price action and order flow behind a false break setup, and why it can be a powerful trade opportunity. I discussed the two types of false breaks and how to generally define one.
Lastly, I covered why to look for with trend setups trading the false break, giving the entry, stop and take profit methods.
When you learn to read price action in real time, you will begin to spot these false break setups more easily. As you get skilled in identifying them, you will avoid the common traps, and profit heavily from them as they offer great opportunities.
In the second part of this article, I will talk about using a false breakout strategy with pin bars and engulfing bars.

Recently I got a question from a newer student asking the following;
“Right now I’m short this pair. It’s in profit, but it just formed a pin bar against my trade before I hit my profit target. What should I do?”
This is a common question I get about what to do when you see a price action signal that is counter to your trade. The question by itself actually tells me a lot about the student and where they are at in their process (beginning, middle or more advanced).
My response was similar to the following;
“It is important to understand we are not pattern traders. We are price action traders. Being a pattern trader, as in trading pin bars, inside bars, engulfing bars, or fakey’s does not make us a price action trader.
Pin bars are not the death of trends. I can come up with about 50,000 examples of trends both intraday, or on the 4hr and daily time frames whereby the trends ran into a pin bar at a key level, then smashed right through it. I can also come up with thousands where they did the same and reversed.
‘Wait, but those were counter-trend pin bars, what about with trend pin bars?’ 
Same thing, I can come up with 50,000 of those that were with trend, and the market reversed the prevailing trend. I can also find you thousands that were with trend and worked out.
So what was the difference between the ones that did work out and ones that didn’t?
The key was the price action context around the pin bar. How the price action was leading up to the pin bar, and around it (the context of how the pin bar formed) is what will make that signals useful or not.”
This is why it is such a freshman idea and a complete fallacy to think all you need to trade successfully is 3 simple patterns (pin bars, engulfing bars, inside bars). All that + trading with trend at key levels and VOILA! You have your A+ setup and a profitable price action trade.
If it were only that simple (FYI – if it were, a lot more people would be profitable).
So how do you deal with a counter trend signal to your trade?
The answer is in reading the price action context around it. I will share four charts below to demonstrate the point clearly.
Exhibit A
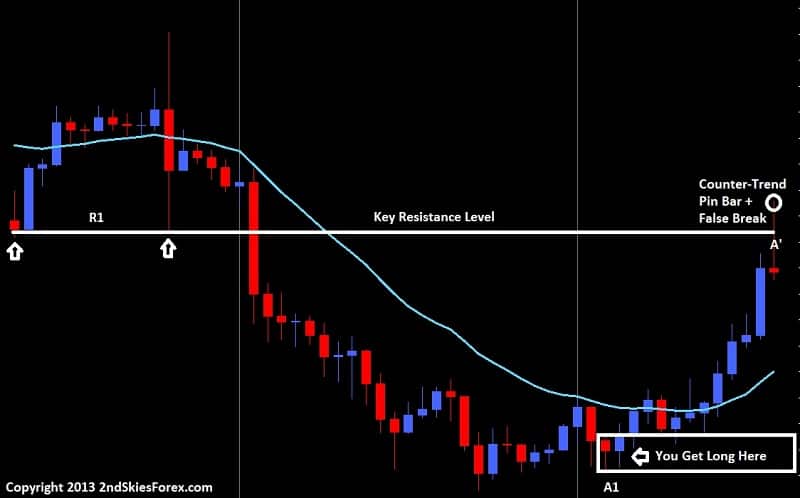
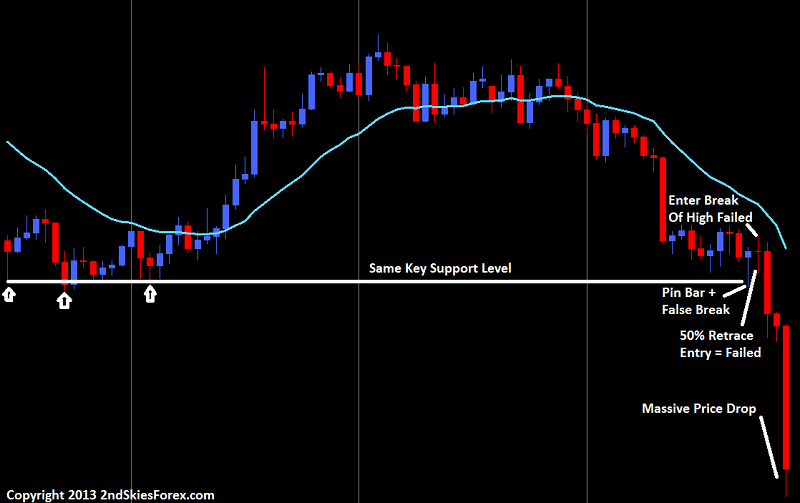
Looking at the chart below, we can see towards the left a double touch off the level R1, then a break through it with a large breakout bar. The market falls heavily and you look to get long around A1 on the bottom right of the chart. Your trade is working out great, but you run into a pin bar + false break (A1) at the key resistance level R1.
price action counter trend trade pin bar key level 2ndskiestrading.com
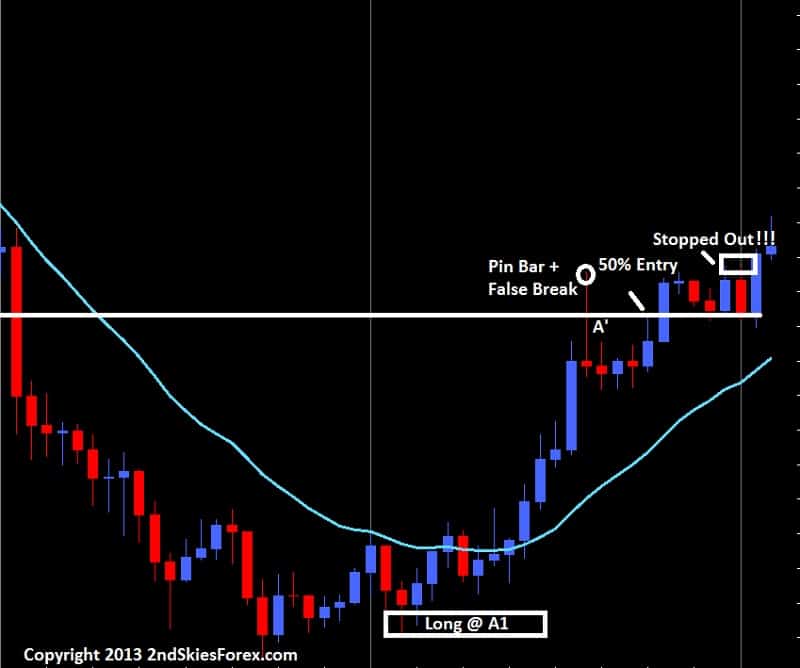
Minions of the 50% retrace entry on the pin bar are salivating because they think this is a great chance to short as you have a pin bar + false break at a key level, and the 50% retrace is at the level.
Meanwhile, you being long back at A1 see this pin bar and are worried about the market reversing thinking the move is over, so you exit.
Turns out both of you were wrong (see chart below)
pin bar 50 percent retrace entry failed price action context 2ndskiestrading.com
Exhibit B (later on in the same chart)
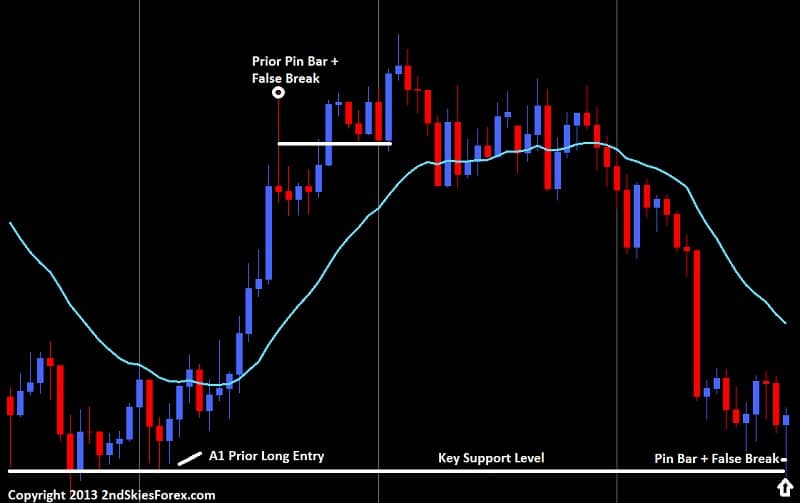
In this next chart below which is only a couple days later on the same pair, price eventually falls back to the same key level where we bought at A1 prior. It forms a consolidation just above it, then a pin bar + false break.
pin bar false break price action context 2ndskiestrading.com
Great! Time to get in on the 50% retrace entry yes as its at a key level. Or, the other option touted is to get long on a break of the pin bar high yes? Either way, this is an A+ setup right since the pair is in a range and formed a pin bar at a key level right?
See the next chart below
price action context pin bar entry fails 2ndskiestrading.com
Turns out both pin bar entries failed, even though it was at a key level while price action was in a range. Now imagine you were long around the top of this chart, and ran into this counter-trend pin bar signal at a key level. You probably would have taken profit.
But by not understanding the price action context around the level, you would have missed out on a ton of profit, almost double your profit leading up to that pin bar.
This is why its important to graduate beyond the freshman concepts of trading pin bars, inside bars, engulfing bars, fakey’s, or whatever price action patterns. If trading were that easy, as in trading with the trend + key levels + price action signal = profitable trading, then a lot more people would be making money.
The difference between knowing when to take those signals is in learning to read the context and order flow behind the price action. Pin bars are not the death of trends. Nor are the other patterns. In isolation, or even with trend analysis + key level analysis does not make it a good trade.
Thus my answer to this students question about what to do when you see a counter trend price action signal to your trade – my response is to understand the order flow and price action context around that signal. When you begin to do this, your trading will start to turn. You will find yourself winning more trades, and holding onto trades longer. And while others are buying this last pin bar – you are selling it, and you’ll understand why.

Often due to low liquidity, summer forex trading can be fickle, whimsical and often times dull. Staring at charts for hours or days when the price action is slow isn’t going to make you a better trader, or make more profits. We need to be using our time to improving our edge whether we are trading or not. So what do you do when the ‘watching the corn grow‘ moments come by?

Read more