A Trading Quiz on Price Action Trading Part 2
Last week we posted a trading quiz on price action trading which went over 3 charts on 3 separate instruments. I did not show the prices, nor the time frames of the charts, so you had to rely upon your pure price action trading skills to read the charts.
The task was to analyze each chart and determine if you would either a) trade with trend, b) trade counter-trend, or c) no trade at all.
You were also asked as to why you’d trade each chart the way you did, at what levels, and what you saw in the charts from a price action perspective.
We got a lot of really good answers, and I offered a $50 discount off any course to the ‘winner‘ (i.e. the person I thought offered the best overall answer closest to mine).
Before I get into the winner, I’m going to share with you how I traded each chart (or didn’t), what I was reading in the price action, and why I traded the way I did.
Let’s jump into the charts. First I’ll post below the charts I shared last week. Then I’ll show you the actual instrument, time frame, along with how I traded each chart.
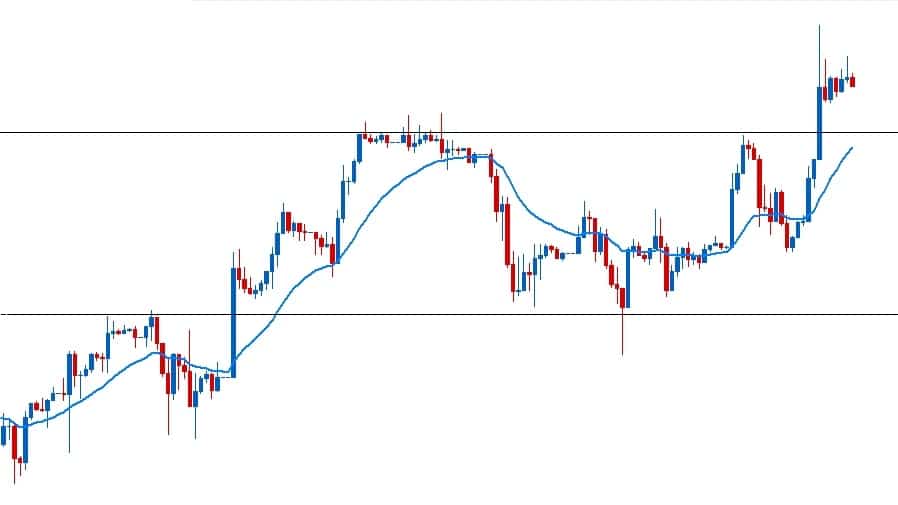
Price Action Chart #1
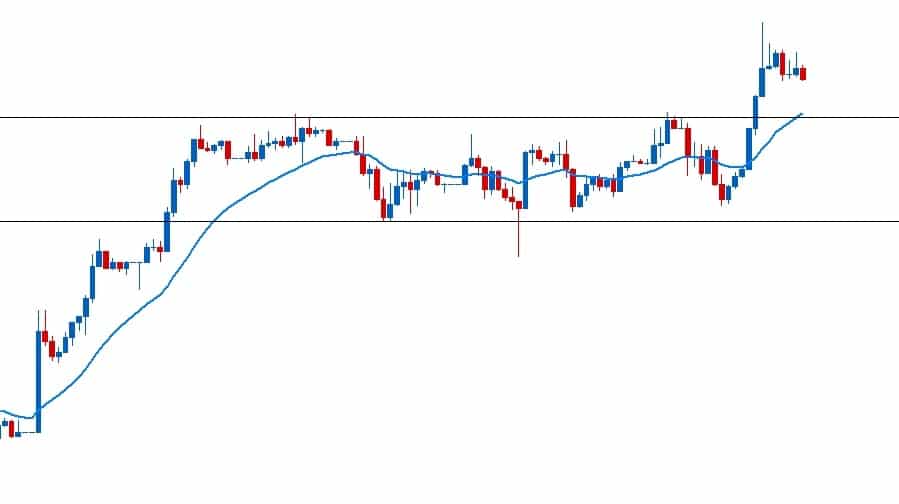
Price Action Chart #2
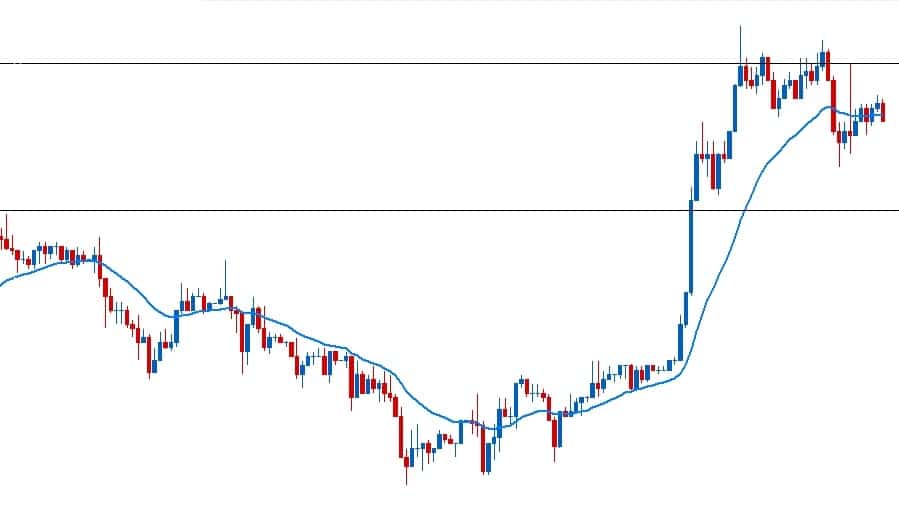
Price Action Chart #3
Details Around Each Chart
All the charts you saw above were the 1hr charts. In order, they were the:
1) German Dax 30
2) French CAC 40
3) Japanese Nikkei 225
The blue line was my typical 20 EMA which I often use as dynamic support and resistance. Let’s show each chart individually as to how I traded it and what I was reading in the price action.
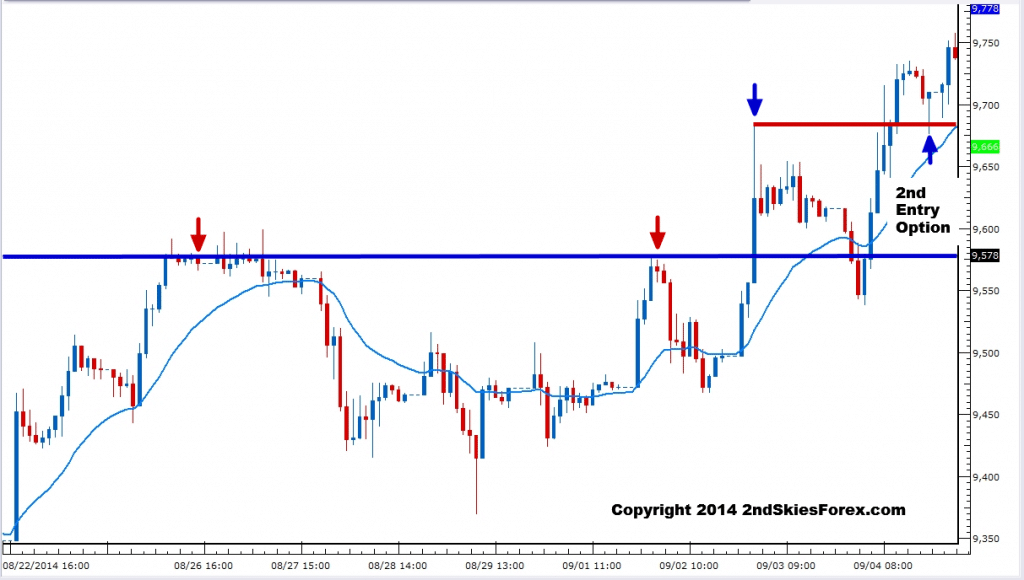
Chart #1: German Dax 30 (No Trade)
In the chart above, we have the large breakout candle and long upside wick at the first blue arrow in the top right of the chart. I was looking for a counter-trend pullback, but wanted the price action to drift correctively up towards the wick highs. However, this never happened as it just remained inside the middle of the candle and lower edge of the wick (hence in the middle of a range).
Selling near 9650 was a potential option, especially with 3 wicks near there before the sell-off, however, if the heaviest sellers were up at the top of the wick, i’d have to put my stop above there, and thus would have had a poor risk:reward ratio since the natural downside target would have been 9578.
Including the spread, the most R I could have gotten out of the trade (if 9578 was going to hold) would have been ~1.4R, which is not what I like to see when trading counter-trend.
Ideally I can get 3-4+R per counter-trend trade, otherwise it’s not worth it due to the lower probability nature of CT trades.
Hence, I let the counter-trend short go.
Regarding the with trend trade option, the best trade idea would have been to buy at 9578 assuming it would hold. I actually did not buy this, mostly because I was already in trades on the other two charts and this one seemed the least ‘favorable‘ to me.
To be frank, I probably would have gotten stopped out if I did. Why?
Because I would have placed my entry near the 9578 level with no more than a 20 point stop. The reason for my stop placement in role reversal setups off a level, is if the level is truly going to hold, then you should not need a large stop above/below it.
Depending upon the volatility and price action around the level will determine how big my stop is. 20 points should have been more than enough. Regardless, had I traded this, I would have been stopped out easily.
As you can see, the pullback became quite impulsive heading into the level, and went 1 full bear bar past it, sub 9550. Had I traded this, I would have lost 1R.
You will notice a red line near the top left of the chart. This was a 2nd entry option to trade with the trend, but I missed that one as well. I like to mark certain places on a chart where I could have added a position, or taken a trade.
The reason for this is, when you review your trades at the end of the week, looking at these patterns will eventually go into your trading database in your brain.
By seeing these charts with potential trade ideas, the next time a similar setup comes up, you increase the chance you’ll a) recognize the trade opportunity, and b) pull the trigger.
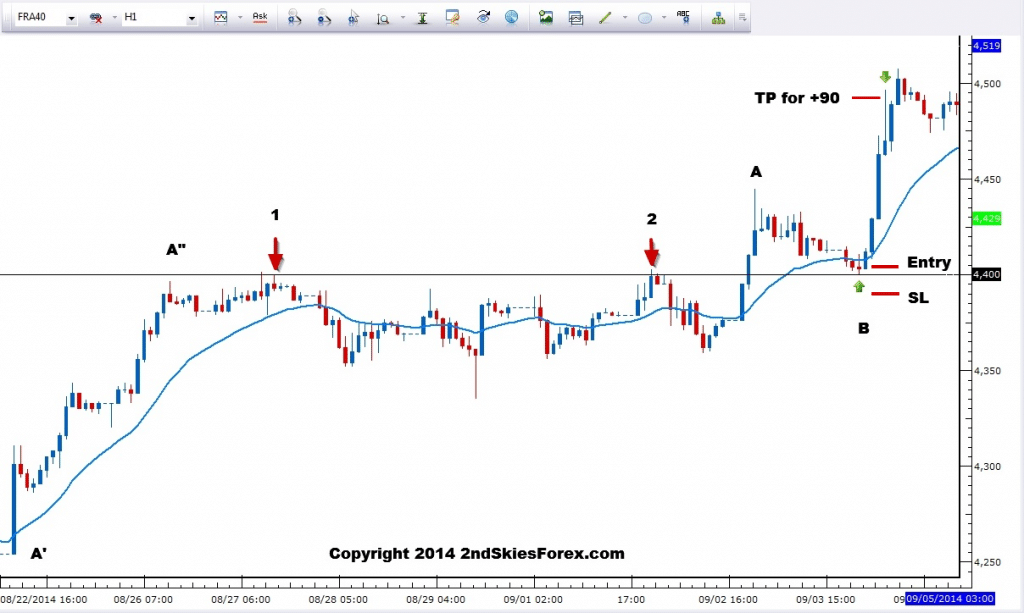
Chart #2: CAC 40 (Buy off Support on Corrective Pullback)
In this chart above, you’ll notice at points 1 and 2 the price action reacted really cleanly off the round number and 4400 level. Notice on the pullback after point 2, we see strong buying interest emerge from the bottom of the consolidation just below 4400.
This leads to a strong breakout up to A, and then a very corrective pullback. If you contrast this to the Dax chart above, minus the 1 large bar bar in the corrective pullback from A to B, the bars heading into the 4400 level were not getting bigger, but smaller.
This usually means the selling pressure is being absorbed by the buyers. If the sellers are increasing in strength, the candles should be the same size, or getting larger. But instead they weren’t, signaling the order flow was still with the bull side as they were likely buying a few points above the level.
When I see corrective pullbacks like this heading into a key level, I’m going to buy that in favor of the trend with a stop below the key level.
Including the spread, my entry was 4405 and targeting 4495, which I had mentioned in prior commentaries. I chose 4495 as I wanted to be a few points below the big figure at 4500. With a 15 point stop and 80 point target, total profit was +5.3R in 5hrs.
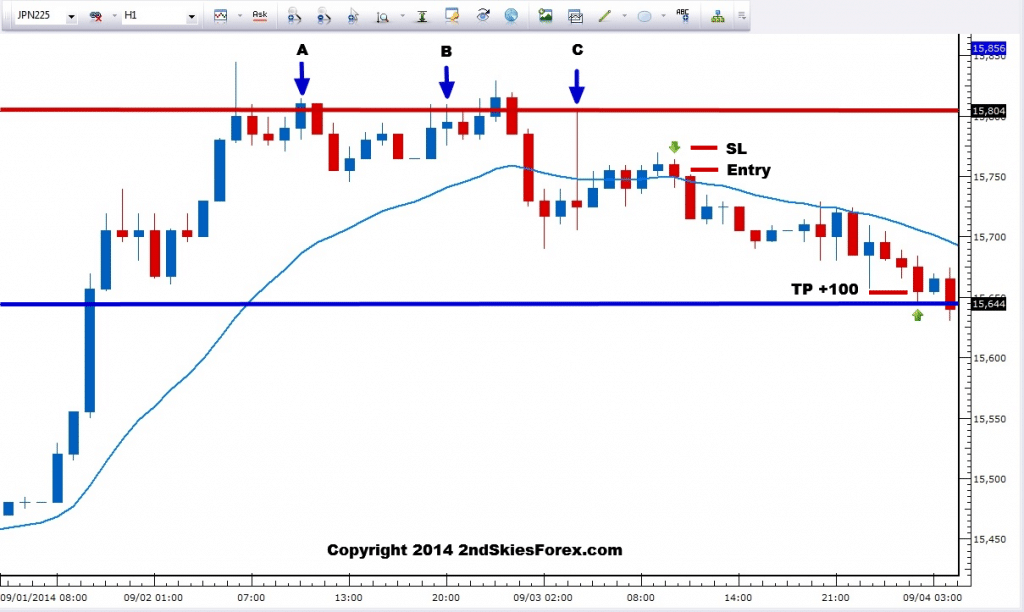
Chart #3: Nikkei 225 (Counter-Trend Sell)
In this chart above, I felt this was the most prime for a good counter trend trade. Why?
Looking at the chart above, notice the triple rejection off 15804 with the blue arrows A-C. What interested me in trading this one counter-trend, was two key points;
1) The impulsive selling after the rejection at 15804 at B, and
2) The long tailed pin bar rejection at C
To be honest, the best setup was at c, placing an entry to sell at this level. This offered the higher risk to reward setup, especially if the impulsive selling from B was sellers truly taking control.
I missed this trade, and feel like I should have gotten it, but I didn’t.
But then the pullback after the long tailed pin bar from C was incredibly corrective. This matched the impulsive selling at B theory the bears were taking over control short term.
The weak corrective pullback after c also suggested the bulls were unlikely to re-attack 15804 after failing 3x. If anything, they’d wait for a deeper pullback level, which to me was 15645.
As I was watching this corrective pullback just before my entry, my gut was telling me this was going to sell off towards 15645. The key now was where would I place my stop.
The only way this would have worked out with a healthy R:R ratio, would have been with a tight stop. And that option really only existed if I could place my stop above the prior bull candle to my entry.
Basically I was sensing the corrective pullback was about to end, and if my timing was right, I could have a tight stop and solid R profit.
I placed my entry at 15755, with my stop 20 points above, and a 100 point target.
Turns out my timing was right, as the index sold off, and never recovered above the 20 EMA. 15 hours later, I hit my target of 15655 (just a few points above the projected support for +100 points and +5R profit.
You will notice the pullback to the level was a little ‘slow’, meaning there was a mix of bear and bull candles. This is common in counter-trend trades, because you are fighting the natural order flow in the market (in this case bullish).
Contrast this to the with trend trade on the CAC 40 which was all bull candles, thus virtually no selling orders present in the market on the way up.
Now could I have bought off the 15645 key support level for the Nikkei 225 chart? Probably, and that would have been quite prudent of me, especially if I was assuming the uptrend was still favored.
Whether I would have lost or won that buy is irrelevant. One trade by itself is irrelevant. The question is will that trade profit over 100 or 1000x, and my read is yes. This is why you have to trade and think in probabilities.
You will notice many of these charts were all displaying similar behavior. When presented with several charts displaying concordant price action context and opportunities, I always prefer to trade the ones with the most clear setups, and the greatest strength in favor of my trade.
The strongest counter-trend trade to me was the Nikkei 225. The strongest with trend trade was the CAC 40 trade, hence why I traded them.
In Closing
We cannot be afraid to trade counter-trend. There are times when trading counter-trend offers some really good opportunities, and we have to take those trades.
As a whole, counter-trend setups are a lower probability setup in contrast to trading with the trend.
Because of this fact, I prefer looking for larger R trades because the lower accuracy will be offset by the higher profit long term.
We also want to make sure there is a confluence of price action elements in our favor when trading counter-trend. If you were just a typical pin bar, engulfing bar, or inside bar trader, you would have missed all these setups.
It is the most ludicrous idea to me (and other professional traders) that you only take trades when 3 simple patterns emerge.
This faulty assumption is that there are only 3 good trade setups in this giant market, with all the different incarnations in the price action.
I’m not sure about you, but that sounds like a ridiculous idea to me.
(NOTE: For some great book which annihilates the idea there are only 3 price action patterns to trade, read Mike Bellafiore’s book The Playbook)
You will also notice I was trading pure support and resistance levels, not any particular price action 1-2 bar pattern. I was reading the price action context in real time, not sitting idle waiting for some simple patterns before I’d engage the market.
By waiting for some magic 1-2 bar patterns to emerge, you isolate yourself off from really good trade opportunities that occur all the time. In many cases, these other price action setups I speak of offer higher risk:reward setups than the patterns themselves.
Also, you will notice how clean the price action was in many of these charts. They were all on the 1hr chart, but you will see these types of setups on any time frame from the weekly down to the 5 minute (or 1 minute chart).
The skill of learning to read and trade price action in real time can be applied to any time frame. However, if you spend your time only trading 1-2 bar price action patterns, you will never build this skill set.
Lastly, you do not have to wait around for days to gather a +2 or +3 R trade. Waiting for weeks or almost a month to get a simple + 2R is a complete waste of time and your capital. The feedback loop before finding out if your trade was correct or not severely slows down your learning process.
Imagine a football player, golfer, or piano player waiting for weeks or months just to find out if one play, golf-stroke or run of the keys was correct (or not). That should point to you how damaging this is for your learning process.
Food for thought.
Announcing the Contest Winner:
There were some really good answers here with many of you showing really good price action skills. Because of this, I’m giving a $50 discount to the winner (off any course), a $40 discount to 2nd place, and $30 off for everyone else who participated. For those that did, make sure to email me for your discount via the Contact Page and how to take advantage of it.
Based on all the answers, I’d give the nod to Falco for the best answer (most complete and closest to mine). Hence Falco can get a $50 discount off any course. I’d give 2nd place to Larry, so he’ll get a $40 discount off any course. Congrats to both of you!
I’d like to thank you all for participating, taking time to really think about this, and dig into your price action skills. Trading in hindsight is always easy, but having to make decisions when the charts don’t look perfect or form the ideal setups is where you are really challenged. Ironically, this is how the price action looks most of the time on your charts.
This is why it is helpful to engage in many learning opportunities, other than watching videos, reading lessons, and then making trades. Your learning and training has to be multi-faceted, including live forward simulation trading, time to review your trades, along with building your pattern recognition skills.
As traders, we must always test our skills, no differently than a professional athlete is constantly testing theirs. This constant training and testing (which never stops) is what elevates our abilities to profit in this market, and continually find a greater edge. This is what is required for those who want to trade successfully.

Awesome article, Chris.
I really enjoy it when you breakdown your thought process of reading the order flow behind what we see on the charts. Reminds me of your PA webinars.
Great stuff.
Hello Gabriel,
Am glad you enjoy the break down of the thought process, order flow and price action in the charts.
Hopefully it adds to your understanding of PA.
Kind Regards,
Chris Capre
Hi Chris,
Thanks for the discount =). This article made me realize that there are other things on the chart that I didn’t notice. I saw this setups over and over again. Your analysis gave me some wisdom on whether to pull the trigger or not, whether to put limit orders or wait for some confirmation.
Hello Larry,
Well you earned it as your response was quite good.
There are always things in the charts we will miss, which is why we train continually to see deeper into the chart.
But am glad it gave you ideas on where to pull the trigger, where to put orders and where to look for confirmation.
Kind Regards,
Chris Capre
Hi Chris,
Really enjoyed the quiz and learnt so much from your analysis and thought process.
You are a very gifted trader and teacher,so pleased i found you before i gave up !
Quick question, would it of been o.k to trade long the Dax after it broke back above the role reversal level suggesting a false breakout ? I see on a 15 min chart it gave a lovely pin bar after breaking back above the level….
Learned a lot from this quiz…
Thanks Chris..
I hope you will include many such quizes in the future …I found this,one of the best way to learn missing aspects.
So happy to be your student
Cheers
Jobi
Good to have you as a student Jobi, and glad you found these quizzes to be quite helpful.
Kind Regards,
Chris Capre
Hi Chris,
Great article! I really enjoyed reading about your thought process and what made you decide to take the various trades you took.
By the way, has your book been published yet?
Hello Yanbo,
I am glad you liked the article and enjoyed the thought process/decisions and explanations.
The book has not been published yet. I don’t resume writing on it till mid-October.
Kind Regards,
Chris Capre
hello chris..
great work as always.. although its past now yet alot to learn in this way.. i really liked the idea of learning this way.. appreciate your effort to make this compitition healthy with incentives..makes it easier for brain to do the hard work.. looking forward for another oppertunity to win 🙂