Trading the Tenkan Kijun Cross
This is by far the most popular of the trading methods in the Ichimoku Cloud trading arsenal.
It is simple, elegant and great at picking up trends and trend reversals. If you like trading trends or momentum trading, the Tenkan/Kijun cross is a great method to use.
What is the Tenkan?
The Tenkan Line or Tenkan Sen (Sen means line in Japanese) is known as the conversion line or turning line is similar to a 9SMA but actually is quite different. An SMA (simple moving average) will smooth out all the data and make it equal, but the Tenkan Line will take the highest high and lowest low over the last 9 periods.
The explanation for this is Hosada felt price action and its extremes were more important than smoothing any data. This is because price action represented where buyers/sellers entered and directed the market, thus being more important than averaging or smoothing the data out.
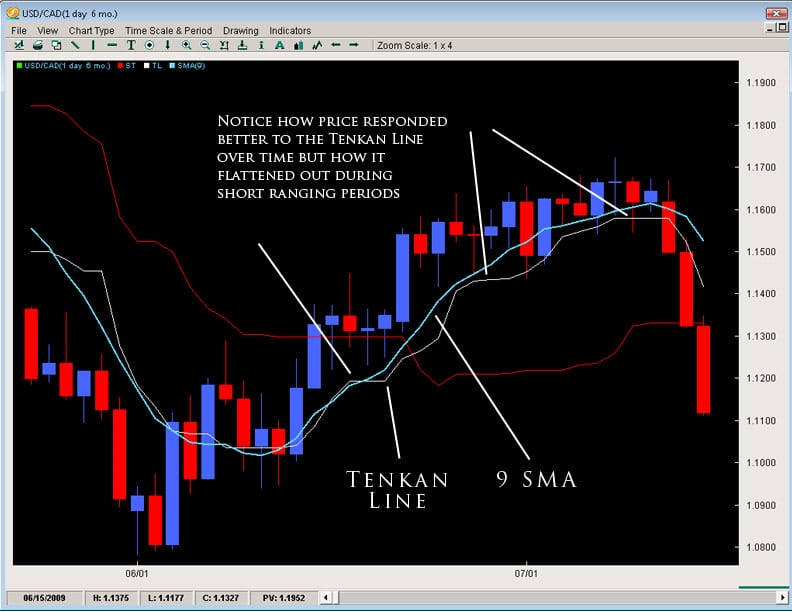
As you can see by the chart below, the Tenkan Line is quite different than a 9SMA. Because the TL (Tenkan Line) uses price instead of an averaging or the closing prices, it mirrors price better and is more representative of it. You can see this when the TL flattens in small portions to move with price and its moments of ranging.
Akin to all moving averages, the angle of the Tenkan line is very important as the sharper the angle, the stronger the trend while the flatter the Tenkan, the flatter or lesser the momentum of the move is. However, it is important to not use the Tenkan line as a gauge of the trend but more so the momentum of the move. However, it can act as the first line of defense in a trend and a breaking of it in the opposite direction of the move can often be a sign of the defenses weakening.
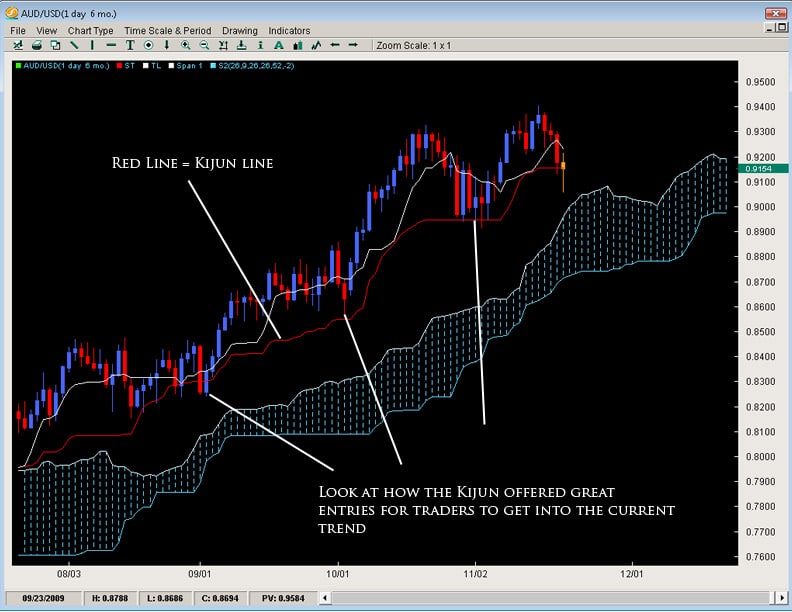
The Kijun Line (or Kijun Sen) is known as the datum line, standard line or trend line designed to indicate the overall trend for the instrument or pair. The formula behind it is the same as the Tenkan line using price action and the highest high + lowest low with the only change being in the periods as it does it over the last 26 periods.
Why 26 periods? The answer to that is a matter of history. When the Ichimoku was first created, the Japanese markets were open 6 days a week on Saturdays. If the markets are open 6 days a week, this generally results in 26 trading days for the month – hence 26 periods for the Kijun.
In essence, what it was meant to be was a measure of the highest high + lowest low for the last month of price action. If the Kijun has been climbing – it means price has been gaining ground for the last month. If it is flat, then it will be the midpoint of the range of price for the last month of price action (or representative of the price equilibrium).
Also like the Tenkan Line, the angle of the Kijun is reflective of the overall trend in place. Price breaking the Kijun after being in an up/down trend often has serious consequences for that trend and can many times lead to a reversal of sorts. Ultimately because it uses a longer period to measure price action, its a more stable method for determining the direction of the trend than the Tenkan Line.
Because of price to respect this line during a strong trend, it can potentially be used as a stop loss for traders already in the correct direction of the trend. Hence, when price breaks or closes below it by a significant amount, the trend is often over.
Applications for the Tenkan and Kijun
The most common usage of the Tenkan and Kijun are the ‘cross’ or what we call the TKx (Tenkan-Kijun Cross). Similar to how a MACD uses a cross of its two lines, the Ichimoku Cloud does the same. It is interesting to note that the Ichimoku uses the same periods as the MACD, however it was created over a decade earlier.
One of the main signals for Ichimoku traders, the TKx can often indicate when a trend is about to begin by forming a cross (upward cross = possible upward trend while downward cross = possible down trend). A generic upward cross can be used as a bullish signal (or exit for people already short) and a generic downward cross can be used as a generic bearish signal (and vice versa for current bulls). However, notice we used the term ‘generic’ meaning there is more to the cross.
Hosada was able to give a further definition to the cross based upon its position to the Kumo or cloud. If the cross was below the Kumo, then it was considered a ‘weak’ signal since the cross was below the Kumo or below resistance. A medium signal was when a cross happened inside the Kumo as it was occurring within the field of support/resistance. A strong signal was when the bullish cross happened above the Kumo as it was happening after clearing resistance. The opposite is true for bearish signals whereby a weak signal is a cross above the Kumo, while a medium signal is inside the Kumo and a strong signal below the Kumo.
One important reminder to all this is to make sure you reference the Chikou Span to see how current price is in relationship to previous price action.
Exhibit A – Tenkan / Kijun Crosses
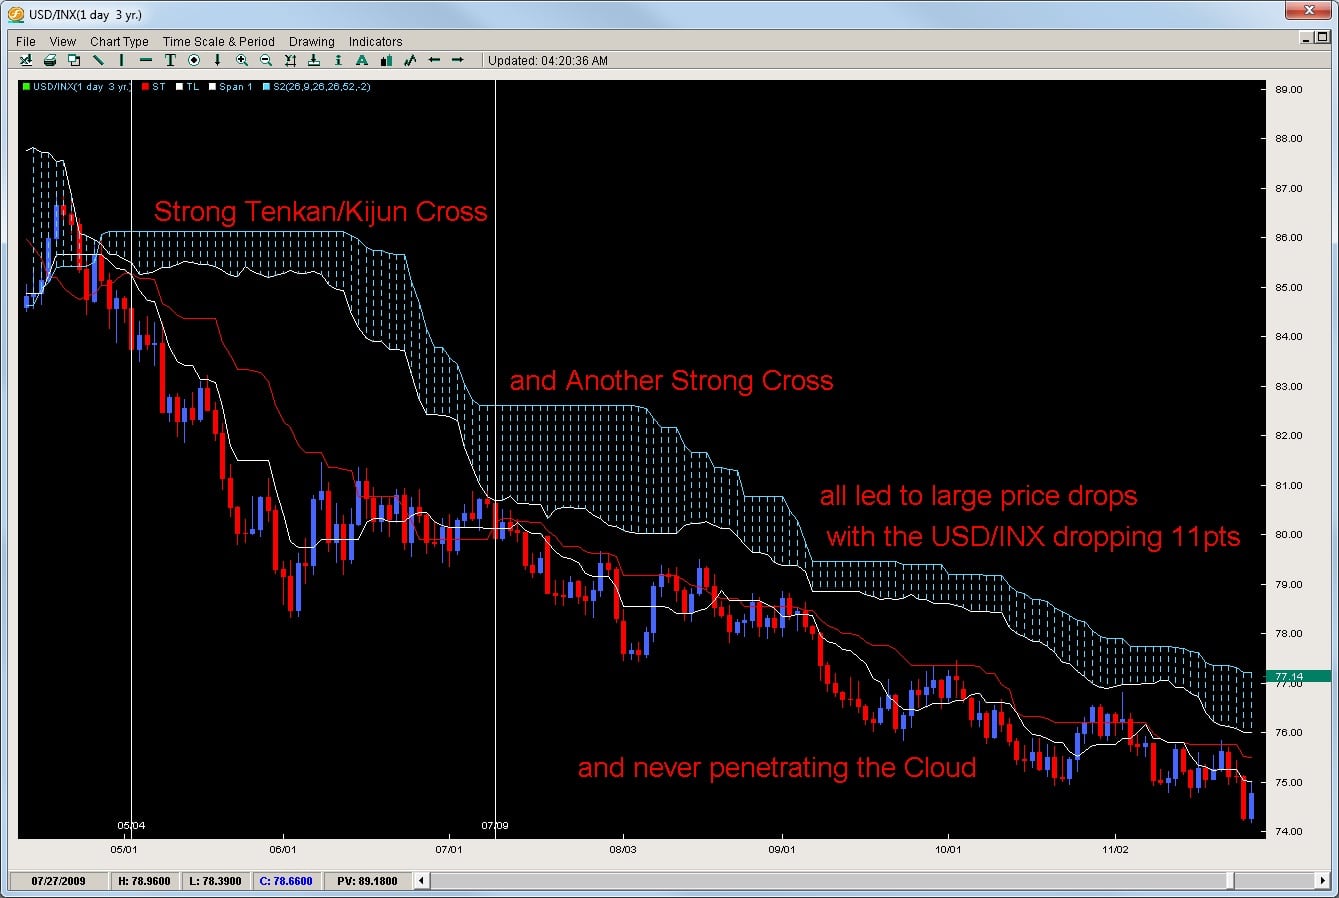
Take a look at how the USD/INX gave 3 strong downward crosses with each move selling off nicely and never penetrating the Kumo highlighting the downtrend.
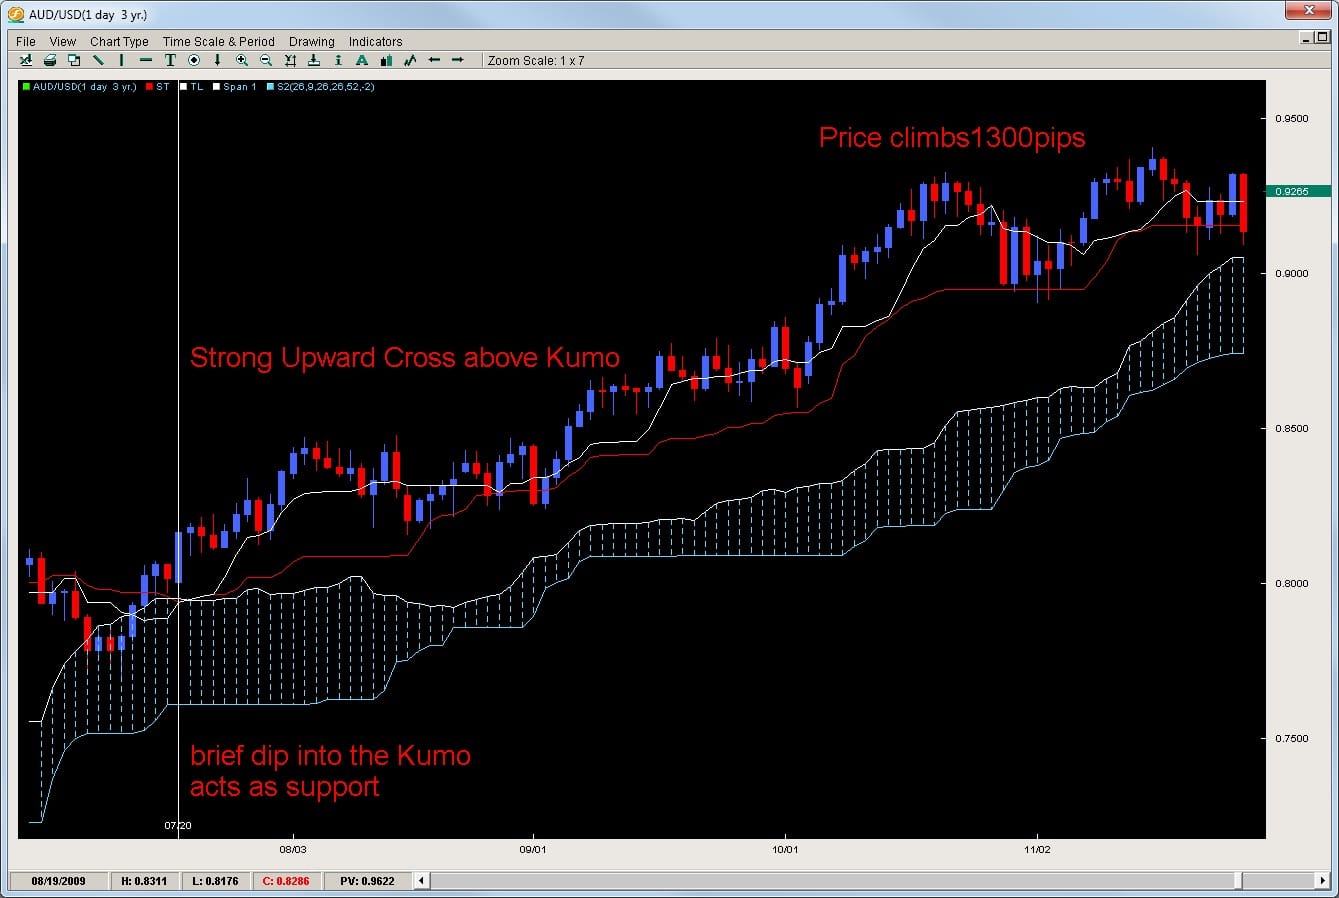
In another example, the AUDUSD gives a nice upward cross in an already established uptrend. First it entered the Kumo but had a very shallow penetration leading to a strong upmove over 1300pips from the Tenkan/Kijun cross.
Closing
There are many important factors to consider when trading the Tenkan/Kijun cross such as time frame, kumo shape/configuration, previous moves-series of crosses, angle/shape of the cross, etc.
We have proprietary quantitative data on all pairs for the last 10 years to give you an edge when trading the Tenkan/Kijun cross. To get access to this data, or learn how to trade the Ichimoku on an advanced level, check out the Advanced Ichimoku Course.


Hello Chris, I have been following your Forex trading setups videos for a while now (I’m a subscriber)and feel that your courses may really be what I am looking for.
I own and run a Liquor store in Melbourne, Australia, and although profitable, is not a long-term income generation option for me anymore. It’s a BRUTAL grind that I have been doing for too long and looking to exit out of at some stage…
A couple of quick questions if I may:
1)If you had to estimate, how much capital (using tight money management/stop loss protocols of course!) would be required using your Advanced Action and/or Ishimoku courses to generate a $US6-8k per month income? Is that income achievable in the short term or do I need years of experience
2)This ties in a bit with Q1, but what trading platform would I need to use to utilize your system? The Ishimoku cloud charts look amazingly powerful and profitable. How much would that cost?
2)Am I right in thinking these courses provide some really STRONG higher probability fundamental setups that are relatively easy to learn and that I can trade pretty much immediately? I would rather take 10 REALLY STRONG trades (with more total contracts per trade)per month, than have 5 really strong, 3-7 strong and 5-10 ‘good’ trades. Is that a good strategy in your eyes?
Thank you for your time Chris,
Peter Skelton
Hello Peter,
You ask some very good questions. In regards to your questions;
1) This is very difficult for me to estimate because I have no idea where you are at in trading, how good your discipline or trading psychology is at which will have an impact on your trading. $6-8k USD per month on a $100k account is 6-8% a month and that would be challenging for a high level forex trader to achieve consistently. I tend to tell the developing trader to focus on learning the systems, becoming a good trader and making good trades. When you do, the money will come. But telling someone what they can and cannot do with very little knowledge of how they trade is very difficult for me. But again, 6-8% a month consistently month after month is difficult for even professional traders so hopefully that gives you some idea. Now if you had say 500k, then you are talking only 1.5% per month which is very doable. The challenge is not so much about the systems which have been successful for years, the question remains around you and your ability to be disciplined, to follow proper money management, your trading plan and to have the right trading psychology to make the best trading decisions.
2) The trading platform should be easy and simple to use. Some of them are MT4 or FXCM TS2 (trading station 2) which are very user friendly. In terms of the charts, I use fxtrek intellicharts desktop for all my charting needs which are the ones you see in the videos. They are $100 per month.
3) Yes, the systems function at a very high level, yet are super easy to learn as they are completely rule-based. In terms of which course to take between the two to get the number of trades and trading rhythm, that is tricky because the Ichimoku Course has two systems in there which have that type of rhythm while the price action course has several systems with that type of rhythm. The systems in the Advanced Price Action Course are easier to manage and are more set-it-and-forget-it strategies while the Ichimoku ones require a little more management. But they both perform at a high level
With all that said (which was a lot), what are your thoughts on all this?
If you’d like, I’d be happy to talk on the phone so we can get more information and find a tailored solution for you.
Let me know when you’d like to do a call.
Kind Regards
Chris