I wanted to write a brief article on a simple method I use to analyze price action – that of drawing trend lines to read the forex price action angles, or the speed of the buying/selling in the market.

I’m going to use an example to highlight how they can be useful for understanding trends, transition phases in trends, and when to look for key price action reversals in the market.

Exhibit A:  EUR/USD Daily Chart
price action angles - trading forex price action dev2ndskies.wpengine.com sept 17th

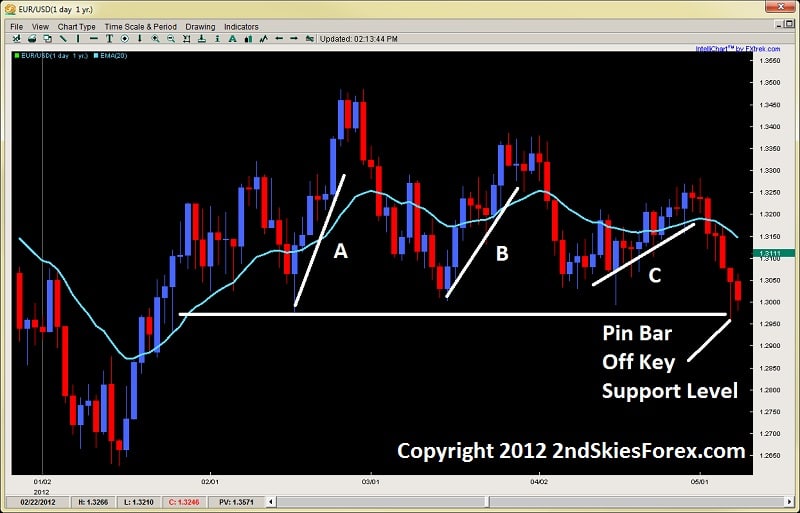
Looking at the forex price action trading trendline chart above, the EURUSD started 2012 dipping to 1.2600 before starting an impulsive bull run which climbed almost 900+ pips in a month and a half.  Now if you look towards the left side of the chart, you’ll see a pullback to the horizontal line.  Price rejected off this line, forming a piercing pattern that climbed 6 out of 7 days and over 500+pips.

This is the move in line A.

After reaching the peak from move A at about 1.3500, price then sold back in 11 days back towards the same support line.  Although the low from this sell-off was a tad higher, take a look at the bounce off the level.

Notice how it had 3 bear days in the 8 day move (2 more than in prior move), but only went about 400pips (20% less)?

To me, when I see two rejections off a key level, I’ll draw trend lines on both of them (underneath if they are bull moves, and above if they are bear moves).  The reason I do this is to measure the strength or speed of the buying/selling.  This is communicated to me by looking at the price action angle of each trend line.

In this case, I have a weakening angle from A-to-B.  This communicates a weakening effort by the bulls and that the bears are trying to take control of the market.  Keep in mind, this is all happening above a support level, so the bulls still have overall structural control.

When you however look at the last bounce off this noted support line, we can see a massive weakening in the angle.  When I see three structural, or price action angles weakening successively, this usually is a sign of an impending breakdown.  What is also interesting is the C leg took 12 candles to gain only 250pips (50% less than A-leg, and 38% less than the B-leg).  Put these two together, and you should be looking for a breakout to the downside.

What is interesting is how price action formed a pin bar strategy off this key level.  If you were just trading pin bars as is, without the ability to read price action in real time, you would have taken the long on this pin bar setup, but then got crushed on the ensuing breakout which is below.

Exhibit B: EUR/USD Price Action Angle Weakening/Trend Change
price action angles - pin bar strategy trend change dev2ndskies.wpengine.com chris capre

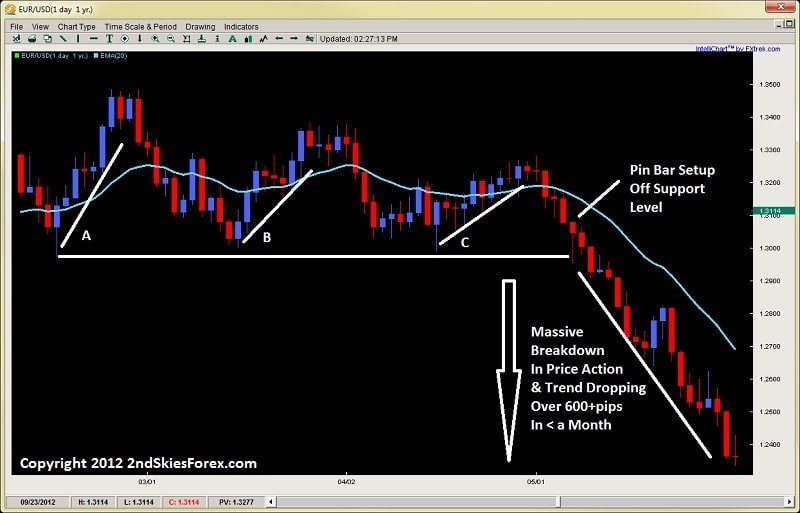
Working with this chart above, we can see how even though there was a pin bar setup at the horizontal support level, price dropped right through that – stopping out traditional pin bar traders who were not reading the price action in real time, or the change in the angles.

In a flash, the trend was reversed and the pair sold off over 600+pips in less than a month.  Had you been reading the price action angles in real time, you would have spotted this potential trend change, and looked to get short instead of longing off the pin bar setup.

This is one way to use forex price action angles to help with your reading and understanding price action.

Another way you can use them is in understanding parabolic or climactic price action moves.  These can also be understood via these trend lines and angles.  But they are a simple tool which is highly useful in forex trend trading, understanding transition phases in trends, and when to look for possible reversals.

I hope you enjoyed this article and found it a useful addition to your price action trading toolbox.

For those wanting to learn to trade price action, get access to the traders forum, a lifetime membership with free updates and more, visit my forex price action course page.

I wanted to write a forex advice article today about what happened to me this weekend, and how it relates to trading.

A Dutch Friend
Last Friday, a very good friend of mine named Mark came into town for a few days.  Mark is Dutch and trades derivatives for a multi-national Oil and Chemical company.  Anytime he comes to see me, two things are certain to happen;
1) we are going to have a glass of good Scotch
and
2) we are going to play poker at the casino and will likely not get home till sunrise

poker and trading dev2ndskies.wpengine.com

For the first two hours, my table play was going a little slow as I just wasn’t getting any hands. Unfortunately this led to me losing many of the blinds and small bets, now down to about$110.

Luckily, some really good hands like a flush, trips and full house came my way where I won some decent sized pots.  I was now just over $1000, so doing well on the day being over 3x my buy-in.

A Two Pair Hand
Then I got an A3 suited sitting in the big blinds.  Everyone folded except for two players who limped in.  Sensing weakness I decided to raise and the other two called.

Flop lands A / 3 / 8.  I’ve got two pair and there is no flush draw on the board.  I probably have the best hand since the limpers unlikely called my raise with 8 /3, and an A 8 would have likely raised with all folds prior.

One folds and the other calls with me being in position.

A Jack comes on the Turn with no flush possibility.  He checks, I raise $50 on a pot of $75 and he calls.  I probably still got the best hand.  Maybe he had J8 pre-flop, but AJ is unlikely to limp pre-flop. J3 is unlikely play to a raise, so I probably have the best hand.

The River card comes a 7 which he checks.  I bet $125 and he goes all in.  To call, I need to put in about $350 more which would leave me with around $500 left.  Now I have to go into a deep think to figure this out.

over thinking in trading dev2ndskies.wpengine.com

Overall, his betting really confused me.  He limped in out of position, called a pre-flop raise out of position, had no flush draw, and called every bet along the way.  It is unlikely he had pocket Aces as he limped pre-flop.  Maybe a KJ, but he would have likely folded the Ace flop.

Because his betting pattern didn’t make sense, usually that means a bluff or a trap.

I decided to call.

Turns out, he had 9 T off suited, and on the river had hit his straight (7-J). He had <16% chance of hitting his straight on 71% pot odds, so way inverted R:R.

Regardless, he won and I went from over $1000 to about $500 in 5mins.

Needless to say, I was a little stunned – not because of the money, but because of how I misread the play.

In The Past
For the next 10 hands, I was mostly stuck thinking about the hand – wondering where I went wrong, what I could have done differently, going over his reactions to see what clues I missed.

And herein lies the problem…I was stuck in the past and completely separated from the present.  All my energy, concentration and focus was in the wrong place.

Next thing you know, I’ve lost a few more hands and am down to $250, and am now negative for the day.  It was now 4.30am so a good chance I was going home a loser which almost never happens for me in poker.

What Would I Do…
Immediately I started to think about trading and what would I do in a similar situation.  I came to one conclusion – that was to let it go and get present with the moment.

making money dev2ndskies.wpengine.com
By 5.30am, I had a stack of over $600 after winning two big hands and got up for the night.

What made me write about this was something I saw in a trade journal today from one of my newer students.  They had lost a big trade and then lost the next few trades shortly after.  They did not follow the system, but had enough awareness to write down they were trading to ‘get back their losses‘.

Perhaps they really couldn’t lose that money and were expecting to win to pay some bills.  Or maybe they made a mistake and are now punishing themselves for such a trading crime.  Whatever the initial ‘reason‘ was, two things are completely evident;
1) they have not accepted the loss
and 
2) they are stuck relating to the past and not the present

The irony of it is, you cannot ‘get back‘ your losses.  Once you’ve lost that money, it is gone.

< Than Your Full Edge
The great thing about this market is you can make money anew at any time.  But you cannot ‘get back your losses‘.

In fact, this is when your account is most vulnerable, because you have psychological justifications for not trading according to plan or system.  You’re trading off emotion, but also fragmented from the moment and separated from your intelligence.

Has this happened to you before?

I’ll confess it has happened to me, many times in my earlier days.  Regardless of what happens, the best thing you can do is let it go so you can be present in the moment.  Maybe you need to take a break to get your head straight which is not a problem.

But remember who is making money in this market and who you are really competing against;
-professionals
-institutions
-seasoned traders
-computer algorithms

Anytime you are trading <than your full edge and intelligence, you are at a severe disadvantage to the above players.

By trying to get back the losses, you are doing one, if not all of the following;
a) stuck in the past (disconnected from the present)
b) not accepting reality as is (never works)
c) likely trading off more emotion than clarity (no bueno)
d) managing your P&L, not trading the market or your system (a big one for newer traders)

psychological compass dev2ndskies.wpengine.com

In Conclusion
Part of developing into a successful trader is becoming more self-aware.  This is especially true when things go really bad as we are faced with a poignant, and often psychologically painful (or uncomfortable) reaction to reality.  But nothing could be more important because when our psychological compass is off, you are at the greatest risk for making further losses.

This was the same for me shortly after I lost my big hand and likely has happened (or will) to you in your trading.  But hopefully you can now realize how critical it is to not try and ‘get back your losses‘ as its a futile effort.

When recovering trading losses it is best to start all over again with the present moment, and make the best trades you can.  If you do, in no time, will you be back to winning again, and likely have a higher balance than before the loss.  Then the loss was more of a learning experience instead of a hurdle to your growth.

I’d like to end with a short story about a Buddhist Lama and their student.

Being really unhappy with how they have led their life, a student who has just started to meditate came to his Lama and shared his disgust with how his life has been going.

He then stated to his Lama:

“I wish I could just start my life all over again”

The Lama, after a very short pause responded:

“Your wish has been granted” 

I hope this helps and that you found this article useful.

Kind Regards,
Chris Capre
Founder
2ndSkiesForex.com

Other Related Articles:
Poker, Concentration and Trading
5 Mantras for The Developing Forex Trader
7 Signs You Know You’re Maturing As A Trader

Breakouts are some of the tougher environments for traders, and understandably so because they represent potential, but often fail.

I’ve already written an article for trading breakouts Post-Breakout, but what about the Pre-Breakout moments where you have to make that key decision to trade it or not?

How do you identify them and what are the key elements that precede strong breakouts?

This is the key point of this article – to give you 3 tips for identifying a soon to be strong breakout so you don’t get trapped in a false breakout.

I will go over the three elements you will want to find before considering a breakout, then briefly highlight what is behind them from an order flow perspective.  By learning to spot these breakout trading clues, you can position yourself to trade higher probability breakouts and capture a larger portion of the upcoming move.

1) Well Defined Support/Resistance Level
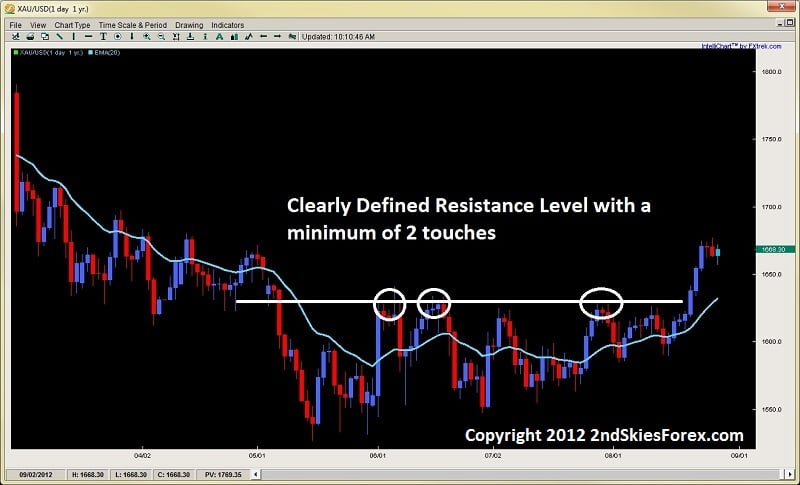
The first pre-requisite to identifying a healthy pre-breakout situation is having a clearly defined barrier in the form of a support  or resistance level. The classic case is when you have a trend in place (lets say uptrend) and then the price action runs into resistance at a key level.

Ideally, you want there to be at least two touches on this level before defining it.  The more horizontal and neater this level is – the better.  But it should be noted, this is just a pre-requisite and generally by itself not enough to identify a healthy breakout setup.  The reason for the two touches is to identify a sticking point where players are parked and what level they are defending that the (bulls in this case) are unable to penetrate.

By finding both parties present, we have the environmental potential from an order flow perspective to create a healthy breakout.   In this example, the sellers are clearly holding a price they want to defend and have stops just above it.  By them staking their defense in a clear location, it communicates where their orders and stops are likely parked.  It is tripping those stops, along with bringing in new buyers that is the goal of the bulls.

Below is an example of a clearly defined resistance level after a downtrend and consolidation period, communicating there are bears clearly defending a level.

Image 1.1
breakout trading clear resistance level dev2ndskies.wpengine.com aug 28th

2) Pre-Breakout Pressure or Tension (Squeeze)
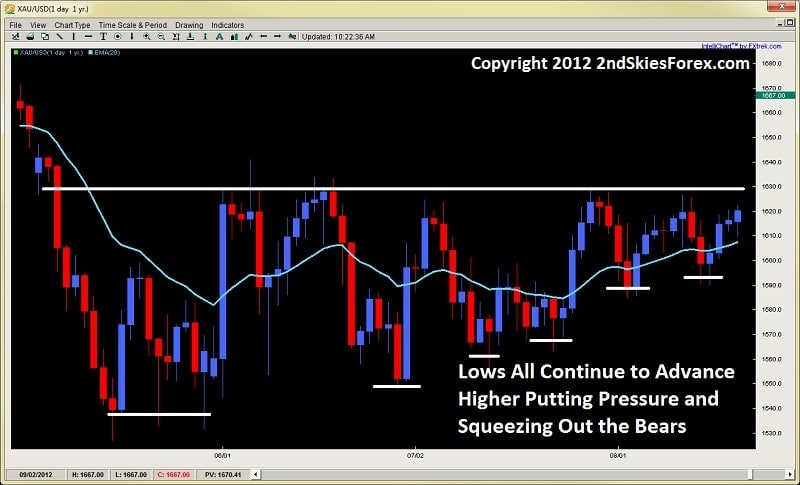
The second element you want present prior to a breakout is a pre-breakout pressure or tension that manifests as a squeeze.  This pre-breakout tension is highly important because it creates a friction and pressure upon the defenders (in this case the bears).  As the bears realize their rejections off a key level are getting smaller, while the bulls continue to gain more upside and territory, it causes a friction in their minds that forces them to make a critical decision (either stay in and defend, or exit the market).

As the room gets smaller and smaller for them to work with as the bulls squeeze the bears out, sellers defending a level will often exit early, leaving the defense to those who are not realizing the game is up. This further weakens the defenses at these levels until very few are left to carry the burden.

You can easily identify a price action squeeze and this pre-breakout pressure, or tension, by the price action forming higher lows in attacking a resistance level, or lower highs when attacking a support level. This is a combination of the current bulls willing to buy up the instrument at a worse price, along with new bulls wanting to get long before the breakout.  A good example is presented in the same chart which I will zoom in on to highlight.

Image 1.2
price action squeeze breakouts chris capre dev2ndskies.wpengine.com aug 28th

3) 20EMA Carry
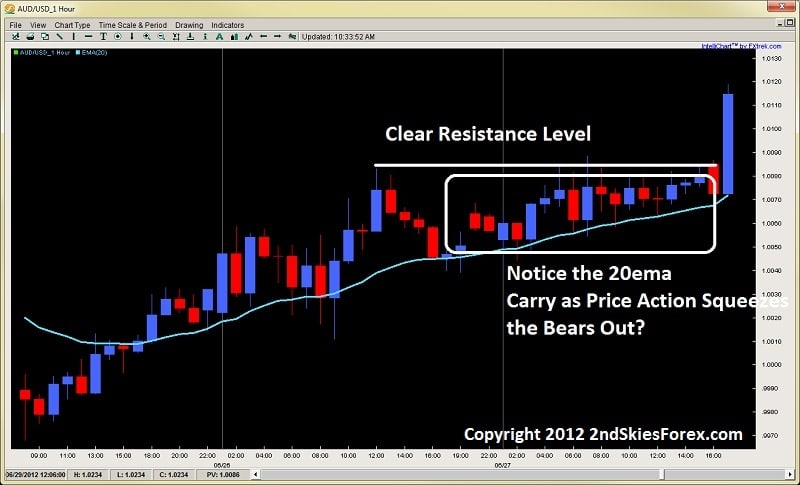
Another key element you will find prior to breakouts is the 20ema begins to carry price leading up to the key resistance or support level that is being defended.  This is not so much that traders are placing orders there prior to the breakout (although many will), but also a visual representation of how the squeeze is taking place.

Just looking at the chart above, we can see in the beginning, after the first rejection off the key resistance level, price penetrated nicely below the 20ema.  But as we get closer and closer towards the right where the squeeze is taking place, you see the market barely go below it for more than a single candle before resurfacing.

Also, you will notice how the first few times the rejection approaches the 20ema, it breaks through after one candle.  But towards the end many candles start to float above it where some traders are entering in anticipation of the breakout.

Another really good example was one I traded and blogged about ahead of time with the AUD/USD on the 1hr time frame.  The pair had been trending up for 110 pips over two days, but ran into a key resistance level that it got stuck on at 1.0081 (image below).

Image 1.3
20ema carry price action squeeze breakout dev2ndskies.wpengine.com aug 28th

Using the example above, notice how the 20ema in the middle of the chart is penetrated about 20pips, but then as we get closer and closer to the resistance level and the squeeze begins to happen, notice how the 20ema begins to carry the price action, and the penetrations get smaller and smaller?

This is a combination of very few sellers defending the level, while the bulls in anticipation of a breakout (realizing they have control) are likely entering new positions to get in ahead of the upcoming breakout (I was one such trader).  Eventually the pre-breakout pressure and tension became too intense and the bears gave up when the bulls made their push, tripping stops and creating a large breakout bar with a strong close.

In Conclusion
Identifying breakouts can offer highly profitable opportunities when you can position yourself well.  But to do this, you must be able to identify highly probable breakouts with these 3 key elements which are;
1) Well Defined Support/Resistance Level
2) Pre-Breakout Pressure/Tension (Squeeze)
3) 20EMA Carry

If you can learn to spot these key elements prior to a breakout, along with reading various other price action clues, you will find yourself entering in higher probability breakouts, increasing your success and profitability.  You will also find yourself not getting trapped by false breakouts which can wreak havoc on your account and confidence in trading them.  Thus it is critical to read and identify the key elements prior to a breakout.

For more info on how to trade price action, along with lifetime membership, getting access to the traders forum & more, make sure to visit my price action course page.

Other Related Articles:
Trading Breakouts
Key Price Action Elements to Breakouts
Breakout Role Reversal Setups

Now that I have outlined the major components to Ichimoku Time Theory (ichimoku numbers), I want to talk about the 2nd pillar of Ichimok which is the Wave Theory.
Remember, the main pillars of Ichimoku are not the Tenkan, Kijun, Chikou and Kumo.  These are components of Ichimoku to help you read the main aspects of what is going on with the trend, support and resistance, and price action – all within a glance.
But…..these are NOT the pillars of Ichimoku.  This led Hosada to state the following when he realized everyone was getting stuck believing the Tenkan, Kijun, Chikou and Kumo were all Ichimoku was about;
“Of the 10,000 or so people who are practicing and trading ichimoku, only about 10 really understand it.”
The 3 main pillars of Ichimoku are;
1) Ichimoku Time Theory
2) Ichimoku Wave Theory
3) Ichimoku Price Theory
I have discussed Ichimoku time theory which is the basis for all the other pillars and all of the ichimoku components you use when you look at any ichimoku chart.  Now I would like to get into the 2nd pillar which is Ichimoku Wave Theory.  I will get into the basic components or waves only as there are several types of waves (basic, mid-term, etc.) so to give an introduction without confusing anyone, I will write about the basic waves in today’s article.
3 Basic Waves
There are 3 basic waves which are the most important ones to learn because they are the basis of the ichimoku wave theory and will always be a part of your wave counts.  They are;
1)  I Wave
2) V Wave
3) N Wave
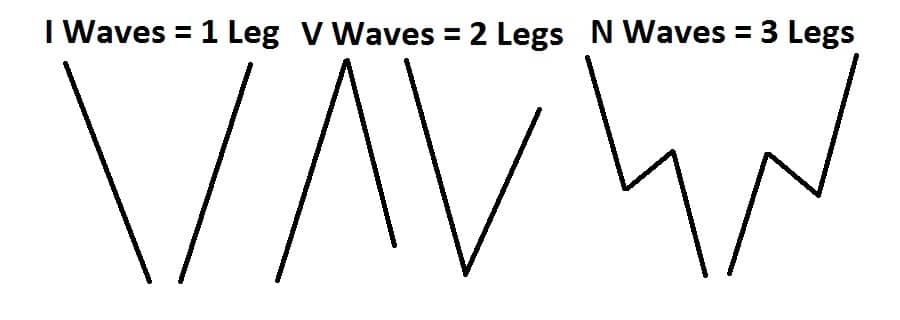
Ironically, an I Wave is 1 leg, a V Wave is 2 legs and a N Wave is 3 legs.  Just like all the basic ichimoku numbers are building blocks for all the other numbers, it is the same with the waves.  But let me show you a picture below to help give you a needed visual.
basic ichimoku waves ichimoku cloud chris capre dev2ndskies.wpengine.com
Looking at the image above, you can see how the one, two and three legs form the individual waves.  I, V and N waves can all be up or down so that does not matter.  Generally, I waves are impulsive price action moves, but they can be corrective.  V waves are usually one impulsive and one corrective move, but can be two impulsive moves back to back.  Whereas an N wave is usually an impulsive leg, followed by a corrective leg, and then another impulsive leg in the same direction as the original leg.
Being the most complex of the three, the N wave can have variations of this, but the first leg of the N wave should be impulsive with the other two having variations between them.  Generally, most N waves will end with a higher high for an up wave, and a lower low on a down wave.
So the wave should end up lower or higher than where it started.  If this is not the case, then it usually means a breakdown of the wave structure, but lets look at a few examples.
basic ichimoku wave examples chris capre ichimoku cloud dev2ndskies.wpengine.com
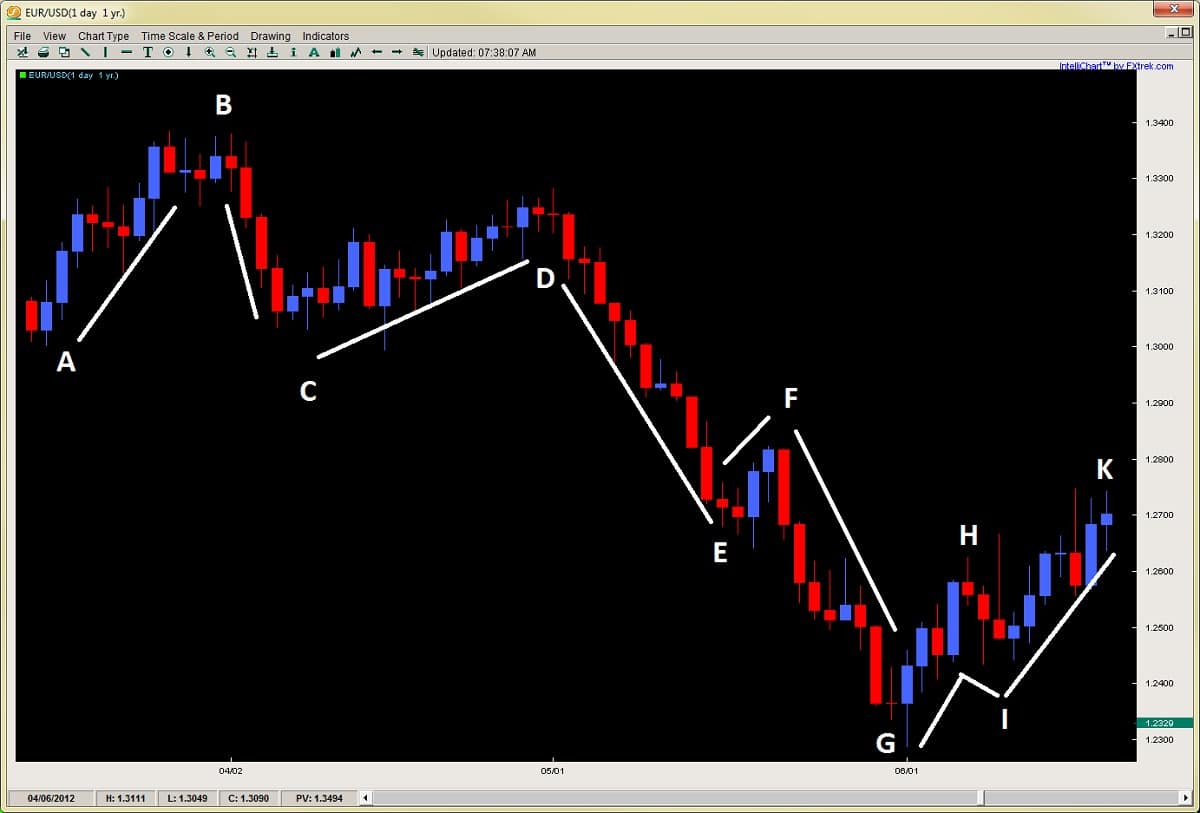
Using the chart above, I have labeled several lines, all of which individually are I Waves.  As I said before, they all are components of each other, so a V Wave is really two I Waves put together, while an N Wave is either three I Waves, or one V Wave and one I Wave.  But lets break this down in the chart above.
Starting at the top left of the chart, the first movement from A-B is an I Wave.  Now by that token, the move from A-B-C is a downward V Wave.  A-B-C-D would be therefore an N Wave, but also composed of two V waves (one up and one down).  As a general rule, it’s better to look at the wave structure from a macro perspective then a micro one, so breaking say four N Waves up into 16 I waves is unnecessary.  Look for the larger macro structure (gestalt) of the wave structure and you got the trick.
Now, as I stated, even though A-B-C-D is an N Wave, it doesn’t end with D being higher than B.  When this happens, it generally means a range bound market at a minimum or a breakdown into a downward N wave, but rarely ever do these end up with higher prices above B, especially if C is breached.
Since this did happen, we actually have an downward N Wave starting at B-C-D-E.  We can also count a downward N Wave from D-E-F-G.  This brings me to the point that N Waves generally continue in their original direction until the ideal structure of the waves gets broken or disrupted.  It also means N Waves can continue and parts or legs (ends) of them can start new N Waves in the same direction.
So if we were counting a new N Wave from F-G-H-I, since the wave structure is being disrupted, we would expect a likely reversal, and this is supported by the upward N Wave starting at G-H-I-K.  This may seem like a lot, but this should give you some starting ideas of how to use these basic waves when reading an ichimoku cloud chart and will get easier with practice.
Usage in Trading
There are many ichimoku trading strategies we can use with these basic waves in trading, and if you were paying attention, I already gave away one idea.  One example is how the wave structure generally performs (particularly N Waves).  If the structure breaks down from its ideal formation, then watch for trend change – minimally a consolidation, but definitely not a trend continuation.
Another way this can be useful is if the number count (using ichimoku numbers) in a particular move is getting long, such as a two section, one period or a combined-6 move.  These common turning points, combined with wave structure changes often bring a confluence of signals together which can mark major turning points in a move.
For example, in the chart above, the move from D-G is actually 1 day short of a one period move (a common turning point).
Additionally, you can combine forex price action strategies with these moves, especially reversal setups, so when you see (for example) pin bar setup happening at a major resistance, along with an N Wave structural change, this can increase the probability of a reversal.
Other ways to do this is if the V Wave is not a traditional impulsive move followed by a corrective move.  For example, if it is an impulsive move followed by another one counter-direction, this could also be suggesting trend change or a range bound market, depending upon how it started the V Wave.
As you can see, there are many ways, too many to discuss here, but hopefully this gives you something to work with.
In Summary
Although there are other waves that we have not discussed, this is a good introduction and start to understanding Ichimoku Wave Theory and gives you the foundational theory to start practicing with the basic waves.  But it is important to understand this is one of the key pillars underlying all of Ichimoku Kinko Hyo theory, so understanding the basic waves is a gate towards understanding ichimoku trading strategy as a whole.
Best is to practice forex wave theory by itself so you learn it as an individual component.  Then after building some experience, combining it with ichimoku time theory.  But hopefully for now, this gives you a nice introduction to Ichimoku Wave Theory as there is very little information about it available, nor discussed openly.
For those wanting to learn how to trade the Ichimoku Cloud, time, wave and price theory, along with lifetime access to the Ichimoku traders forum, discussing ichimoku setups using rule-based systems, make sure to visit my Advanced Ichimoku Course.

Over the last few years, I’ve gotten this question soooooooooo many times, I thought it would be best to write an article about it so people can understand and make their own conclusions about such a poignant topic.
The general question is one below someone recently emailed me;

If you can make money from your systems, why would you take the trouble to teach it, or teach at all when you can just make money trading?
I’m sure you as someone in the trading and learning process at one point thought of this question, or wondered about it yourself.
For the record, it’s a legitimate question as a whole, depending upon how it’s being asked which I will explain shortly, but here is my answer below;
About 12+ years ago, I decided I would only do that (for work) which I was passionate about.  If I am going to spend 1/3 or 1/2 of my life working, then it better be something I am seriously passionate about. Although I have a lot of little passions, there are only a few I feel intensely passionate and think about daily. They are listed below;
-Trading
-Teaching/Training Traders
-Yoga/Meditation
-Philanthropy
-Zen Archery/Iaido
Beyond this, I cannot imagine doing anything else in my life as my daily work.  Does that mean something new couldn’t come down the line which I would not do?  Of course not as I’m always open to what life presents.
But, if I was stuck on a deserted island, with food, shelter, a laptop and internet connection, I would still be trading, and still training traders.
Why?
Because I am that passionate about it and love it to death. Passion is a fire that ignites something inside others.
passionate about trading chris capre dev2ndskies.wpengine.com
It is the same thing John Coltrane had when he played till 4am (after doing a 3hr set earlier).
It is the same thing Michael Jordan had when he went back to the gym just 2 days after winning the NCAA championship (as a freshman).
If you have this, it will be what helps you overcome some of the greatest obstacles for your success – and trust me, you will face them in trading.
Retirement and Passion
I was once asked by a deca-millionare businessman who still worked 45+hrs a week at 50yrs of age – what is retirement?
Doing what you want everyday when you want?  If so, then I am retired because I love what I do.  
This is what he told me a long time ago and it stuck with me ever since.  Today, I feel the same and understand what he meant.
I realized a long time ago, when I’m doing something I am passionate about, I put my whole being and 110% into it.  When things get tough, I see the big picture.  When things are going well, I remain focused and keep my head down.  When things are boring and sometimes rote, I find enjoyment in doing it and perfecting my skills.
Simply put – when I do things I am highly passionate about – I am more apt to put my entire being into it then something which I have no real interest in – regardless of the money.
Life is short.  I have no idea how long I’ll be here on this planet, so I only want to be doing the things I am totally passionate about.  It would be torture for me to do some office job where I hate my boss and my work, just for the money, even if it was 10x more than what I make now.  I cannot tell you how many business opportunities I have passed up which had the potential for a lot of money.  But they didn’t excite me at all.
I feel very connected and in touch with who I am, and to do something just for the money (even though I hated it) would be torture for me.  It would be disrespecting my being and who I am.  I learned a long time ago not to care about the money, and just do what I love 110%.  When I do that, the results will come, and even if the money didn’t come, I’d still be happy doing what I love everyday.
do what you love chris capre dev2ndskies.wpengine.com
Money
It is always really sad to me people seem to think the sole motivation for doing something/anything should be money.  More than likely, the person asking this question is NOT doing what they love right now – and likely doing something just for money.  Most people ask and think, ‘if you can make more money trading than teaching (which is true – my comment), then why teach?
If money was the SOLE or TOP motivation in my life for doing something, then I would just trade.  But its not.
So why do you teach/train traders?
Three simple reasons;
1) I do not want to spend 8hrs a day just pushing buttons to make money – that is the equivalent of being a human ATM machine
2) My energy is most creative / involved / expressed when I have a very dynamic day in terms of activities.  Just doing one thing doesn’t help me to activate all my creative ideas
3) I have a vision of training 10,000 traders to become profitable.  If the success rates are as stated (about 25%), I want to break them all.  I want to help others find a method to become abundant so they can do what they want in life, and have the time they want to spend it with whom they can.  I treasure the lifestyle and choices I have.  If I can give a tool which can help others have this – then I’ve done some good work

It’s as simple as that.  This is why I teach and I am passionate about it.  When I’m doing something I’m passionate about, it helps to activate my entire being along with all my creative energies and natural intelligence.  Not activating these day in day out is torture to me or falling backward.  I feel like I am cheating myself (and others).
Trading, archery, yoga, meditation, philanthropy and training traders helps me to bring these things forward.  Trading is one of the top things on my list, but it just so happens teaching others to trade successfully is also on that list.
Now just because someone wants to push buttons all day for 8+hrs a day trading, doesn’t mean its a bad thing.  If that is what they are passionate about, then fire away.
But for me, I have a different vision of my lifestyle and my time.  Time to me is more precious than money, and you will find that with most wealthy/abundant people.  So if I can make a lot of money trading with less time, while getting to do a bunch of other creative activities, then why not?
It’s sad people think if you can trade, then you would not teach.  They use this old saying;
Those who teach don’t know, and those who know, don’t teach.
Most don’t even understand where that came from or what it means.  It came from the Tao Te Ching and was based on their philosophy of teaching through your natural being and actions, part of their wu-wei principle.  Then it got applied to martial arts as many taoist things did, but was misrepresented.  If there were no teachers in martial arts, how would we ever learn martial arts?  Channeling?  Good luck with that!
Eventually, it got applied to trading, likely through some distrust of people who teach but with no real understanding of the actual saying.
Michael Jordan, LeBron James, and many other athletes (from other sports) who make millions from playing basketball, teach training camps (and get paid for it).  Does their pay from these camps = what they make playing their sport?  No.  So why do they do it?
Because they want to help others learn their craft, share their joy and what they know.  Would you ever tell them they are a fake because they teach kids how to play basketball?  No.  Do you think they are only teaching little kids to play because they are only motivated by money or cannot play?  No, so why is this the same with trading?
Sure, there are some suspect people out there who likely cannot trade, who are more marketers than traders, are scammers, or can only trade marginally.  But some can and still like to help others for their own reasons.
Eventually, you get to a point in your life where the money comes in more than you expected, and then you face a fork in the road;
-You either keep working just to make more and more money (path of the ego)
-Or you try to figure out what good you want to do with your life and skills
I chose the latter, although less to do with the money, and moreso because I have no choice at this point – I have to do what i’m passionate about.  Anything less would be disrespecting my being, my skills, my natural intelligence and would not help me manifest these latent energies I feel inside.
chris capre teaching at fxstreet dev2ndskies.wpengine.com
So hopefully this answers the questions once and for all, but even moreso, gives you an understanding of who I am, why I do this and an inside to what makes me tick.
All the best.
Chris Capre
2ndSkiesForex.com
Other Related Articles:
Trading Rule #1 – Know Thyself
Mindset of A Successful Forex Trader
7 Signs You Know You’re Maturing As A Trader

For all those traders interested or currently trading Ichimoku, you will not want to miss this article.

Although I am heading out in a few hours with my girlfriend to Harbin Hot Springs, I wanted to write a brief introduction to Ichimoku Number Theory as there has been a lot of questions (and confusion) about Ichimoku settings, time frames, etc.

The basis of Ichimoku as known to most is the 5 lines;

  1. Tenkan Line
  2. Kijun Line
  3. Senkou Span A (part of the Kumo)
  4. Senkou Span B (other part of the Kumo)
  5. Chikou Line

Almost 95% of the commentary, traders, educators and understanding of the ichimoku kinko hyo view this as the basis of Ichimoku.

This is actually incorrect.

The basis of Ichimoku are the three pillars which are listed below;

  1. Ichimoku Number Theory (also has to do with time)
  2. Ichimoku Wave Theory
  3. Ichimoku Price Theory

These are the three pillars of Ichimoku, but the root of all them is based on the Ichimokunumber theory.

4.5yrs

Goichi Hosada (founder of Ichimoku)  in his development of Ichimoku, spent 4.5yrs of his study just on number theory.  He studied pretty much every Eastern and Western theory under the sun, and eventually settled upon 3 basis numbers that he not only made the basis of Ichimoku theory, but underlined all of reality.

NOTE: I have an interesting follow up story to tell about this so remind me to discuss it later.

The three numbers he made as the basis for Ichimoku were 9, 17 and 26.

So the idea that the reason why the Kijun was set to 26 periods had to do with the former 6 day Japanese trading week is false.
The kijun was set to this measurement, along with the tenkan – based on his findings.

What this means is, for those who are asking the question about should we adjust the settings since we are not working with a full trading week, or are trading an intraday time frame, is in effect answered. Regardless of the trading week or time frame, we are best served from an Ichimoku perspective keeping the original settings.  So hopefully this puts that one to rest and the kabbash on all the alternative theories.

The 10 Numbers
Although there were 3 basic numbers which underlie the entire set of Ichimoku numbers, there were 10 in all.  They are listed below;
9
17
26
*These three represent the basic or simple numbers
33
42
65
76
129
172
200-257 
Now if you do a quick calculation, 9+17 = 26.  26+17 = 42+1.  33+9 = 42.  33×2 = 65+1. 42+33 = 76-1. 65×2 = 129+1. 129+42 = 172-1.  So all these numbers are interrelated and all comprised of the basic numbers in some way.

There are names for these numbers like one section, two sections, one period, etc. which I will get into a later date, but the basic three names are;
one section (9)
two sections (17)
1 period (26)
So if you see me using this terminology in my future Ichimoku posts, you will know what I am talking about.

Use in Practice

Ideally, Ichimoku number/time theory should be used in combination with the price and wave theories.  So by itself, it is limited.  But we can start the introduction with the basic concept.  This is, the market is more likely to have a turning point or strong price action reaction around these numbers.  They are not meant to be treated as fixed in stone numbers, but moreso higher probability turning or reaction points.  An example of this is below;

AUDUSD Daily Chart
ichimoku number theory ichimoku trading dev2ndskies.wpengine.com july 26th
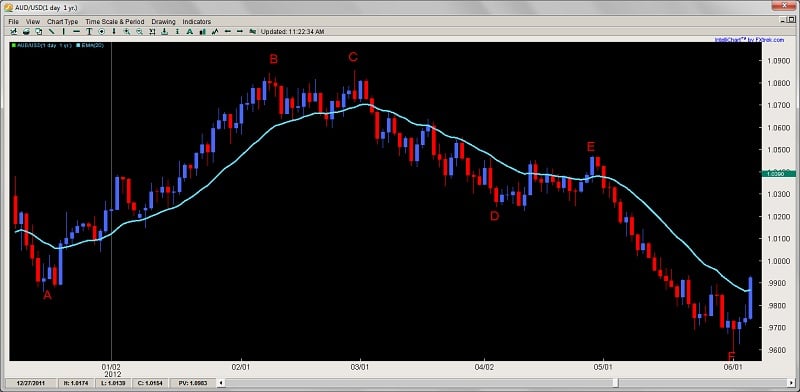
Now using the chart above, lets make some observations:
A-B = 41 (1 short of 42 bar move)
B-C = 16 (1 short of two section move/17)
C-D = 26 bars exactly or one period
D-E = 18 bars (1 short of two sections move)
E-F = 26 bars exactly or one period

Now this is just one chart and there will be many that are not so accurate upon first glance, and others that are.  JPY pairs tend to move and respond more to the Ichimoku paramters and numbers since a great amount of Japanese traders are primarily trading Ichimoku strategies, and therefore are making trades based on it.

However, from my experience, this works on most pairs, commodities, and indices across the board, so quite potent and relevant.  Keep in mind, it is important to understand we do not just apply the Ichimoku number/time theory in isolation, but mate it with Ichimoku price and wave theory.  When combined, they become very highly predictive tools for catching major turning points, finding precise targets and determining future support and resistance levels, so powerful tools when yielded properly.

In Summary

Although this is just an introduction, I hope this gives you a better understanding of Ichimoku and how not to relate to it in just its basic form, but understand there is more going on than just the 5 lines.  Anyone just teaching and professing the 5 lines as the be all end all of Ichimoku have very little understanding of it.

Goichi Hosada once said about this in the mid 80’s;

“Of the 10,000 or so people who are practicing and trading Ichimoku, only about 10 really understand it.”

Keep in mind, when he was saying it, he was including himself and his grandson, so not many.  This is because people get too fascinated with the 5 lines and relate to that only without ever taking the time to understand what it is all about.  Although the 5 lines are potent and informative by themselves, they are a small fraction of the Ichimoku picture and information contained in the Ichimokukinko hyo chart, so keep this in perspective.

I’ll be doing further introductory articles about these additional elements in the future over the next several months, but hopefully this sparks your curiosity and imagination for now.

For those wanting to learn how to trade the Ichimoku Cloud, Ichimoku time, Ichimoku price and Ichimoku wave theory, along with lifetime access to the Ichimoku traders forum, using rule-based systems, make sure to check out my Advanced Ichimoku Course.

While my trading team and I are mostly on vacation for the month of July, I wanted to write a brief article giving 2 key clues to understanding forex support and resistance levels, which is also a follow up to my prior article the best support and resistance levels part 1.  If you can learn to understand these two key points, you will be able to detect key levels, when they are more likely to hold, and when they are more likely to be broken.


1) Prior History, Time Degradation, & Reactions to Key Levels in the Past
When analyzing to see if a level is one where traders are more likely to place trades around, we have to see how price reacted to those levels in the past.

Did price react very strongly to it in the past, say approach it one time, then reverse sharply off of it?  If so, then its very likely the next time it approaches that level, traders will place orders around there expecting a similar reaction.


Why?

If price produced a very violent or strong reaction to it in the past, this was because a large amount of money was put on the line stating ‘this is the line in the sand, this is highly over-valued or under-valued and we are placing a large bet here’.  When this happens, its the first institution to get in that has the highest chance for profit, because they are the first to try and reverse the pair, thus getting the best price. But they also carry the most risk.

Regardless, if their reversal attempt works, other institutions will catch wind of this, and attempt to get in as close to the rejection level as possible.  It really becomes a race between the institutions who can get the best price so many vie for it.  This helps to further fuel the rejection and create a stronger reaction.

Smart traders take note of this level producing such a strong rejection and will more than likely take a play off of it a second time expecting it to hold.  If an institution placed a large amount of money at a key level, they will likely defend it a second time (along with others as well).  So expect this level to hold.

But…the reaction the second time around is usually not as strong.


Why?

Because more people are aware of it the second time.  If it was a support level that produced a violent bounce, the second time around the sellers heading into that level will take profit.  This means there is less of an opposing force on the sell side, so when the market bounces, there are less sellers who have to exit and thus fuel the counter trend play.

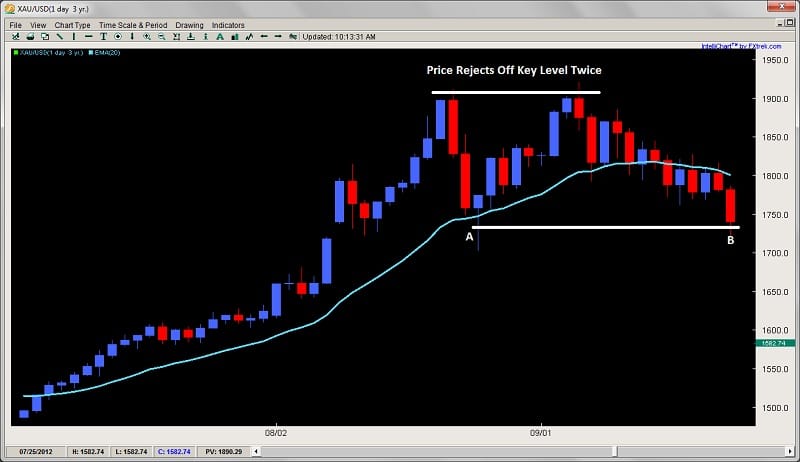
A good example of this is below in the daily Gold chart


Chart 1.1 Gold Daily
2 key clues to understanding support and resistance levels dev2ndskies.wpengine.com july 20th

Gold was in a strong uptrend for all of 2011, eventually reaching $1900 an oz after climbing 3 out of every 4 days from July into mid August.  Looking at the chart above, gold sold off quite heavily after reaching the $1900 level, selling off almost $200+ in 3 days.

Notice how the second time it approached this level, it held, but took over 13 days to sell off the same $200 amount.  The first reaction was far more violent, while the second more tempered.  The level held just fine, but when you see these situations, expect the response to be not as violent but still providing a great trade opportunity.

So anytime you see violent reactions to a level, look to place a trade at that level, expecting it to hold and produce a similar measured move.  Obviously, if the reaction happens on a higher time frame, there is a greater chance it will produce a similar reaction.  Whereas on a lower time frame, this will probably be less likely so be a little more choosy when looking to make a play like this.

Other factors to consider besides the strength of the reaction when understanding support and resistance levels is if the level produced a breakout pullback setup, has held several times in the past, and how much time the market spent at those levels.  All of these factors will determine if there is a good setup there at that level.


2) Current Price Action
So often when people talk about levels, they only focus on the past and seem to forget to look at how the price action is behaving in the present.  Just because a level held nicely in the past doesn’t mean it will this time and you’ve probably experienced this, expecting a level to hold only to watch it get broken.

By learning to read the price action in real time, you can see if the market is approaching it with strength or weakness, impulsive-ness or corrective-ness, and then use this information to determine if a level will hold the oncoming assault or buckle forming a breakout or trend continuation.

Levels are just areas where traders place orders, but if the defenses of those levels are weak, they will not withstand the attack, so it is crucial you are always watching price action in real time to determine if this will hold.

Although I place my orders at key levels I think will hold, if the market is approaching it with several signs of strength, then I will consider waiting for a price action trigger at this level, or for it to hold before placing my order.

Below is an example of a key level that held in the past, but completely failed the second time with the market showing strength and signs it was going to fail.


Chart 1.2 EURUSD Daily
key clues to understanding support and resistance levels dev2ndskies.wpengine.com july 20th chart 2

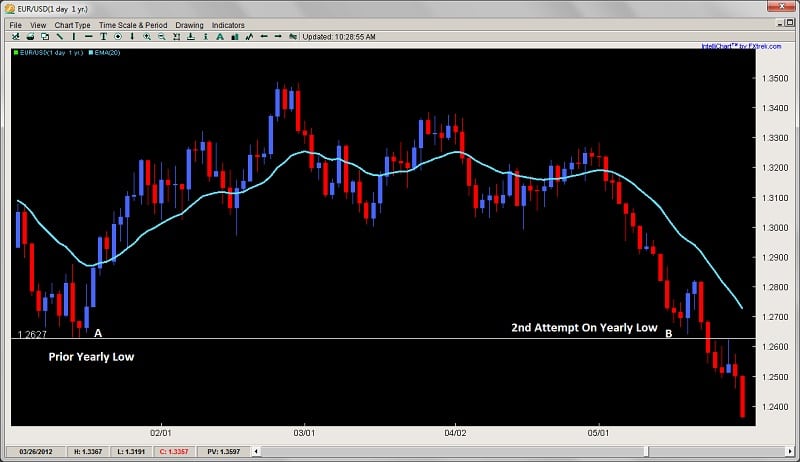
When the EURUSD started its massive sell off in late April, it did so in impressive fashion shedding over 600pips in 13 days with only one bull candle in the entire selloff.  When it was approaching the yearly low (at B on the chart) around 1.2627 in 2012, notice how the selling started to pause going from really large impulsive candles to two small doji-like candles.  The transition or change from large candles to small suggested hesitation on the sellers part heading into a key level they suspected might hold.

This weakness and hesitation was a good real time price action clue the market was likely to produce a bounce from the yearly low, and bounce it did, forming an engulfing bar which bounced about 150pips in two days.  Many of our price action traders got in on this one, not only reading the weakness, but also using quantitative data on price action specifically for the EURUSD which communicated a likely reversal.

But notice what happens after a two day bounce – price then sells off aggressively again taking out the prior days lows and eating into over 75% of the two days’ gains.  This communicated to us in real time the sellers came back in force and were making an aggressive attempt to take out the level.  So this was a good price action clue not to place another buy order at this level.

Notice how after it broke, the level served as a key role reversal level which gives us an opportunity to get short and join the trend.

There are many other clues one can use to read the price action in real time to determine if the level will hold or break, but these are just a few hints you can look for, along with looking for price action triggers off these key levels and quantitative data to support your level as well.


In Summary
So these are just 2 key clues you can use to understand forex support and resistance levels.  It is critical to understand specifically how the market responded to a level in a past to determine first if it is a good level to make a play on.

But, so many times I hear traders talking only about how the market reacted in the past, and not paying attention to how the price action is developing in the present – which is a real time communication to the underlying order flow behind the attack on the support or resistance level.  By learning to read this, along with level 2 quotes, you can greatly increase your ability to understand and place trades around key levels, either using them for reversal plays, breakout pullback setups, or looking for potential breakouts around these key levels.

For those wanting to learn to trade price action and understand resistance and support levels, get access to the traders forum, quantitative data on price action, lifetime membership & more, visit my forex price action course page.


With the holiday coming tomorrow, I wanted to write a short price action article with 3 quick, but highly useful tips for using a breakout trading strategy.  If you can add these forex breakout strategy tips to your price action toolbox, you can significantly increase your success rate when trading.
 
1) Time of the Day
One of the key components to a successful breakout is volatility.  When you have greater volatility, you have more orders/players behind the market and therefore increase the probability the breakout bar will have more force behind it. This helps the breakout bar to take out more stops and push the market further in the breakout direction.
But, volatility fluctuates tremendously throughout the day.  Statistical analysis has pointed out to how breakout strategies actually function far better during the London and NY session while tend to fail during Asian market hours.  This is simply to do with volatility, so the time of the day you take the breakout trade will have an impact on the success of your trade.
Ideally, breakout trades are taken during the following times;
-1st three hours of London session
-30mins before NY open up to 30mins before London close
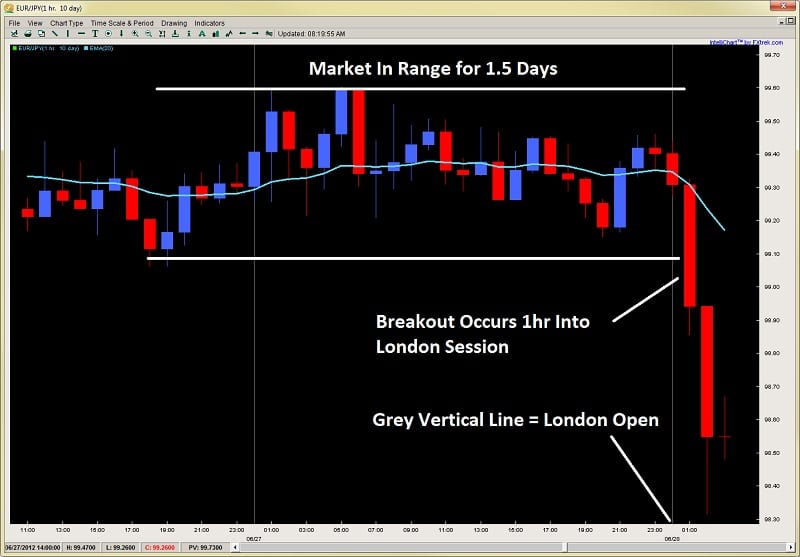
A great example of this is in the chart below how price consolidated for a day and a half, then broke out massively during the 2nd hour of the London session.
Image 1.1 EURJPY 1hr Chart
breakout trading price action dev2ndskies.wpengine.com image 1.1
Outside of these times, the probabilities decrease for your breakout trade (variably depending upon hour) as volatility is either low or in a declining phase and may not have the order flow behind it to break through the key levels.  Also avoid taking breakout trades several hours prior to major economic announcements, or going into major holidays where trading and liquidity will be subdued.
 
2) Use Options Data to Aid Your Timing
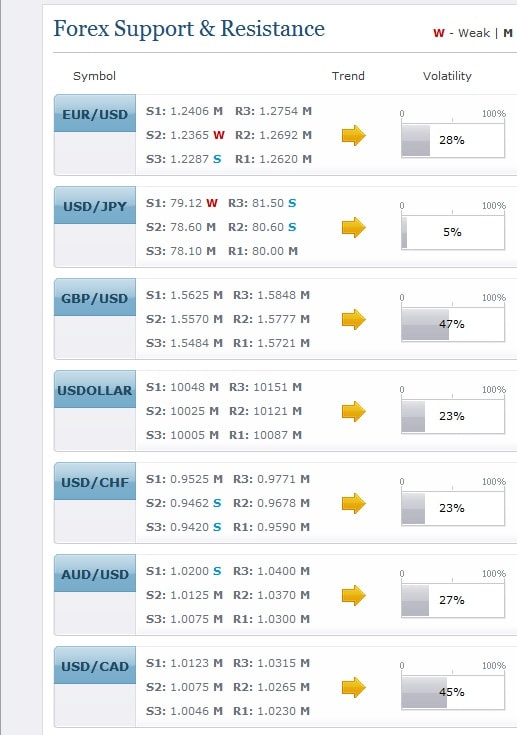
Daily FX has a useful piece of data in their technical analysis page whereby they publish a Volatility Percentile feature.  This is derived from options prices with a higher number communicating options traders are expecting greater volatility, while a lower figure suggests more range bound/reversion to the mean type play.
Image 1.2 Volatility Percentile Data
volatility percentile breakouts dev2ndskies.wpengine.com image 1.2
You can simply check the data at any time (per pair) to see where the volatility percentile figure is at.  When you are thinking of taking a breakout trade, ideal is to have the Volatility Percentile figure above 70% or greater, suggesting options traders are expecting a greater amount of volatility in the market and thus increasing the probability of your breakout trade working out.  If several of the pairs are above these percentages, then there is broad market participation which will likely create strong impulsive moves in the market which are ideal for breakout trading.
 
3) The Longer the Compression, the Better
Usually breakouts give you several warning signals ahead of time a breakout is happening, either via a squeeze in the price action to one side of the market, a tightly coiled range or higher low/lower high forming inside the range.  Regardless of what the clues are, the longer the compression in the price action, the better.
Why?
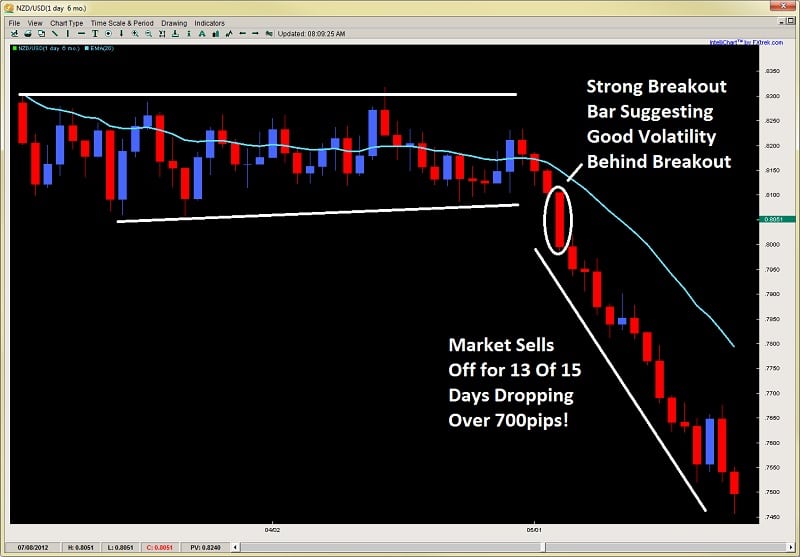
Markets, traders (and brokers) do not like tightly bound up price action.  Smaller ranges and markets mean less continuation and directional follow through.  If markets turn around quickly, they offer us less profit in the direction we have chose.  But a long compression in the price action will build up a pressure and friction which eventually needs to be released.  The longer this builds, the better, for when it breaks out, the market can often go for a large move in the breakout direction as seen in the chart below.
Image 1.3 NZDUSD Daily Chart
breakout bar nzdusd price action trading dev2ndskies.wpengine.com image 1.3
You will notice in the chart above how the price action was consolidated in a tight 200pip range for almost two months.  But when it broke out, forming the breakout bar, it sold off for the next 5 days in a row, 11 out of 12 days and 13 of 15 days, selling off for over 700pips.
 
In Conclusion
Breakout trades can offer some really profitable opportunities, but can be maximized by adding these three forex breakout strategy tips above which are;
1) Time of the Day
2) Using Options Volatility Data
3) Looking for long compression periods prior to the breakout
If you can learn how to spot these, along with other various price action clues, you can increase the profitability and success rate to your breakout trading.
For more info on how to trade price action and breakouts, along with lifetime membership, getting access to the traders forum & a lot more, make sure to visit my price action course page here.
Other Related Articles:
Key Price Action Elements to Breakouts
The Best Support & Resistance Levels
Breakout Role Reversal Setups

If I had to follow only one simple rule of price action, it would be to understand impulsive and corrective price action, and if I could only trade one type of move, it would be impulsive moves hands down. They offer the most profit potential, communicate where the institutional players are buying and selling, whether they are buying or selling, and what the dominant trend is.

This is not to say one cannot make money trading counter-trend, but that far more money and profit will be had trading with the trend, but to be more specific – trading impulsive moves.

The Base of the Pyramid

If I had to look at price action as a structure, it would be a pyramid, with the base being how price action is a reflection of order flow (particularly executed transactions). The next part (or level above) from that base would be understanding price action through the lens of impulsive vs. corrective moves.

I will briefly describe what impulsive and corrective moves are, giving the key characteristics of each type of move. Then I will discuss what they generally communicate from an order flow perspective. After this I will talk about what is the general pattern they will form, and how you can use this for trading impulsive moves.

What Is An Impulsive Move?

An impulsive move is one whereby the market moves quite strongly or heavily in on direction, covering a great distance in a short period of time. These moves tell you when the imbalance between the buyers and sellers is really strong and there is heavy participation from the institutional side.

Logically, more money can be made during these impulsive moves, as they cover more points or pips in less time. They are generally more volatile, and thus provide us with great opportunities to get more R (reward) with less risk since the market will stretch more easily in one direction. But no matter what, we want to be trading with these moves as much as possible, not against them.

Three Characteristics

Impulsive moves tend to have three characteristics common among all of them. These three can help clue you in to when an impulsive move is starting, or in play. They are;

  1. Large Candles (bodies)
  2. Mostly of one color (blue/bullish, or red/bearish)
  3. Closes towards highs/lows of the move

Let’s examine all three points.

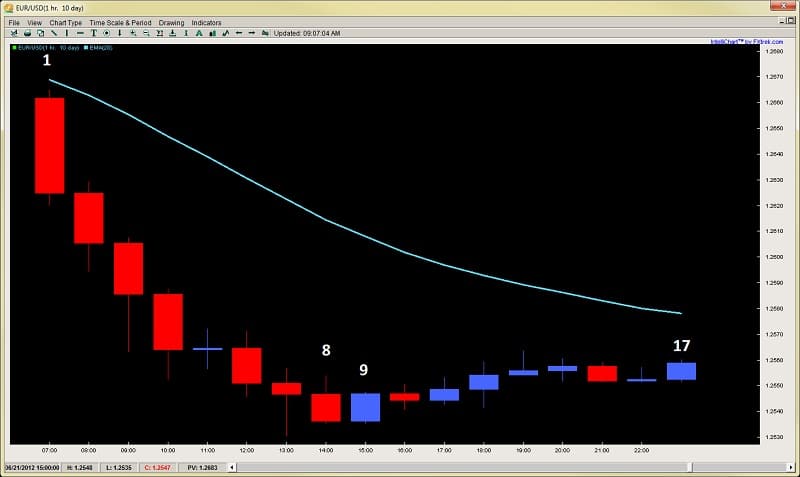
1) Large Candles communicate to us there is strong participation and order flow behind this particular candle. Strong imbalances during a candle will translate into larger candles than the norm. When you see large candles forming consistently in one direction, they indicate strong order flow behind them from the institutional side. Since the larger players are behind them, they give us a clue of the direction we want to take, essentially surfing the waves they (institutional) are creating. Take a look at an example below.

Image 1.1 – EURUSD 1hr Chart
impulsive price action EURUSD 1hr chart dev2ndskies.wpengine.com

Notice how in this chart, the candles that stand out the most are the red ones, particularly the ones towards the top left? They are the largest in this entire series, communicating strong order flow behind them.

In fact, if you look at candles 1-8, all but the blue doji in the middle are solid in size. Yet candles 9-17 are all contained within the highs and the lows of last 2-3 candles in this down leg, communicating weak order flow and participation behind them.

As a whole, impulsive moves tend to have large candles (bodies and wicks) behind them.

2) Mostly of One Color – this ingredient is also common among impulsive moves as it communicates something critical to us – time. More specifically, how the bulls or bears were able to maintain control of the price action over time.

In the chart above from image 1.1, you will notice in the down leg, there is only 1 blue candle, meaning for 8 out of 9hrs, the bears had complete control of the market (almost one full trading session).

By maintaining control over time, the market is communicating who is the more dominant side because they are not allowing the other to take control of a candle for that time period. The greater the imbalance is between the bulls and bears over time, the greater the dominance is from either the bull or bear side of the market.

It is important to look at price action not just based on structure of the candles, which is one dimensional. Price doesn’t just move in a vacuum, it moves in time, and HOW price moves over time can communicate a lot of information to us as traders.

3) Closes Towards the Highs/Lows of the Move – If you think about it, when the market is in a strong trending move, let’s say using a 4hr chart, and the candle that closed in the direction of the trend (in this case uptrend) has a very small wick, thus a strong close towards the highs, what does that communicate?

It should communicate that there is very little profit taking from the players behind that candle. If they were worried going into the close of that candle about an upcoming resistance level holding, or perhaps the bears may take control of the market, they would likely close their position, or take profits right before the candle closed.

But when you have a strong close with a very small wick, this usually indicates very little profit taking, thus a confidence the move will likely continue. This is highly useful to us as traders, and will be common among impulsive moves like in the chart below.

Image 1.2 GBPUSD 4hr Chart
impulsive price action GBPUSD 4hr chart dev2ndskies.wpengine.com


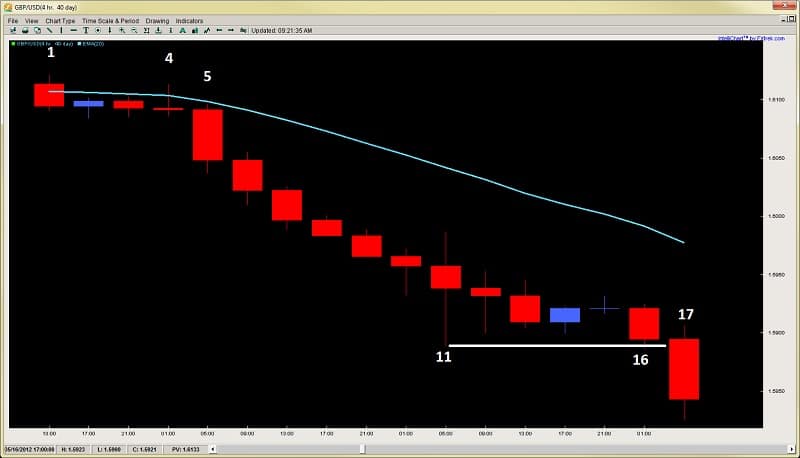
Starting with the top left of the chart using candles 1-4, the price action moves in a sideways corrective fashion until candle 5, which if you notice, increases in size tremendously (rule #1 of impulsive moves). From here, price continues on selling for the next 9 candles, 10 total in a row, or 40hrs of selling (rule #2 of impulsive moves).

But looking at the candle closes, you can see most of them are towards the lows, showing very little profit taking along the way, thus suggesting likely continuation.

Only until candle 11 do we get a strong rejection, and from here price then moves sideways in a corrective fashion until candle 16. But what happens at candle 17?  The candle expands (rule #1) telling us the trend will likely continue.

So these are three examples of the common characteristics of impulsive price action moves.

What About Corrective Moves?

The good thing about corrective moves is they are easy to spot, since they have the inverse characteristics of impulsive moves. Meaning, they tend to have;

  1. Smaller Candles
  2. Greater mix between red/blue or bull/bear candles
  3. Closes more towards the middle with larger wicks

Thus, if you apply the logic of impulsive moves, you can easily understand and identify corrective moves.

How Do They Relate to Each Other?

Generally, impulsive and corrective moves tend to have a common pattern or dance with each other.  The general pattern that tends to play out between them is the following;

1) Impulsive moves about 75% of the time are followed by corrective moves.  These corrective moves can either be horizontal, slightly against the impulsive move, or even slightly in the same direction, but they denote a change in the order flow and participation.

2) 75% of the time, these corrective moves are followed by impulsive moves in the same direction as the original impulsive move.  Why?

Because those who are in control, rarely give up control unless encountering a strong counter-trend force.  Even then, they usually make a second attempt to take out a recent swing high or low before giving up.

Only when they fail a second time will they usually exit the market, either waiting for a new chance to get in on a pullback, or reset completely.  This is why V-Bottoms are quite rare and only form about 10% of the time.  Usually there is a 2nd bottom, which is could be a LL (lower low), HL (higher low) or a similar low.

3) This series between the impulsive vs. corrective moves will generally continue until the market encounters a counter-trend impulsive move, which usually translates to an equal or greater force on the opposing side of the market.  Very similar to Newton’s Laws of Motion about an object in motion will stay in motion until acted upon another object with equal or greater force.

Let’s look at an example below.

Image 1.3 AUDUSD 4hr Chart
impulsive and corrective price action series AUDUSD 4hr Chart dev2ndskies.wpengine.com

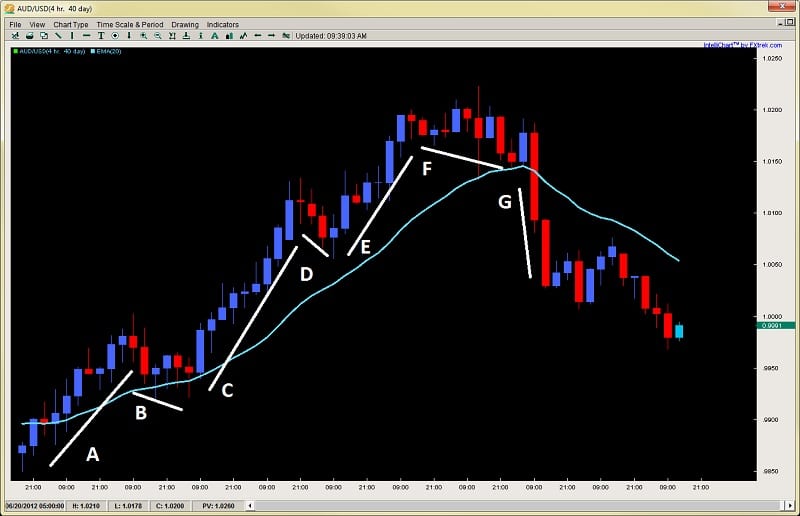
Glancing at the chart above starting with the bottom left at move A, you can see how it was an impulsive move, followed by a corrective move (B).  This series continued until…it hit a counter-trend impulsive move in G.  It was only until here did the bulls finally relent control as the opposing bears took control of the price action with the bulls likely taking profit or exiting all together, especially after the low point from move D was taken out.  Ironically, what followed move G, was a corrective move after, followed by the bears continuing the down-leg.

An Example Trading Impulsive Moves

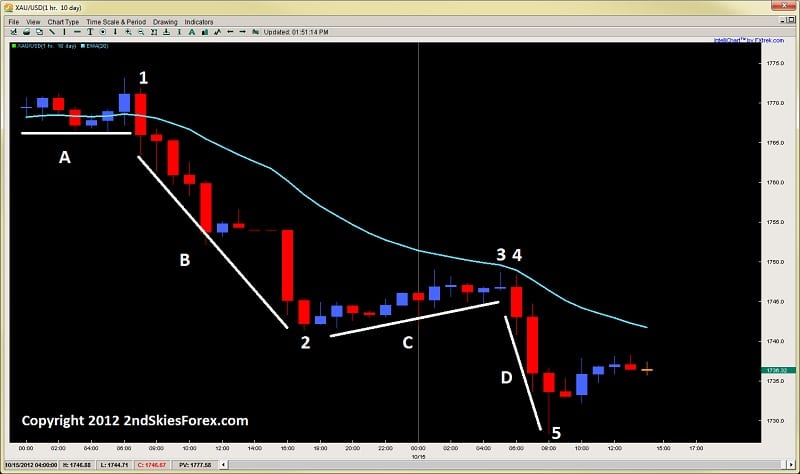
Today gave a really good example trading an impulsive move. Gold was a perfect example of a textbook impulsive-corrective series, offering a great setup to go short for a large reward to risk play.

Take a look at the chart below which is the 1hr chart on Gold. Starting with the top left of the chart, we can see a consolidation over line A which is a corrective move.  Then at candle 1, we have more selling in one hour than total buying for the last seven, which starts an impulsive leg down at B, selling off about $25 in 10hrs.

At candle 2, we see a corrective move (C) whereby price climbs about $8 in 12hrs, so less than 1/3 the climb from move B which took more time.  This is a clear example of how its less profitable to trade counter-trend than with trend.  This is not to say we cannot trade counter-trend, but there is far less money to be made.

Image 1.4 Gold 1hr Chart
impulsive corrective price action trading dev2ndskies.wpengine.com oct 15th

The corrective move at C ends with a pin bar rejection just $.50 below the 20ema, then starts another impulsive leg down at 4, dropping over $18 in 3hrs, also ending with a large pin bar.  I actually bought off the lows and made a quick profit, but there was far more profit to be made in less time selling from 3 or 4, then buying off of 5.

In terms of knowing whether to buy or sell, if you can learn to find an impulsive move, followed by a weak corrective move, often times that corrective move will offer a pullback setup into the 20ema or a prior support/resistance level.  These offer high probability low risk high reward setups.  Anyone selling the pin bar rejection at 3, or the pullback into the 20ema at 4, with a tight stop above the 20ema, targeting either the low at 2, or waiting for the pin bar close at 5 would have made anywhere from a 3:1 reward to risk, up to 12:1 reward to risk.

These opportunities show up in the market all the time, and if you can learn to read them, you can make a considerable profit by trading with the institutions impulsive buying or selling.  This is why it is critical to learn to read these moves, as they will help you not only trade in the right direction, but find highly profitable setups.

In Summary

This is just an introduction to how I approach price action and how I use this model as a base for understanding price action.  When you can learn to read impulsive and corrective moves, you will find they are highly effective for many things, such as;

  • finding the right direction
  • staying in the trend
  • spotting great pullback opportunities to get back in with trend
  • knowing when the market will continue and when the market is likely to reverse
  • how to find some of the more profitable moves in the market (impulsive)
  • knowing who is in control of the market
    and more…

There are many other facets and subtleties to trading impulsive and corrective price action, but this is a good introduction to my base theory and model for trading price action.  If you can learn to spot the impulsive and corrective moves in the market, they can greatly enhance the odds of your trades along with helping you spot key characteristics in the markets.

To learn more about trading impulsive and corrective price action, visit the Trading Masterclass.
I was planning on continuing with part 2 of the Best Support & Resistance levels article, but someone came to me with the following question just yesterday;
“Dear chris,
Do you know about ‘binaural beats’ and if so, would you comment on their possible uses regarding performance/trading.  thanks”
First off,  many of you are probably asking ‘What are Binaural Beats‘?
Ironically, I’ve been working with these for over a decade as my specialty in Neuroscience at the University was Human Learning & Memory.  I was studying methods how to improve memory performance, but also the learning process and how to accelerate it.
Binaural Beats are also known as Binaural Tones.  They are sounds/tones which produce specific stimuli in your brain, but that will not suffice so lets dive into them more deeply.
How Do Binaural Beats Work?
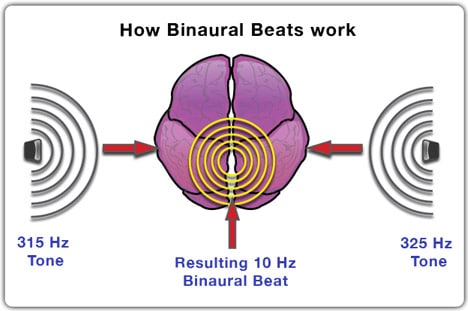
Basically, your brain when perceiving two tones with subtle differences between them (or with frequencies slightly different than each other) will pick up the difference between the two frequencies when the difference is  <  or = to 30Hz.
When this happens, the brain will hear this difference as a binaural tone/beat.
binaural beats trader psychology dev2ndskies.wpengine.com
But this is where they effect the brain.
You have probably heard of all the different brain waves which tend to correlate to different patterns of thinking.  The breakdown is below;
Gamma Waves (> 40Hz) are usually associated with fear, perception, problem solving and strong mental activity
Beta Waves (13-39Hz) are associated with busy/anxious or nervous thinking, active concentration, paranoia and arousal
Alpha Waves (7-13Hz) are associated with a state of relaxation while being fully awake.  Possible pre-sleep, REM sleep, & Dreams
Theta Waves (4-7Hz) are associated with deep meditation, relaxation and NREM sleep
Delta Waves (<4Hz) are the product of deep sleep, loss of body awareness
How does this relate to Binaural Beats?
Remember the part about the difference between the two frequencies creating the binaural beat you hear in your brain?  Well, if the difference created from two frequencies is say 10Hz, then your creating a binaural beat which will help to stimulate Alpha Waves in your brain.  These waves are associated with being in a state of relaxation while being awake.
Basically, the brain (through a frequency following response mechanism) when it receives a stimulus such as a binaural beat that has a frequency associated with a particular brain wave (i.e. alpha, delta, theta, gamma, beta), your brain will adjust its frequency towards the one it is hearing.
This is where Binaural Beats become useful and is called by neurophysiologists as Entrainment.
Entrainment (also known as Brainwave Synchronization) is using frequencies (and the frequency following mechanism) to stimulate your brain into a particular dominant frequency.
How does this help me as a trader?  
By using binaural beats, you can train your brain to be in a more optimal state for trading (Alpha or Theta Waves) which are associated with a more relaxed state and meditative state.  Being anxious, fearful, unfocused, paranoid, etc. will obviously cause you to make more emotional decisions (fear of losing so you close your trade early), more irrational decisions (I just lost and have to make it up, so i’m doubling my position size), essentially clouding your mind which needs to be clear, alert and sharp when trading.
binaural beats benefits to trading psychology dev2ndskies.wpengine.com
Your mind is your main tool for trading, so the sharper it is, the better decisions you will make.  The worse the state its in, the more likely you will make poor trading decisions, along with repeating negative patterns which are accompanied by certain brain waves and neurological states.
Binaural beats are a neuro-feedback technique to train your brain to be in an optimal state while trading. From my experience, this is far superior to biofeedback, such as strictly monitoring HRV (heart rate variability) which can often be a secondary effect from your mental state.
On top of it, using just biofeedback only informs you when your not in an optimal state.  Although this is useful, you are still left with the work to get yourself back into optimal state.  Try going from being really angry or frustrated (about a big loss, or anything) to optimal thinking in a short period of time.  Not easy is it, especially when your trading and money is changing hands fast, or you have to make quick decisions.
This is why I prefer neuro-feedback as a far more valuable tool, particularly binaural beats and isochronic tones because they are training your mind to be in that state through the frequencies which create a neurophysiological pattern of thinking more conducive to trading.
Where Can I Listen to Binaural Beats?
Many of you may be asking, where can I get these binaural beats?  The easy way is YouTube where you can search for them and find plenty of samples.  I use much more tailored binaural beats through a company called Entheos which you can find here.
The product line is through their ‘Daily Mojo‘ section.
I listen to about 20-30mins a day of these tracks before I start my trading day, but after I’ve done my morning yoga and meditation.
I also have another training program I use called LimitlessIQ which has a large suite of products for tailored states you are wanting to create (zen like focus, stress relief, faster brain cognition, etc).  I also listen to 20-30mins of these before starting my trading day, so a total of 40mins to an hour of preparation each day just using these techniques.  If you think about it, all professionals prepare before they perform, and usually, the level of preparation they engage in is related to their level of skill or challenge.
It should be noted LimitlessIQ uses a slightly different technology called Isochronic Tones.  The difference is instead of creating the desired brain frequency through two tones with the brain picking up the difference between them, Isochronic tones are evenly spaced that turn on and off rapidly.  So they are not relying upon a combination of two tones, yet create the intended frequency through the on/on effect.
Eyes Wide Shut
I personally find both highly effective and can literally feel the physiological changes in my brain when listening to these in seconds.  You can play them while trading, but ideal is to do so for 20-40mins before you start your trading day, with your eyes closed just listening to the beats.
Why eyes closed?  
improving trader psychology through binaural beats dev2ndskies.wpengine.com
Your brain is wired to take in more data through your eyes than anything else (about 70% of all data your central nervous system takes in).  So when your eyes are open, you will be reducing your bandwidth by taking in visual stimuli.  By having your eyes closed, you are, in effect directing all your energy into creating the dominant brain waves which will help to produce a more optimal neurological state for trading.  It should also be noted binaural beats are best listened to through headphones so you can easily isolate the difference in the sounds.
Summary
Binaural Beats are a tool to help improve your trader psychology simply by altering your neuro-physiological patterns which underlie your thinking.  By training (or entrainment), you can stimulate your brain and thinking patterns to match a more relaxed state which will ultimately improve your trading.
Neuro-feedback is more preferable than bio-feedback as it offers you more information, but actually helps to train your brain to create more beneficial thinking patterns, while bio-feedback means you have to adjust your state.  By listening to binaural or isochronic tones per day, you can help to create a more optimal neurological state prior to trading so you can make the most clear and relaxed decisions while trading.
Keep in mind though, these are not tailored states for trading – just associated states which will most likely improve trader performance through more optimal thinking patterns.
I will have more to say around this come mid-late July, as I am working directly with a Neuroscience lab in California that I’ll be meeting with soon.  But imagine what it would be like if you could train your brain to work in the most optimal way for trading.  Imagine being less harangued by emotions, fear, distraction, etc.  Then imagine what this could do for your trading.
To be continued…
Make sure to leave a comment and click the like buttons below to share it 🙂
Other Related Articles:
The Mindset of A Successful Forex Trader
Do You Have The Willpower To Trade Successfully?

5 Mantras for the Developing Forex Trader