Yesterday was my first day back at the range in a week. I had some problems with my shoulder so was resting it, but yesterday it felt better. Even though I’ve been shooting for over a year now and won two competitions, there is still a lot of work to do.
I was shooting decently consistent to start off yesterday…scoring a 10 (perfect), a 9 (in the gold center) and an 8 (red – one level off from the gold center) for every 3 shots (round) from 18m which = 60ft.
My pulling shoulder which used to be out of alignment (too high) was now at the proper level, but my back elbow was not totally inline with my front gripping hand. I started to make some adjustments but still the same result…10, 9, 8. I began to wonder what am I doing that is off?
Just then the instructor Diego pulls me aside and tells me next round we’ll go back to 3m target as he wants me to work on something. At first, it was discouraging to my ego being moved to the smaller target. But, I’m committed to learning the art of archery so instead of worrying about looking good shooting at the 18m, I was happy to go back and practice some basics.
Although most of my technique was correct, I was missing two things;
1) After my shot, I forgot the rhythm to close my eyes for 3 seconds while holding the bow
2) I had put too much of my energy on the target and not the process

The first one was relatively easy to change as it require a physical adjustment. However, the second one needed an internal adjustment, one that was more subtle and had no outer reference for me to gauge.
After three rounds, I was keeping my eyes closed and back in the rhythm, but far more importantly, my energy was focused where it needed to be – on the process and not the target.
I went back to 18m and started shooting. The whole time I was using my energy on the process and forgot about the target. After 3 arrows, I shot a 10, 9, 9. Even though the result was a slight improvement, there was something else going on. My awareness was where it needed to be. I was totally focused on the process and not the result, and thus doing all the things I needed to make a good shot.
How Does This Relate to Trading?
In trading more so than archery, there is a temptation which can distract you from the process. It is called money. Most people learning to trade do not have all the money they need so the temptation to be distracted is enormous. You look at your charts and see the EURUSD moving 150pips in the last few hours or the GBPUSD moving 400pips in the last two days, or all the flashing lights and what do you think?
‘Wow, I could have traded that and made $$$‘. Or you think, ‘Whoa, that pair is moving, I should get in that‘. Or, ‘Wow, if I had put 10 instead of 5 lots, I would have made double the money‘.

Sound familiar? If it does, your not alone and most traders go through this process. But herein lies the trick, which is the same in Archery.
It is easy to be more focused on the target and not the process (following your trade plan & rules, using proper risk management and being disciplined). It is more convenient to not follow your trading plan and make some quick pips then to follow it completely no matter what is going on in the markets.
Everyday I have tons of traders like yourself that come to me saying ‘I want to do this for a living‘ but when it comes down to it, many do not follow the system, or the risk management rules, or the trading plan. It is because they are so focused on the target and forget about the process.
Trading for a Bank
Speaking of trading for a living, do you know what it takes to trade for a bank?
4,000 trades. Yep, that is right – 4,000. Why? Because banks want to make sure their traders are trading their system as is, and the best way to do it is drill it over and over again. They have a lot of money on the line and they want to make sure before trading their money, you know what your doing to the point it is habit. This can only be done if you are focused on the process in the beginning.

Your Training as a Trader is not finding the best system out there, but in learning how to master the process. How do you do that? By being fully focused on what you are doing every time you make a trade. By doing this, your thinking or emotions never get a chance to interfere with your trading and decision making.
Have you ever had a great trade setup but didn’t take it out of fear (emotion)? Or have you ever got in a really good trending move, only to exit early before your system because you ‘thought’ it was going to turn around? Has this ever happened to you? If so, it is a direct communication where your focus is (on the target, not on the process).
As in Archery, so in Trading
When you are trading, ask yourself where is your focus? On the target and money to be made? Or on the process (using correct risk management, following your system, executing the technique). Keep your focus on the process until it is drilled inside your head so deeply, there is nothing left but the discipline and you executing according to plan. Skill is a drill and all highly successful traders have drilled their skills through the hammer of the training process.
Lastly, if something is not going right with your trading, do not feel it is a setback to go trade smaller lot sizes or go back to demo. I often have to go back to the 3m distance to work on various aspects of my technique. Once they are back in sync, I go back to the 18m. You can do the same with trading by going back to demo for a month or so, and once the results improve, go back to live trading. Quit thinking about the money you have to make right now and focus on the process. When you do, you will find you are hitting the target with more consistency then ever.
If you liked this article, then please make sure to ‘tweet’ and ‘like’ them via the buttons below. Your comments are also welcome so please make sure to share.
For a really good article on Discipline and the mental aspects of trading, check out this great article on Trading Lessons from Jesse Livermore – the World’s Greatest Trader.
And for those looking to take their trading to the next level and work with me as your mentor, make sure to check out our Online Courses where you will learn the same systems I use daily along with having a chance to communicate directly with me to help you build your own trading plan.
Earlier this week I was talking to a student who is starting his private forex mentoring with me. He was actually referred to me by a previous student I spent time mentoring two years ago. This former students name is Tony and had no prior experience in trading, nor a degree in business or finance. But he had a serious desire to learn how to trade successfully while putting in the work and study.
Occasionally he writes me an email to tell me he is still trading and doing well. He often asks me some advanced questions about the market, trading, but that is all.
What is interesting is when I talked to this newer student Ben I am starting to work with, I asked him how Tony was doing for 2011. He told me the following;
‘Tony is doing great. He is up 76% for the year and I’ve actually seen his trading report. He’s only had two losing months this year and has been getting asked to manage funds for clients.’
First off, I was nothing but proud and happy to hear this about Tony. I was not surprised he was managing money as he emailed me 6 months ago asking about the issues around such ventures which can be complex.
I asked my new student after talking with Tony, what he thought Tony’s greatest asset is. He responded with one word;
Discipline
Tony was taught a few of the exact same systems I teach all my students so he had no edge in regards to the system. Tony’s edge was his discipline. He simply had the mental fortitude to follow the system exactly as is. On top of it, he had the forex trading discipline to always stick to his risk management levels and never violated them.
So here was a student given the exact same tools as the hundreds of other students, and he was performing exceptionally well for the year – even outpacing most hedge funds (along with most traders on the planet).
He didn’t have some crazy algorithm or DaVinci Code system which sent Tom Hanks on a wild chase across the world to find it. He had a system which was obviously profitable, but even more so, the Discipline to execute it consistently and never violate his risk management profiles.
A trader without discipline will never experience consistency in their trading because they fail to use proper risk management and stick to their trading plan. This will likely result in them making a lot of really good trades, building up their equity, only to have a few losing trades (or one) knock them down the ladder. It is someone who kills long term success in the race by forgetting to tie their shoes and eventually tripping over them. Trading is not a sprint, it’s a marathon and requires conditioning over time.
Perhaps this sounds familiar about building up your account, only to have one or a handful of trades take out all your gains. If it does, then it’s a clear communication on what you have to work on (staying disciplined).
Developing traders often don’t understand, when you are asking to be a successful (or professional) trader, you are asking not just to build a pyramid, but to sit on top of it. What most forget is the base is the biggest part of the pyramid and the foundation for building higher levels.
As the pyramid continues to grow higher, it gets a little more complicated, but you have a base (foundation) and structures in place to carry the stones up to the higher levels.
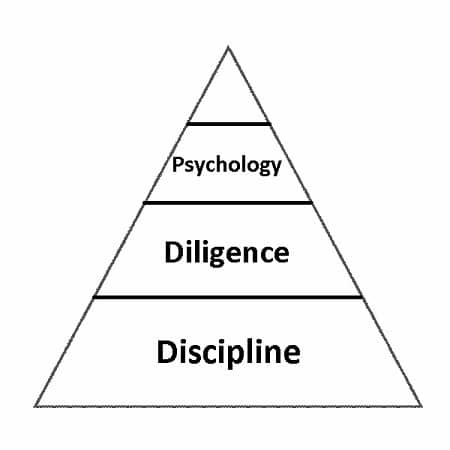
But just like a pyramid, there are more stones at the base and this takes more time to build. Also like a pyramid, there are more traders at the base (not making money or breaking even) then there are at the top.
However, with structures and rhythm in place, the fruits of your labor will result in a steady conditioning of your muscles (discipline, diligence and psychology). This will allow you to take on greater and greater heights, challenges and climb the pyramid of trading. Having forex trading discipline, diligence and psychology will give you a sense of confidence and a feeling of mastery over the process.
This is the pyramid of trading and the attributes needed to climb to higher levels.
While most traders spend time trying to find profitable trades, or the next great system, make sure you take time out to build the attributes which develop your trading muscles (discipline, diligence and psychology). By yourself this can be a very difficult task so it helps to create mechanisms in your life to build these habits. Finding a mentor who can guide you along your path can be instrumental in developing yourself into a successful trader. But cultivating the habits needed to take your trading to the next level simply requires some work and time.
Kind Regards,
Chris Capre
2ndskiestrading.com
Twitter; 2ndSkiesForex
For those of you looking for a mentor, make sure to check out our highly successful Online Courses to help take your trading to the next level while getting direct access and mentoring from Chris Capre.
One of the most challenging frontiers for forex traders has been interpreting Price Action without the known presence of order flow. Although there are many methods which dip their fingers into the toppings of the pie and get a taste of the price action (i.e. candlesticks, Elliot wave, pattern recognition), none of them seem to get fully into the bedrock of our subject – into the actual ingredients of price action.
What is Price Action?
Price action is essentially the closest relative to order flow in FX and across all markets. It is the direct result of order flow. Thus, it has the fingerprints of bias, speed of buying/selling, where buying and selling is occurring (support/resistance) when a breakout is genuine and where a likely reversal is occurring. From the continuous flow of price action which pours onto our charts, all indicators are born and thus dependent upon it. Hence, understanding and being able to interpret price action becomes an essential component to our trading. Understanding price action is a way to get into the essence behind what creates the indicators and most technical signals in the markets.
The 4 Staples
Since there have been countless books, articles, etc. written on how to find and use support and resistance levels, lets dive into four unique methods or staples for understanding price action.
-
Impulsive vs Corrective
Elliot Wave theory had the wisdom and insight to examine the difference between moves. The two essential moves everyone sees is either an Impulsive move or a Corrective move.
-
Impulsive Moves
An impulsive move is characterized by a forceful or strong move in one direction. It is fast and powerful, thus producing some of the larger candles in a set albeit any time frame. It is also usually followed by several candles moving in one direction, or the bulk of them in a move. The candles are often signified by closes towards the top or bottom of the candle, depending upon the direction of the impulsive move.
They are ultimately created by a large amount of capital with the buyers/sellers coming in at a particular level with a specific direction in mind. The other scenario is they are created due to a price cascade, via tripping up large stops and, thus, removing the defenses to the upside or downside of a support or resistance level, creating an imbalance to the order books. Impulsive moves can happen on any time frame.
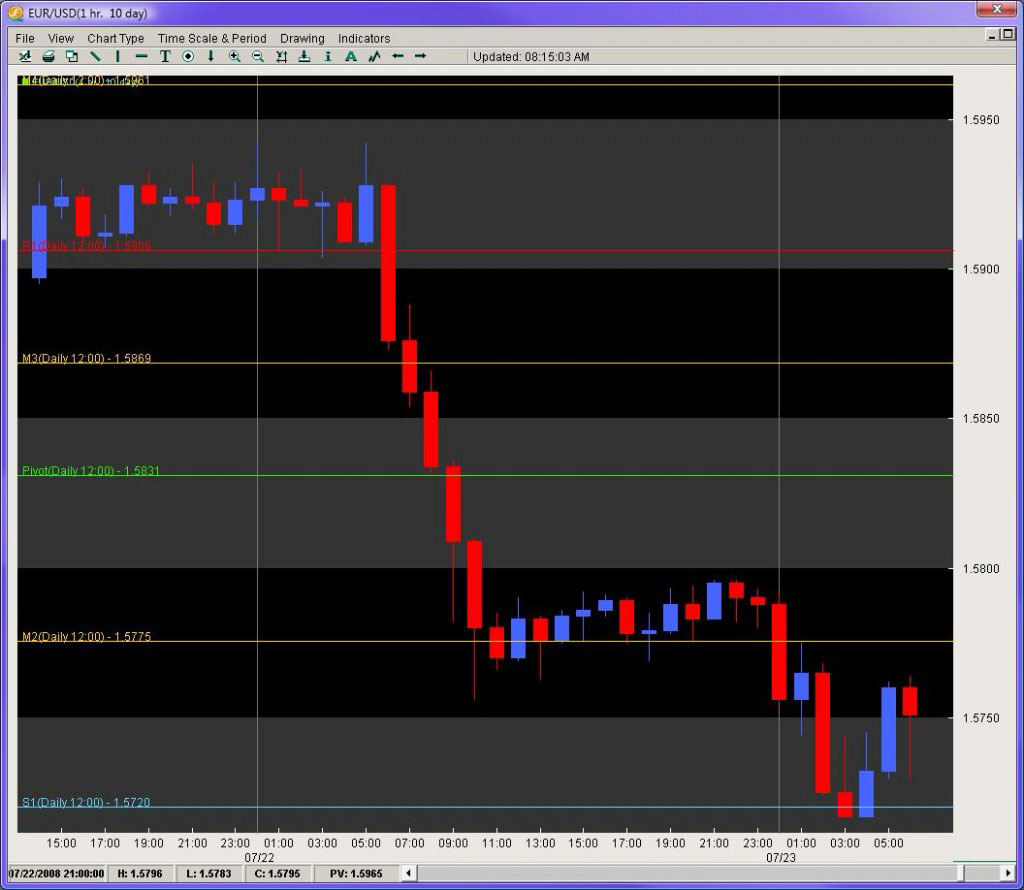
Figure 1 illustrates a recent impulsive dive in the EUR/USD. In this 1 hr chart, notice how the move starts with the largest candle in the entire down move and the close being towards the bottom of the candle (signaling constant selling pressure for the entire hour).
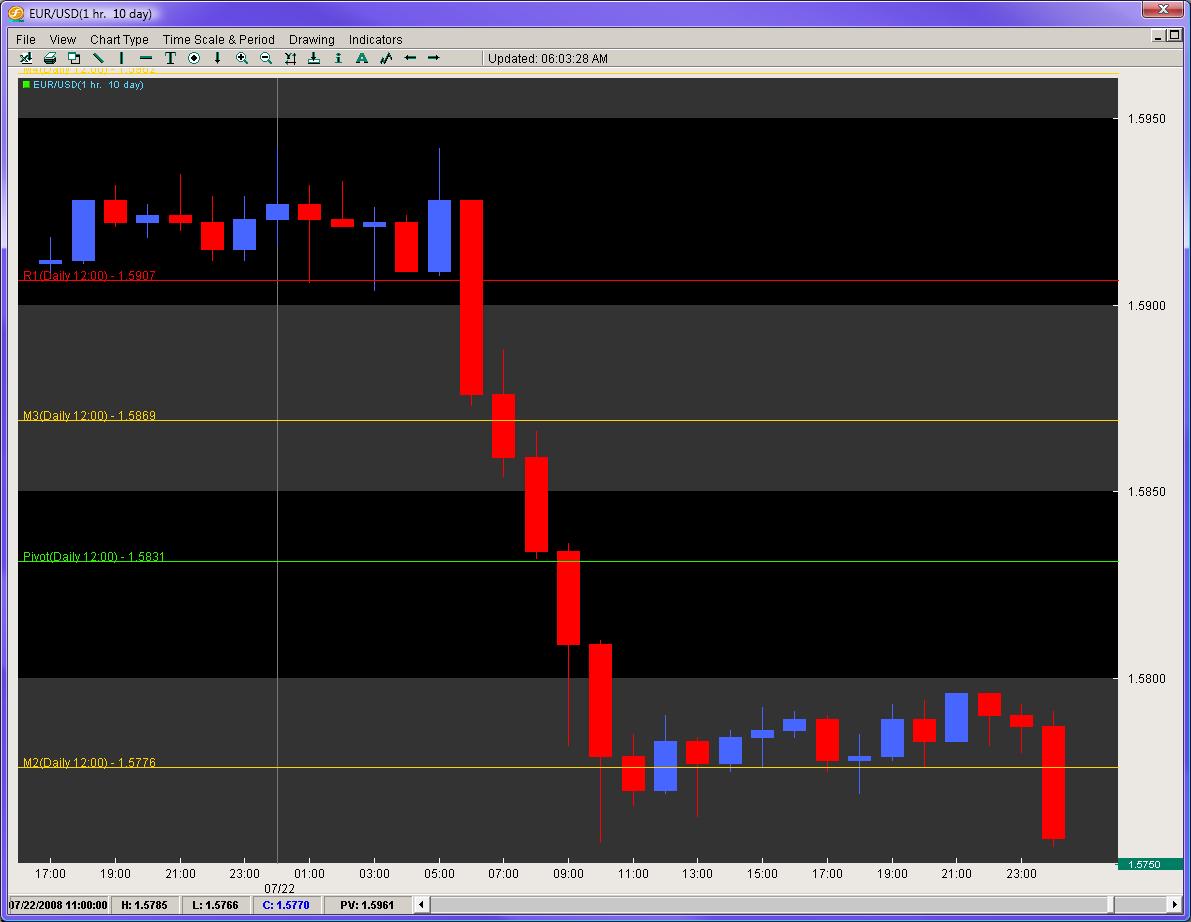
Also notice how before, the move is a mix of red/blue candles, but once the impulsive move begins, we have six red candles in a row.This send this pair on a peregrine falcon dive from 1.5928 to 1.5756 (172 pips) in a matter of 6 hours. The daily ATR for this pair was clocking in at 133 pips from top to bottom on a daily basis, but in 6 hours it eclipsed the average daily range by almost 22%. This is a great example of an impulsive move.
These are the types of moves we want to be in. They are the moves where the order flow is most consistent and heavily biased in one direction. Its no secret the larger players move the market. Thus, being able to identify impulsive moves and riding such waves give us some of the best trading opportunities.
-
Corrective Moves
Corrective moves are the most common moves to follow an impulsive move. They are practically the inverse of impulsive moves. The candles are usually smaller in nature with closes not particularly aligned to the top or bottom. They are usually a mixed bag of fruit with both blue and red candles and generally have little or no bias. It is important to identify these because they are the prelude to the next impulsive move.
From an order flow perspective, they are usually created by one of two scenarios: 1) profit taking after an impulsive move with few significant buyers/sellers coming in to challenge the previous move, or 2) a clear mix of buyers and sellers residing at the same place and a potential reversal point. More often than not, a corrective move following an impulsive move is usually a continuation move.
In Figure 2 we are looking at the same EUR/USD move which displays the corrective move before the large triple landing dive for this pair, followed by another corrective move and then further selling.
Remember, when trading, we want the order flow bias to be heavily in our favor. Corrective moves offer little bias with order books closely aligned to 50% buyers and sellers. Even in the better case scenarios with a 60/40 tilt, you still have a much higher percentage of players on the other side of the market, moving the price action in the opposite direction of your trade. Ideally, we want the highest tilt available and corrective moves in and of themselves do not offer this for us as traders.
The next two methods come from a trade I had done while working for a hedge fund.
-
-
Pips Gained vs. Pips Lost
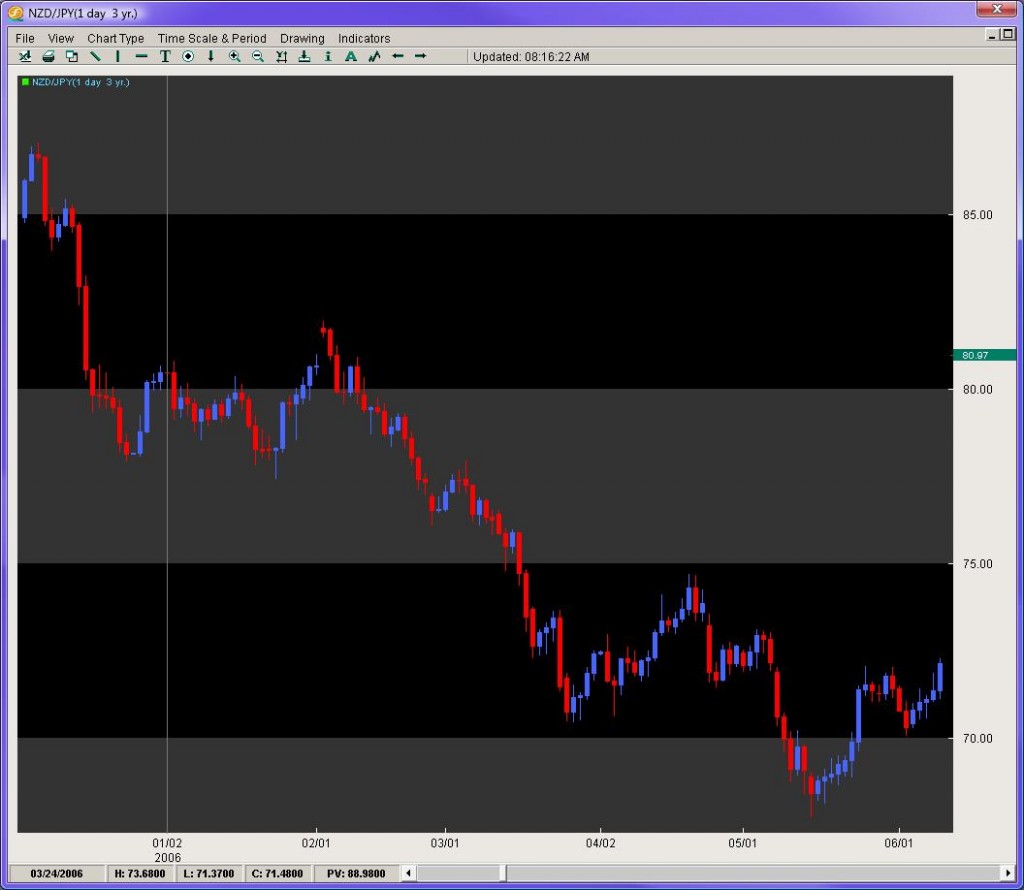
In the summer of 2006, I had joined a hedge fund in California, and was on my first trader call with the President and CEO. We were discussing our trade ideas for the week, and I brought up a controversial pair – the NZD/JPY. Although I was sensing an impending reversal down the line, I was still bearish on the pair. However, the President and CEO were bullish on the pair, feeling the time for the reversal was ready to leave the womb and enter the world.Looking at figure 3, we can see the pair was on a heavy decline from just above 85.00, falling all the way down to 68.00. The pair had bounced off the lows 400 pips to challenge the 72 figure. After a little dip, the pair re-attacked the 72 level and looked to break to the upside. There was also the presence of a small Inverted Head and Shoulders pattern which is a clear reversal pattern.
In front of all this, I still disagreed. Regardless of the top from this down move (87.05), the pair had started the year at 80.48 with the current price being 72.15 on the close of the then current day. The pair had ultimately lost 833 pips on the year. The price action had suggested for the bulk of the year, traders were much more apt to be selling instead of buying. Furthermore, using our impulsive vs. corrective analysis, the most impulsive moves for the six months of price action were clearly to the downside, with the series of moves having more consistency in the sell-offs vs. the buy-ups.
I shorted the pair while the President and CEO were against it. The pair then declined 340 pips over the next two weeks. Longing the pair at that time was clearly not the option.
Thus, we can see how measuring pips gained vs. lost gives an insight into where the previous buying and selling had occurred and where the next likely move is. Another stellar example of this is the USD/CAD.
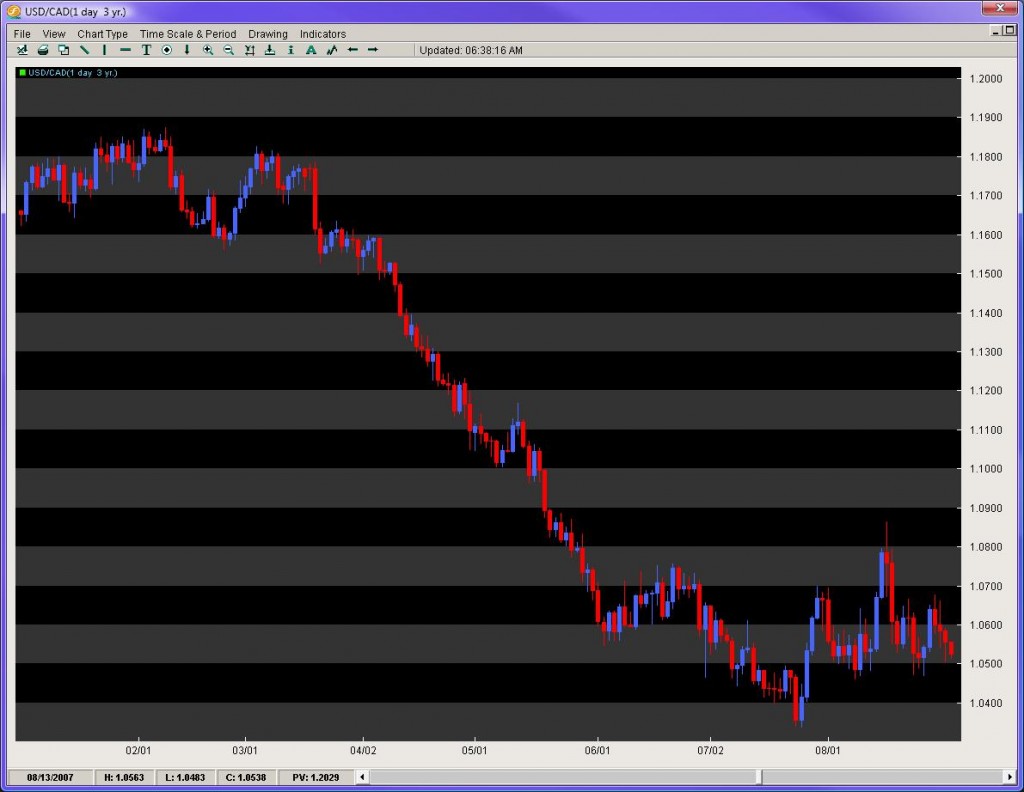
In the late summer of 2007, the USD/CAD (figure 4) had started to show some bottoming after a torrential sell-off. After some consolidation, the pair sold off from 1.1800 to 1.0400 in a period of 4 months. This was a merciless move that could find nobody willing to step in front of the locomotive selling. The pair finally found a decent floor after bouncing off the 1.0400 handle and settled between 1.0500 and 1.0700. At this time, hundreds of technicians and economists, still baffled by the overextended downtrend and momentum of this move, were calling for a reversal, at least in the short term. Now consider some very important questions using the pips gained vs. lost method.
The pair sold off roughly 1400 pips in 4 months and was down about 1100 for the year. On top of that, it was only 4.5 years ago the pair was at 1.6000 (5500 pips ago) and had yet to complete anything greater than a 50% retracement of any major leg, with each retracement going to its corresponding extension.
In light of all that, why in the world would anyone be paying attention to indicators and their over-extension since the pair had no regard for them? Furthermore, who in the last 4 years made significant money buying the USD/CAD? And since the order books/price action were completely dominated by an overwhelming pips lost vs. pips gained, who could even think about buying or a reversal until we have a clear bottom, albeit an activated reversal pattern or a 61.8% fib break of any major leg?
The answer was obvious – keep selling until proven otherwise since that is where the price action had reigned king and had yet to be dethroned.
Measuring pips gained vs. pips lost gives us a pure look at where the order flow is most consistent leading up to the current day/time. This method is very powerful over longer time frames, but is incredibly helpful on shorter intraday times as well. Be wary of trading in front of serious moves where the pips gained vs. lost is against you.
-
Counting Candles
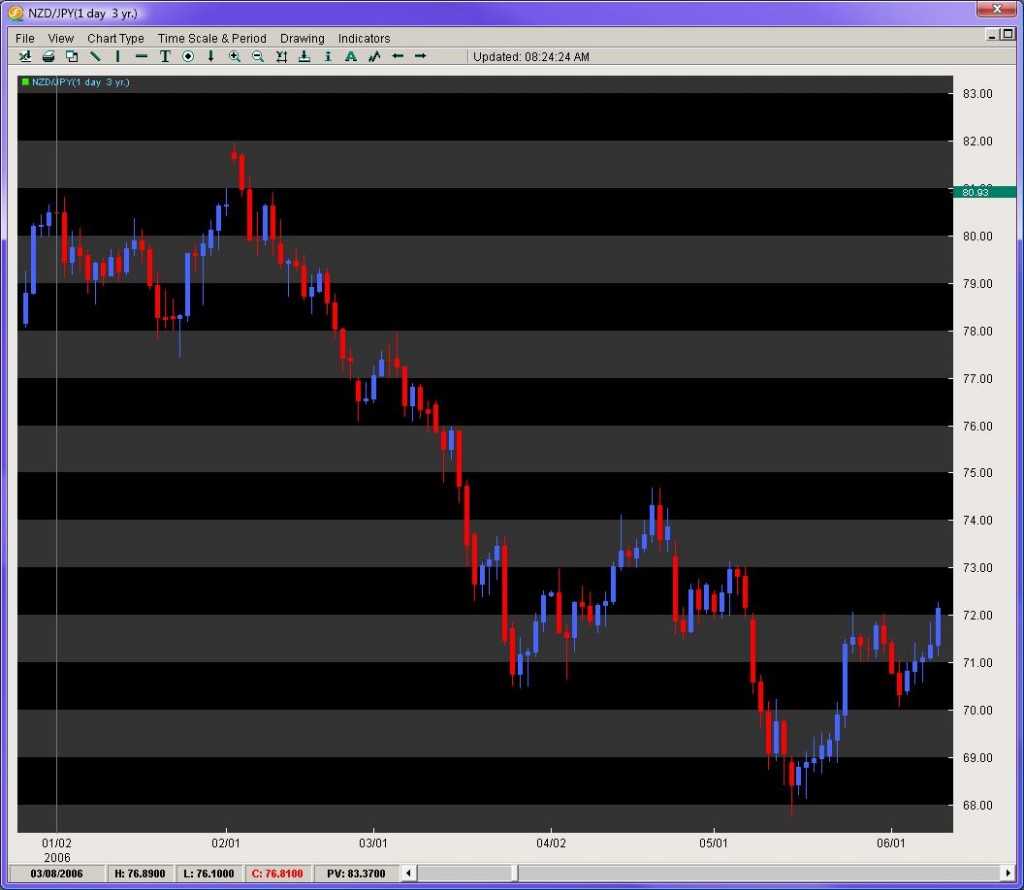
Counting candles in a series or leg of a move can be useful on many fronts. First, it can tell you how many weeks/days/hours/minutes a pair has been bought up or sold off. If you are looking at an entire year, this can be very helpful in identifying where the clear buying/selling pressure is likely to continue. Even on intraday moves, this has potency. It also gives you a rough idea for a particular leg, what the percentage is you will make money on that candle, or lose money.A look at figure 5 ushers some insight into this. Looking at our NZD/JPY daily chart, while heading into this trade, for the year the pair had 59 red candles and 52 blue candles. That meant on any given day up till that point in 2006, there was about a 50% chance of making money if you entered and exited the position on the beginning and ending of each day. However, using the pips gained vs. lost method, the 50% became much more heavily weighted to the downside suggesting if you sold on any day and were correct, you would make more money. The counting candles gave us an initial % value to the likelihood of our trade being successful, but combined with another method, increased the value of our short position significantly.
-
Time Variables
Pattern recognition and Elliot wave methods do a solid job of bringing in time variables into trading, but they leave many details into question. Two methods to working with time variables are listed below.
-
Time lapse/display for patterns
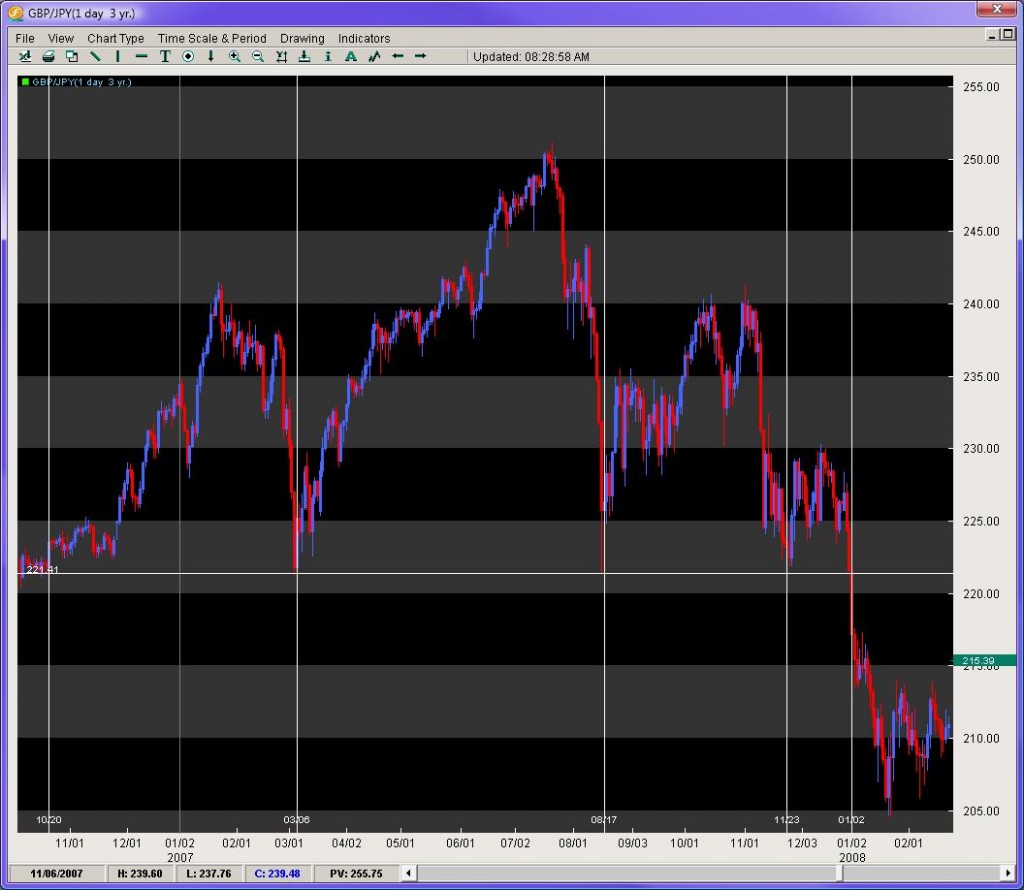
When looking at a pattern, albeit Head and Shoulders or IHS, wedges/triangles, or even consolidations, it is important to examine the time lapse/display involved and how it should play itself out.The GBP/JPY from late 06′ to the beginning of 08′ was forming a large Head and Shoulders pattern. This was heavily watched by technicians as the break was suggestive to be massive with the distance between the head and neckline roughly 2900 pips. What was more interesting was the time displayed in the formation of the pattern.
Looking at figure 6, notice the vertical lines which identify the touchdowns where the beginning and ending of each shoulder was made. The left shoulder from initial floor around 221.41, to its rise and fall back down to the same level took about 4 months and 3 weeks. What was tough for traders to figure out was when the right shoulder was forming, particularly if the second touchdown on 221.41 in late November was going to be the last stand at the OK Corral.
Notice how the pair bounced just a bit, and then re-attacked the same price level to easily break it the 2nd time around. When the RS was forming, the space or time displayed between the 1st/2nd touchdown was only about 3 months, yet the initial LS took 4 months and 3 weeks suggesting the RS should take about the same amount of time to form.
If you look at when the pair finally activated the break of the neckline, the time lapse or display was 4 months, and 2.3 weeks. This is very common amongst patterns – to have a consistent time lapse or display within themselves. Some other notables are wedges and triangles which usually complete or exit their patterns between 2/3rds and 3/4ths of the move. Rarely ever do they go to completion.
-
Length of consolidation
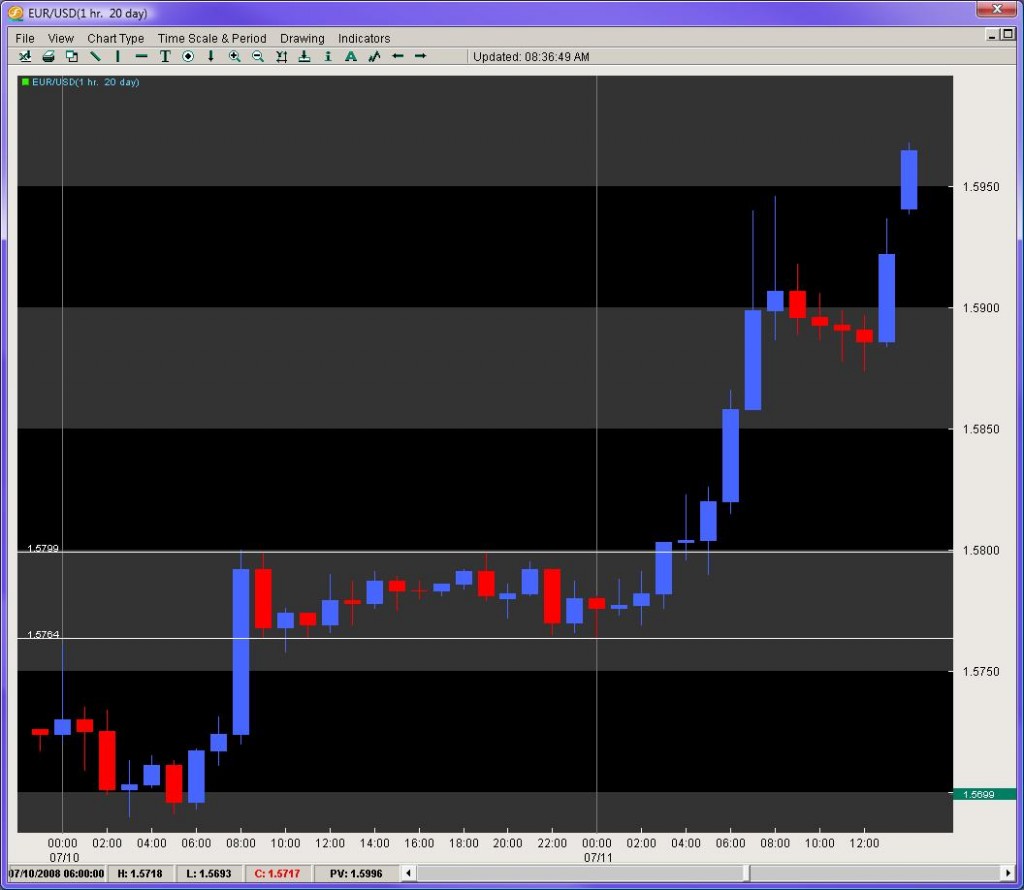
One other important time variable is how long a consolidation is forming. The larger the consolidation, the greater the probability the ensuing breakout will be legitimate and powerful. Breakouts are such a mystery to so many traders. Measuring the length of the consolidation can provide us powerful insights into this trading conundrum.Taking a look at the EUR/USD in figure 7, on July 10th, 2008 the pair had opened the European session at 1.5724, dipped to the round number at 1.5700 and then come early NY session was bought up in solid fashion up to the 1.5800 handle. This 100 pip move occurred over 3 hours, where it not surprisingly tapered back a bit at the London close. The pair then consolidated from 9am PST within a 36 pip range for the next 18 hours.
While it is not surprising there was no breakout during the Asian session, what is interesting is that from Noon – 4pm EST, where there is still plenty of liquidity, the pair could not find any new buyers/sellers. For the next 13 hours, the pair still trotted in place not just through the Asian order books, but also through the first four hours of the European session. That means through three sets of different order books/interest, the pair was hemmed in a 36 pip range and nobody could alter this for a total of 18 hours. When you see a consolidation for that long a period of time, expect a significant breakout to occur.
The following breakout gave us a nice retest of the previous resistance level and then generated a 160 pip move in roughly 4 hours. This was the largest single day climb of the week and ironically followed the longest consolidation of that week.
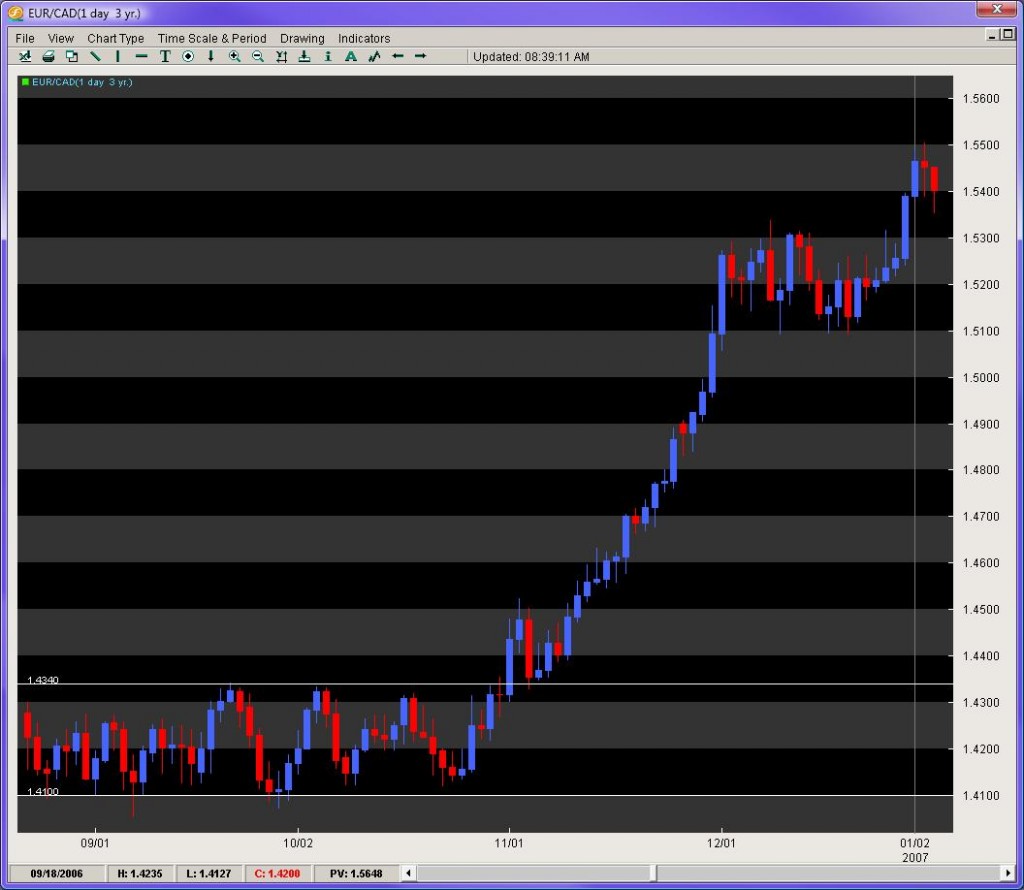
One last example of this method can be delivered via the EUR/CAD (figure 8). In the fall of 2006, this pair had entered a really tight consolidation between the end of August to the beginning of November, encroached between 1.4060 – 1.4350 (290 pip range). This was the tightest 60 day plus range over the last 4 years. With the Bollinger Bands applying their python like constriction, a large breakout was calling out to most traders. When the pair finally did breakout, it gave us a handsome retest of the previous 70day resistance level, and then went on a Himalayan trek for a 1000 pip climb in only one month. Being able to identify long consolidations can point us towards legitimate and powerful breakouts.
-
In Summary
Although there are many great methods for gleaning solid information out of price action (candlesticks, Elliot wave, pattern recognition), it is important we reach deeper into one of the most unexplored areas of technical analysis – that of understanding and interpreting price action. Being the closest relative to order flow and the mother of all technical indicators, a continual and intensive study of price action can only provide us with some of the most important gems of information to support our trading decisions.
The 4 staples or methods of understanding price action listed above are designed to give the traders a unique set of tools for approaching their charts and building a recipe for solid trades. Through the lens of these and other methods, ones trading can be vaulted to another level of insight, ability and success in trading the FX market.
For those of you wanting to learn more about Price Action Trading, make sure to check out our Advanced Price Action Course which teaches you rule-based systems for trading pure price action while also allowing you to join a community of traders.
For the record, I have no idea if Michael Jordan trades. I have no idea if he even knows about the Forex market or is actively involved in his investments. Nevertheless, he helps me with my trading.
I have read over 9 books on the man, have his DVD (Michael Jordan to the Max), seen pretty much every game and am constantly reading his quotes. Why? Simply put, he embodied greatness.
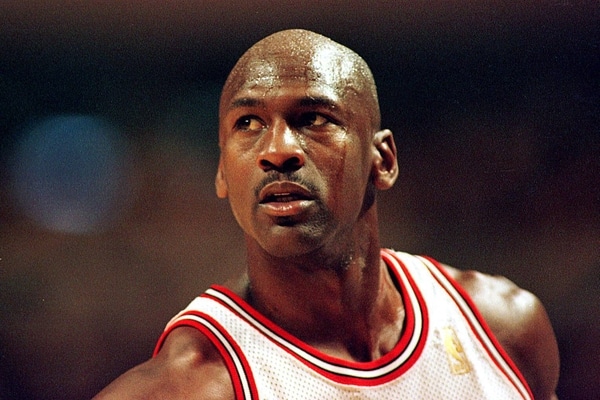
Many people think he was born with some magical talent to play basketball and nothing could be farther from the truth. The first time he played, he could barely dribble the ball. He couldn’t make shots and had none of the moves or skills he was famous for.
Many people only know him when by the time he was already great with the Bulls, or a standout player at UNC – Chapel Hill where he won the National Championship as a freshman. But few know the journey of how he got there, how he struggled, how hard his work ethic was, what challenges he faced, how he overcame his weaknesses, how focused he was and how he had to make his greatness through effort, discipline, and will.
His Early Years
Michael came from a family of ‘sharecroppers’ – people who rented the land and shared the crops they produced. His grandparents were born sharecroppers and worked extremely hard. They had food on the table but were still poor. His parents had this hard work ethic built into them and it was a hallmark of their character. With four children to raise, James (Michael’s father) built his own house on a plot of land (working on weekends) they saved up for years to buy. While building this house, Michael, the youngest of four, got to see the results of hard work first hand.
Even though his mom had four children, she also worked a full time job.
When the father later started playing basketball with his sons, he never made it easy for them. They had to earn their wins. Michael being the youngest of 4 had to play even hard since he was physically smaller than his older brother Larry who he played against all the time. Larry also never eased up on Michael and they played for hours until dark. From the very beginning, Michael had to earn all his wins.
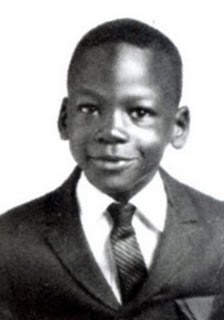
Later they both joined a youth team where Larry was the star and Michael was just another player. Although he had athletic skills, nobody thought of him as anything special in any sport he did. Hard working yes, but not special.
What is interesting to note is his father and brothers were not that tall, some just barely over 5’6″. But something happened to Michael. He never stopped growing like the others did when he was as tall as them. Many people in his family think he willed himself to grow.
Nevertheless, when high school came around, as a sophomore, he tried out but didn’t make the varsity team. He was hurt and his confidence was shaken. Being placed on the junior varsity team, after digesting his hurt feelings, he determined to become better. He worked hard at practice, so much so eventually the other players could not keep up with him. Even after having a great season with the JV team, when the varsity team was entering the state tournament, Michael was not selected to the group. So what did he do? After hearing the team’s manager was ill, he decided to fill in for him. He wanted to be there so bad, he would get there any way he could, even if that meant carrying towels and gym equipment for the players.
When the season ended, did you find him swimming at the pool or playing games with his friends? No. He was practicing every day on the basketball court hours on end. In the next year, he made the varsity team. Did he start off having great success? No. He actually struggled, made lots of turnovers, had wild shots and made all kinds of mistakes. He actually was a disappointment to his team and his coach.
Going into a holiday tournament, his team made the finals. Although he was playing all right, the game was close. His team needed someone to stand out in that moment. This is where Michael came in. With only a few minutes to play, something happened in Michael. He got really focused and had an intensity about him. He just started making plays and shots and steals that it was bringing his team back in the game. All the hours of practice over the years was starting to kick in. But there were only seconds left and his team was still down. Trailing by a point, his team gave Michael the ball. The team started to collapse on him so he pulled away for a shot. The ball was in the air while the buzzer sounding. Michael made the game winner! There was no fear of losing or of looking like a fool. There was just the concentration of the moment and what he had to do. Interestingly enough, Michael made the teams last 15 points of the game.
That summer he was the first student from his school to receive an invitation to the 5-star camp, a collection of the best coaches and players from the country receiving instruction and competing against the top players. Michael could not believe he was invited and wasn’t sure he belonged. So what did he do? Practice harder than anyone in the camp. He outplayed everyone there not through skill, but through having an unmatched intensity. He received more trophies from the camp than any other player.
Returning home from camp, did he rest on his accolades? No. He became possessed. Starting his senior year, he would go to the gym while it was still dark out and practice. After school was over, he would practice even more – again till dark. When the season started, even though he was on the Varsity team, he also practiced with the JV team to get in more time. After returning home from practice at school with both teams, would he rest? No. He would practice some more. When he started the season, he was a marked man, often finding 2 or 3 people guarding him. Did he balk or fade under the challenges? No. He averaged more points in his senior year than the one before even though he was guarded more intensely.
He then went to UNC as a freshman trying out for the team. Only 3 freshman before him ever started on the team. Did that stop him? No. He worked harder than ever. In the first game of the year, he got the nod, even through having a bad ankle. How did his first shot go in front of 11,000 fans and a regionally televised game? He missed and it clanked off the rim. Did that stop him? No. He got over his nervousness, stopped worrying about being careful and played. He let go of his fears and started playing using everything he had. And he got better.
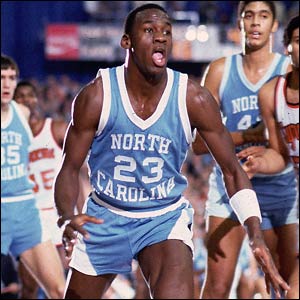
UNC eventually made it to the championship game in the NCAA tournament and were playing against another freshman (Patrick Ewing) thought to be the best player in the league. It was played before 61,000 fans and nationally televised. Imagine the nerves in being a freshman playing for a game like this. With UNC down by 1pt at the end of the game, instead of giving the ball to their top player James Worthy, the coach decided to give the last play to Michael, a freshman. With Worthy and Sam Perkins covered by Georgetown, Michael was perfectly open and took the last shot. He flung a high-arched shot that seemed to hang in the air forever. It snapped right through and he made the game winner as a freshman. Michael Jordan just made the game winner in a national championship. And this was someone who 4 years ago did not even make his varsity team.
Only two days after making the game winning basket and becoming one of the best known players in the country, did you find him relaxing with his friends, drinking at parties or playing games? No. He was back at the gym practicing and getting ready for next season.
I could go on an on about Michael’s accomplishments and many people are aware of his professional career. But few understood all he went through to get there, and what actually made him great.
How Does Micheal Help My Trading?
I can think of no other person who inspires me more to become better at what I do. Here was someone who wasn’t born great, but made himself that way. He worked harder than anyone else. He was more focused than anyone else. He was more determined than his peers and never let obstacles or losses overcome his mind. He used his will to make himself great at what he did. He faced his fears, doubts, and nervousness, yet he never stopped working on getting better.
Anytime I am tired, or think I have trading figured out, or don’t want to study, practice, work, or get better at trading, I think of Michael. Its the same reason on a saturday morning at 8am, while others at the university were recovering from their nights of drinking, I was in the library studying for the next 6hrs. I didn’t graduate a Golden Key National Honor Student because I was smarter than others. Shoot I barely graduated high school. I just worked harder than them. I sat down and continued to study, even when I wanted to get up, or was tired, or didn’t feel well. When I was playing soccer for a nationally ranked college team and had set three records the prior year, did I relax and sit on my accolades? No. Anytime we did our ‘flagpole run‘ from the field to the pole and back (a 3/4mile sprint), I always came in first every single time for the entire year. Its why I played 330 days a year.
When I lost $50,000 in 30mins of trading, did I give up, stop, quit or say I’d never do this again? No. I vowed to never make that mistake again and started learning more, practicing more, figuring out where I went wrong and correcting my mistakes. Anytime I ran into a challenge or faced a major loss in trading (which I had many times over the years), I thought of Michael and never gave up. I wasn’t born understanding markets or how to trade. Nobody in my family traded and I did not take one business class in college. I was a yoga teacher prior to trading and had absolutely no experience in the field.
When I applied for a job on Wall Street, did I let that stop me? No. After my first interview, one month later I was being flown out to Wall Street to learn the Forex markets from the market maker. After intense training sessions, did I rest and have a beer at the bar like the others? No. I organized after training sessions with the other trainees so we could study the markets.
When I went to the San Francisco office, I started with a group of 5 others who were all more experienced than I, some with masters degrees in finance or economics. Did I let that stop me? No. Although after one day of being 6mins late to work, my boss came on the company chat and asked me a simple question, ‘what time you supposed to be here?‘ I replied, ‘10‘. He then asked, ‘what time is it now?‘ I quickly typed, ‘10.06‘. What did he say? ‘Don’t ever be late again‘. And I never was. In fact, from that day on, I was always early, sometimes up to 2hrs and stayed always past after I was to go home. I came in on my days off and sometimes worked 7 days a week. I worked so hard that after a year, the same intimidating boss I had was about to ask me to take a vacation when I took my first. Even though I had 2 weeks vacation time, I took 4 days.

When I think of any degree of success I have earned in this field, I think of Michael Jordan and how greatness is earned and rarely ever given. It takes hard work to be great at anything. It takes never-ending focus and dedication, even after failures. Its the same reason on a sunny Sunday while I can see others out with their family and friends having fun, I am sitting in front of my charts, studying quantitative data, patterns, doing trading exercises to improve my analytic or pattern recognition skills, and continually working on my weaknesses. Its the same reason when im training in olympic archery, I am thinking of how it will improve my trading and what I can learn from it.
I actually met Michael once, when he was playing for the Bulls in 1992. After a home game, I was downtown and was still in the city an hour and half after the game. I pulled into a gas station as I needed to fill up. When paying for the gas, I noticed the attendant was distracted. I asked him what he was looking at, and he pointed to a black Mercedes with the license plates (MJJ JVJ – him and his wife’s initials) and said, ‘that’s Michael Jordan’. I went over to the car where he was talking to others. I told him amazing game and how thankful I was for watching him play. And then I did something a little out there. Knowing his competitive spirit, I asked him if he wanted to race. I had an older looking Chevy El Camino which had a hidden monster under the hood. He looked at it and said, ‘that? you want to race me with that?’ I calmly replied, ‘yes’.
What happened after is a story for my grand-kids.
Observations of Beginning Traders
I think many times, when talking to other beginning traders they want to take the easy way out. They ask others for trade signals or if their trade will work out. They would rather have someone else think for them instead of learning how to trade the market themselves.
Nobody ever became great by having someone else do the work for them. They listen to their minds, have no patience for a trade and want instant gratification. If their own minds knew how to trade successfully, they’d already be there. Yet they still do what they want to, not what their training has taught them to do. Some of them don’t even go through any real organized training or online classes.
They don’t want to fill out their trade journals, or performance sheets, or study their past work. They just want to make money and they want it fast. Never in Michael’s mind was instant success or gratification. If it was, he would have never made it. He did everything he needed to become better at what he did and he never rested, nor asked others to think or work for him. He faced his fears of losing, of being a fool or wrong and went forward anyway. I think the reason why so many traders cannot wait for a trade to play itself out is fear – fear of the uncertainty. This is why they go for shorter trades or close it out because then its certain they know the outcome. They would rather be controlled by their fears than confront and digest them. I think newer traders worry about being careful or making a mistake thinking it means something about them, their intelligence or ability. If you have a long trading career, you will make thousands of mistakes. Stop trying to not to make any mistakes or losses and start trading.
In closing, I’d like to share one quote of Michael’s that I am constantly haunted and inspired by, one that I will never forget which he said at his Hall of Fame speech.
“One day you might look up, and see me playing the game at 50….oh don’t laugh (and here’s the part I will never forget), because limits, like fears, are often just an illusion.”
I hope this has been helpful to you and your trading process, and hope that Michael’s life, story, and example of what hard work can do, will also be an inspiration for you as it always will be for me.
Chris Capre
2ndskiestrading.com
Twitter; 2ndskiesforex
A Brief History
At the age of 14, Jesse Livermore began his trading career, although not as a trader. He was one of the young boys who would stand on a wooden plank in front of a chalkboard posting the quotes of prices for speculators. This was at the Paine Webber brokerage in Boston.
After about a year of this watching stock prices, noticing patterns, having hunches and checking to see how they did, he decided to make a move. Keep in mind he had no education in economics, business or finance. He came from a farming family and left at 14 to make a new life for himself.
He took his $5 in savings and made his first trade which he won. After trading for several months, at the age of 15 he had made $1,000 in winnings (about 20k today). By the age of 21, he went to New York with everything he had – $2,500. Keep in mind, just before this he was actually up about $10,000 so lost 75% of his stake just before heading to the Big Apple. How did he do in his first few hours of trading? Lost almost half his $2,500, in about 2hrs. He proceeded to lose the rest in a matter of days. He actually had to borrow money at that point to continue.
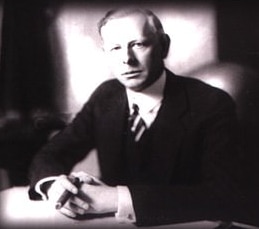
And continue he did, actually leaving Wall-Street to go make money where he knew he could, the bucketshops – places built specifically to help speculators lose money. He gained enough money to come back to Wall-Street, only to lose it again. He did this three times.
During the 1907 crash, he built up his wealth to $3million. He had done so shorting the market until a plea from a man named J.P. Morgan asked him to stop shorting the market as it may threaten the financial stability of the country.
He lost virtually all of this (90%) on a blown cotton trade and had to start over. He continued to lose money after this during the flat markets of 1908-1912, hitting a low of $1million in debt forcing him to declare bankruptcy. Remember this cotton trade as we will write about it in a later post.
Moving on to 1929, after slowly building up his stake again (after several losing periods as well), he made another big win shorting the market going into the crash. How big? To the tune of $100million dollars which would be worth billions in today’s value.
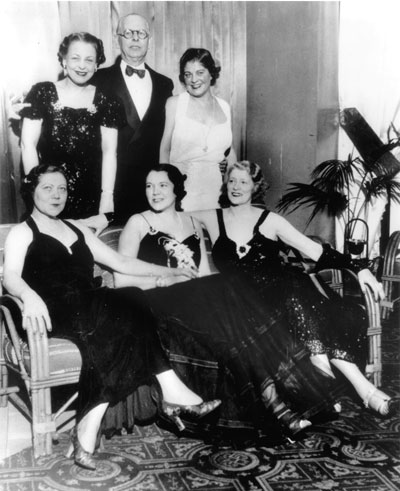
5 years later, FDR had created the SEC which caused the markets to take on a completely different character, something never before seen in the markets. How did this effect Jesse’s trading? He subsequently lost all of his $100million dollars. When he died a few years later in 1940, including all his trusts and assets, he had a net worth of about $5million ($95million less from his all time highs).
The Lessons
Now that you’ve had a brief history of one of the most amazing traders and stories of speculators across time, what were some of his crucial lessons he learned from trading?
1) Learning how to read price was a critical aspect of his trading, learning how to spot opportunities, notice price behavior for an underlying instrument, find opportune times to get in, etc. He spent the early days of his first year not trading, but watching, learning, observing and remembering price moves. No indicators, no computers, no charts. Nothing but pure price data and price action. He could spot key levels where the market was going to bounce, or break out, or start a trend or crash through a key level. But again, he learned this from hours and hours of observation of price behavior and price action.
He did not expect to get rich quick or cut corners. He worked and studied hard to develop his skills. One of his more famous quotes on the subject, “The game of speculation is the most fascinating game in the world. But it is not a game for the the mentally lazy, the person of inferior emotional balance, or the get-rich-quick adventurer. They will die poor.” from his book, ‘How to Trade Stocks‘
You would not believe how many people I run into asking me how they can make money fast, or 10% per month for the next year (when they cannot even be profitable now), or say they want to be a ‘professional trader’. Yet, they don’t fill out their trade journal, or do performance analysis on their systems or trading, or follow their trade plan, or work on their mental game, or spend time just studying the markets.
Jesse Livermore constantly filled in his trading journals and studied them endlessly, along with price movements and price action. When he went to Wall Street and failed the first time, he spent the next several years analyzing his system. It took him three times before he could return and be successful there. He also worked exceptionally hard at his risk management and did not expect to do 10% per month every month for the next year. He had no dreams or illusions about making fortunes. He simply looked for the best opportunities and traded them. And when he did, the money came.
2) Resiliency. If you were to put 100,000 traders through the wins and losses and all the experiences Jesse went through, probably less than a few % would see it through the end. He went through several divorces, actually asked his first wife to borrow money to keep trading which divided them forever. He traded in ‘bucketshops’ designed to take people’s money with no regulatory bodies in place to protect anyone. He had the poorest execution for the longest time and lost his entire stake over a dozen times.
Yet he always came back. He studied harder, refined his system further, made less mistakes & learned from his big losses. By eliminating most of his mistakes, getting more disciplined after each setback, sticking to his trading plan and constantly studying the markets, he came back with more vigor each time and greater successes, even after losing all his prior gains. It takes resiliency to trade the markets, mental, physical, spiritual (if you will), that in the face of losses, humiliation, being undisciplined and being flat out wrong, to pick up and try again. The best of all careers (and not just in trading) are marinated with characters of resiliency.
3) Getting ‘The Big Moves‘ or ‘Best Opportunities‘ Jesse Livermore was one of the few people to make money in both the 1907 and 1929 crashes. While tens of thousands were losing fortunes, he was making money and becoming exceptionally wealthy in the process. He was not married to any bias or view of the market (bullish or bearish). He read the price action and found the best opportunities when they came. He did not over-trade or expect to find exceptional trades every day. He was patient, sometimes not trading for an entire year until conditions were ripe. He noticed how people would get lured into markets that were not prime for making money and how often people lost during those times. His discipline and patience allowed him further to get him into the ‘Big Moves’ being short the markets going into the 1907 and 1929 crashes.
Imagine you are short the strongest stocks to date before the market makes a big move, and then starts to fall and your profits are increasing by multiples of 2, 3, 5, 10, 20 or 50x. Are you watching your profits in the ‘account balance’ window of your platform wondering when its going to reversethinking ‘I should just take my profits now‘? Or are you watching the two things you should be, the markets and your system, waiting for your exit signal.
By always keeping his eye on the markets and waiting for his signal telling him to exit, he was able to stay in the biggest moves of the decade and hold them until he got his signal (or was asked to stop selling the market so the financial system would collapse). Nothing was more important to him than keeping his eye on the target and the markets.
Dozens More…
These are just some of the most important lessons from his career and I could write about dozens more which I will share in later articles about one of the greatest traders of all time. Jesse Livermore and his trading career is someone I can read about time and time again and continually learn from (whether trading is good or challenging).
Perhaps you are profiting from these volatile times, or perhaps you are finding challenges in trading this unique environment. Hopefully you will benefit from these timeless lessons of Jesse Livermore’s career.
-May all good things for you increase.
Chris Capre
2ndskiestrading.com
Twitter; 2ndskiesforex
*For another great article on Trading Psychology, make sure to check out ‘The Pyramid of Trading‘
I have been getting a lot of comments, questions and emails about money management trading strategies as of late, with the market becoming very volatile.
This article will show you the most important math you will need to learn to have a long term money management strategy in place, which will put the mathematics in your favor.
Risk of Ruin
The Risk of Ruin is a statistical model which tells you the chances you will lose all of your account based upon your win/loss % and how much risk you put per trade. This is absolutely critical to know.
Case in point, lets say you are risking 10% of your capital per trade, and say have a 2:1 Reward to Risk Ratio or R:R, and have an accuracy rate of say 35%. Did you know you have a 60.8% chance you will lose all of your money?
Is this something you would want to know ahead of time? Lets hope so.
But first, we need to talk about its history and how we can adapt it to trading.
History of the Risk of Ruin Model
The mathematics of the Risk of Ruin tables were first applied to gambling.
In gambling, say blackjack, if you win a hand with the dealer busting, you get a 1-1 payout so if you put $100 on the hand, you will win $100. It helps to know this ahead of time so you can see if your edge (% chance you will win over time) is enough to make money or lose money.
However, here is the tricky part. In trading, we rarely know exactly how much we are going to make per trade.
We have a limit and a stop (hopefully) right off the bat so we are aware of our risk and potential profit. But here is the harbinger and some questions to consider;
- How many times have you actually closed a winning trade before hitting your full profit target?
- Do you have a trading system where the profit target is exactly the same (fixed amount of pips) and therefore you know what your exact payout will be if you hit the target?
- Do you know exactly how accurate you are going to be with your trading based on the system you use? In other words, have you modeled it so you can predict its overall accuracy within a few % each month?
If the answer to question 1 is around 25% or greater, then we will need to take this into serious consideration when calculating our risk of ruin.
If the answer to question 2 is no, then you will need to favor this in when calculating your risk of ruin.
If the answer to question 3 is no, then the answer is the same as above and its likely the mathematics are working completely against you.
Lets explore each question, then the math and then see what is a stable level of risk so you can keep your account growing.
Closing a Winning Trade Before Hitting Full Target
For those of you that are still learning how to trade consistently, be honest and ask a critical question:
How many times have you closed a winning trade before hitting the full target?
If what I hear from people learning how to trade is representative, the answer is likely “many”.
If you were perfect in your discipline and never made an error in trading and risk management, then I would say go ahead and risk 10% of your capital every time, if you could always trade with 40% accuracy and had a reward to risk ratio of 2:1.
If you did this, you would have only a 14.3% chance of losing all your capital and likely have a winning account.
However, if you cut your profit targets for whatever reason – say 50% of the time and you cut them in half, then with the same level of accuracy, your risk of ruin goes up to about 60%.
Meaning you have a 60% chance of losing all your capital.
This changes the game completely, and puts the mathematics heavily against you having a long trading career.
In fact, every time you shorten your original profit target, you stack the numbers against you.
Now ask yourself what is more likely…that you a) are shortening your profit targets or b) increasing them?
If you are shortening them, this means you have to decrease the amount of risk per trade to keep the same mathematical edge.
A trading system where the profit target is fixed every time (say 50pips)
How many of you are using this as your only method to trade the markets?
My guess is the answer is likely less than 10%, as most of you are probably not using just one system to trade the market, but several. Even if you were using one system, the chances are it does not have a fixed target.
The reason why having a fixed target gives you an edge (mathematically), is once you can stabilize the accuracy ratio, you can easily calculate your risk of ruin because your risk and reward are fixed from the outset. This makes the math very tidy.
However, having a fixed target may not always be advisable. Sometimes the market will go for a runner, so it helps to take advantage of those big moves when they come.
They increase the alpha (the rate of return on an instrument in excess of what would be predicted by an equilibrium model) on your returns, and help smooth out losing periods. For a full article on alpha, click here.
To give you a different picture, if your system is on average 50% accurate, your R:R ratios are 2:1, you should be making $1000 on every win and $500 on every loss.
After 10 trades you will have banked $2,500. However, if you have an alpha of 5%, you will make an extra $125 which over time adds up.
Regardless, if your system does not have a fixed profit target in pips, then you will want to reduce your risk % based upon keeping the mathematics more in your favor.
How Accurate Are You Going To Be?

Unless you have done massive forward and backtesting on your system, you will unlikely know the answer to this question.
On top of this, markets change and your accuracy levels will likely change with them. A question to ask yourself is;
Do you even know your current accuracy ratio for all your trades? Per Pair? Per System?
If you do not, then it is highly likely you will have the numbers stacked against you, and your chance of losing all your capital is more likely than you assume.
What this means is to be on the safe side, you will want to have a smaller amount of % equity at risk per trade. This also becomes more critical in the early stages of your trading where you are likely to make more mistakes, have a lower equity ratio and take profit before hitting your full target.
Now that we have gone over this, lets take a look at a table below using the Risk of Ruin formula.
risk_of_ruin = ((1 – Edge)/(1 + Edge)) ^ Capital_Units
| ROR % with 10% capital at risk | Payoff Ratio 1:1 | PR 2:1 | PR 3:1 | PR 4:1 | PR 5:1 |
| Win Ratio 25% | 100% | 100% | 99% | 30.30% | 16.20% |
| WR 30% | 100% | 100% | 27.70% | 10.20% | 6.00% |
| WR 35% | 100% | 60.80% | 8.20% | 3.60% | 2.30% |
| WR 40% | 100% | 14.30% | 2.50% | 1.30% | 0.80% |
| WR 45% | 100% | 3.30% | 0.80% | 0.40% | 0.30% |
| WR 50% | 99% | 0.80% | 0.20% | 0.10% | 0.10% |
| WR 55% | 13.20% | 0.20% | 0.10% | 0.10% | 0.00% |
| WR 60% | 1.70% | 0.00% | 0.00% | 0.00% | 0.00% |
| WR 65% | 0% | 0.00% | 0.00% | 0.00% | 0.00% |
| WR 75% | 0% | 0.00% | 0.00% | 0.00% | 0.00% |
| WR 80% | 0% | 0.00% | 0.00% | 0.00% | 0.00% |
Lets deconstruct this briefly.
Using 10% of capital at risk per trade, if you are 35% accurate and have an R:R ratio of 2:1, you have a 60.8% chance of losing all your capital.
However, if you can increase your edge (accuracy) by 5%, you only have a 14.3% chance of losing your entire account. This shows the power of increasing accuracy ratio to gain a greater edge.
Now, lets take the same accuracy ratio of 35% but increase the R:R to 3:1 from 2:1.
What this does is turn your 60.8% risk of ruin to 8.2% so in actuality, this gives you a tremendous edge.
Here is the challenge; in trading, it is actually harder to increase the profit target from 2:1 to 3:1 than it is to increase your accuracy ratio of 5%.
An increase of 5% in accuracy is not a big shift. 10-20% is a big shift and much harder to achieve. Over 100 trades, you only have to win 5 more or 1 in 20 more.
But to increase your profit target from say 100 pips to 150 becomes much harder, simply because you are trying to capture more of the days range.
This requires more precision in your entry, all to increase your bottom line edge by 6% from 14.30 risk of ruin to 8.2% risk of ruin. And if you are not hitting your full targets to begin with, does making your profit target larger seem more reasonable? Unlikely.
Now lets take the other side of this equation.
Lets say you are 35% accurate (not too demanding a figure) and have a 3:1 R:R. You will only have an 8.2% chance of losing all your capital.
However, if you are like virtually everyone else learning how to trade and you take profits early, say 50% of the time, how does this change the mathematics?
It turns your Risk of Ruin from 8.2% to 34%. So now you have a 3 in 10 chance of losing all your capital. Not bad but definitely less stable. This is assuming you are perfect in taking profits at 3:1 R:R 50% of the time and 50% at 2:1 R:R.
However, things happen and make it very difficult for us to be not only perfect in our discipline, but also perfect in our mathematics and R:R ratios.
It is simple if we are trading blackjack where we know the fixed profits we can make and lose. However, this is not blackjack – it is a fluid living breathing market and sometimes it would be advisable to exit early.
Does this increase your edge or reduce it?
More than likely, any adjustments to the system and R:R ratios decrease your edge, not increase them.
So what does this mean for you?
Risk less than 10% of your capital per trade. Risk a lot less. Put the edge so far in your favor that it is almost inconceivable you would lose all your capital.
If you have capital, you are in the game. If you don’t, you are out. Your capital is your ammo and without it, your dead in this game.
Especially when learning how to trade consistently, keep your risk low – like 2%.
Even when you are really good, keep it low because you will have losing periods and when you do, you want to absorb them well and not take big chunks out of your account. Risking 10% will do this but risking 2% will not.
Although it may not seem like you will make a lot of money risking 2% and having a 2:1 R:R, over time as your account grows, it will compound and you will take losses with ease of stride.
However, by risking 5-10%, you severely alter the mathematics and your edge. And far worse, you increase the psychological pressure to recover the losses and that actually compounds the emotional/mental energies against you.
As long as your R:R ratio is 2:1 or better, when you lose you will lose a little and when you win you win much more. Even if you take a series of losses, it will only take just as many wins to be back ahead.
Case in point; say you have a 10k account and have a 2:1 R:R and risk 2% per trade. Here is how the math works out below after a series of 3 losers and 3 winners:
10k with 1 loss at 2% = $200 loss and acct is at $9,800
$9,800 with 2nd loss at 2% = $196 loss and acct is at $9,604
$9,604 with 3rd loss at 2% = $192.08 and acct is at $9,411.92
So you lost 3 trades in a row and now win 3 trades, here is the tally:
$9,411.92 with 1st win at 4% gain (2:1 R:R ratio) = $376.47 and acct is at $9,788.39
$9,788.39 with 2nd win at 4% gain = $391.53 and acct is at $10,179.92
*thus after 2 trades you are back into profit.
$10,179.92 with 3rd win at 4% gain = $407.19 and acct is at $10,587.11
So even after two wins, you erased 3 losses and with the 3rd win you are way ahead.
Thus, hopefully you can see the importance of having a good R:R while having low risk.
It is psychologically hard to deal with big losses, but little losses have a much smaller impact on your emotions and trading, so keeping an edge both mathematically and psychologically is crucial to winning at this game.
For another great article on money management trading strategies, make sure to check out Your Equity Threshold and the Psychology of Money
I was recently reading some article on a very popular finance site whereby the person was talking about the stock market and today’s 376pt crash.
They were saying how it is not good for buy-and-hold investors, but it is good if you are using a dollar-cost-averaging strategy.
The funny thing is this term is totally misunderstood in context, history and is really used by rookies. You will never see a hedge-fund manager using this term, nor some ultra-high level investor.
When have you ever heard Warren Buffet, George Soros, Mark Faber or any other high roller using this term?
Never.
You know why? Cause its a joke.
The History of Dollar Cost Averaging
The term was first used in Chinese chop shops whereby they tried to goat people on to trading more when the prices were falling heavily. They would use the term ‘dollar-cost average’ trying to get you to buy again even though the price got hammered.
Why would they do that?
Because chop shops like theirs got paid in two ways;
1) by customers trading
2) by taking the other side of the trade
When the market crashes like they did today, people are totally afraid to buy and rightfully so. However, to keep the market busy, supported artificially with the dumb money, and make more money off of trading, people use the term ‘dollar-cost-average‘ like its some brilliant investment idea.  Think of how well a dollar cost averaging strategy worked on Bear Stearns, Lehman Bros. or a host of other companies that failed in 2008 or the dot.com bust.
It is the most rookie, insane and ridiculous idea that after something fell huge, we should buy it again. Why? Because it is cheaper? After a huge day of selling, unless it is sitting at some major support, who will want to buy it?
Dollar Cost Averaging is usually used by salespeople who usually work for a company like Prudential or Vanguard or whomever the company is, whereby, the person who is pushing it is usually selling a prescribed set of products which of course, they benefit from you investing in.
These are not traders in the market who live or die by them. They get a salary and a commission for how many of these products they sell you. Yeah, a dollar-cost-averaging strategy worked for Bank of America (BAC) when it dropped from the mid $40’s to about $4. Oh yeah, it worked again with Citigroup (C) which fell from the mid $20’s to about $3. Great strategy!
Bottom line is whenever you hear the term used by anyone, you know immediately they are just using it without any real understanding of the word, its history or significance. You know immediately they are a rookie and really do not have any clue as to what’s going on in the market.
Maybe this has little use for Forex traders, but you likely are going to run into this word or some investment ‘professional’ who uses this so understanding what it really means and where it comes from will help you in the future steer clear of that person.
In fact, any student of price action witnessing a market where people are saying, ‘dollar-cost-averaging’ would be selling the market and making money why others are buying it and getting killed the next day.
If you liked this forex dollar cost averaging article, make sure to comment below. For another great article on money and trading, make sure to check out Money Management and the Risk of Ruin
Trading Forex is in many aspects the same as trading any other instruments. However, there is one crucial way in which trading Forex is completely different than trading other markets. When you are trading any other instrument, you are trading a single instrument based upon its individual strength or weakness. However, in Forex you are trading two instruments or currencies which have their own individual strengths and weaknesses. Thus, the equation is a little more complex but actually makes it easier to find trading opportunities. Why? Because when we are trading currencies, we simply are looking for the greatest polarity between the strongest and weakest currencies. By trading a strong currency against a weak one, we greatly increase the chances the pair will move in our direction as long as we are buying the strong currency and selling the weak one. If you can analyze the price action and isolate the strong vs. weak performing currencies, then you can find some great price action trading setups. How to Find Strong vs. Weak Currencies? The method is actually quite simple. Since the USD is the most commonly traded currency (either as major or cross) we can see how individual currencies are performing against the greenback. Example #1 EUR vs. AUD If we look at the two charts below, we are seeing the daily charts of the Euro vs. the USD and the AUD vs. the USD. We can see how the EURUSD has been tumbling opening the year at 1.4330 and is currently sitting at 1.2300 shedding over 2000pips. 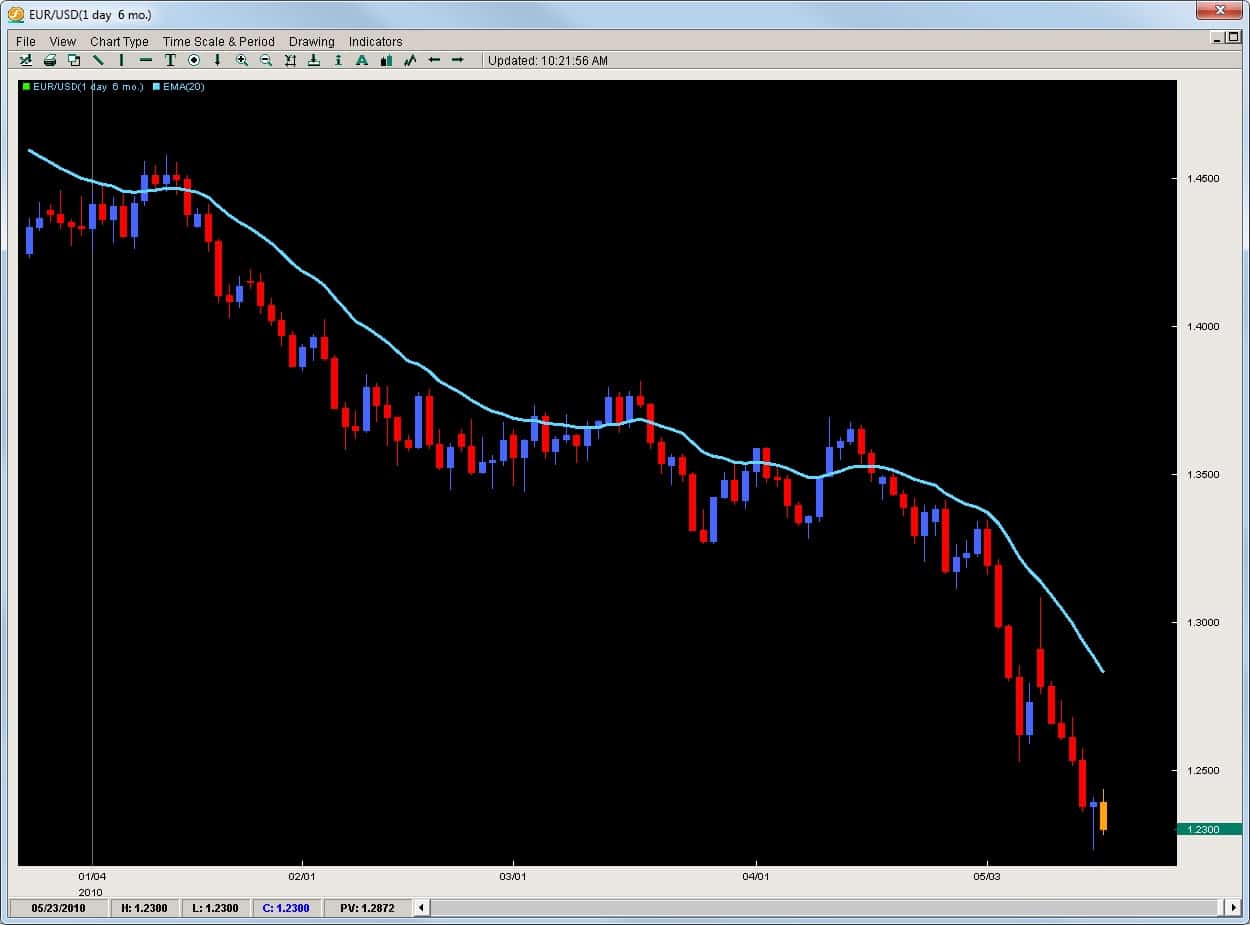 Contrast this with the AUDUSD which opened the year just under .9000 and has ranged currently only being down 300pips.
 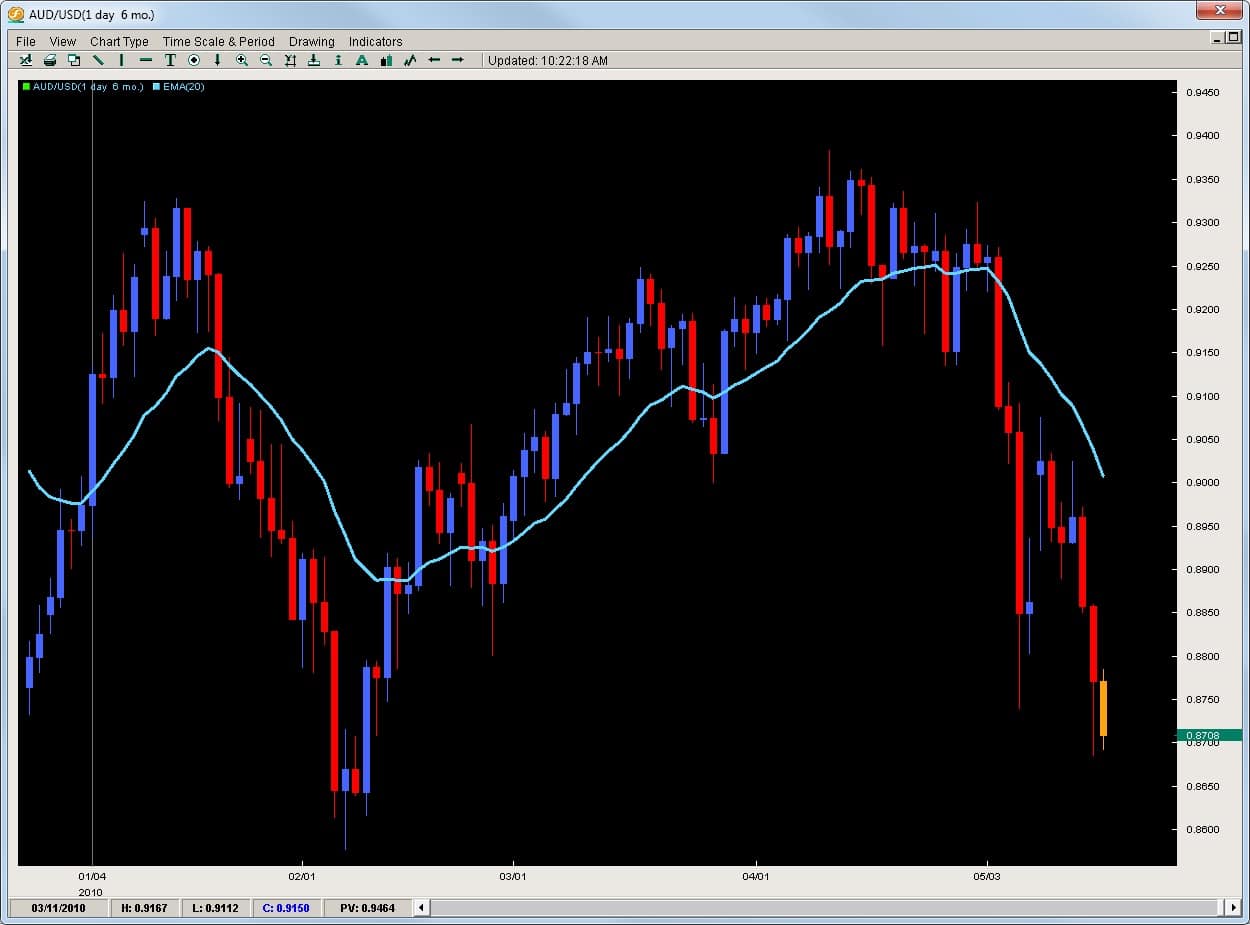 300 vs. 2000. Who is going to win this battle? The AUD will over the EUR. Thus, how does this lead to a trading opportunity for us? By buying the strong pair vs. the weak pair, or selling EURAUD. What does that chart look like? See below.
 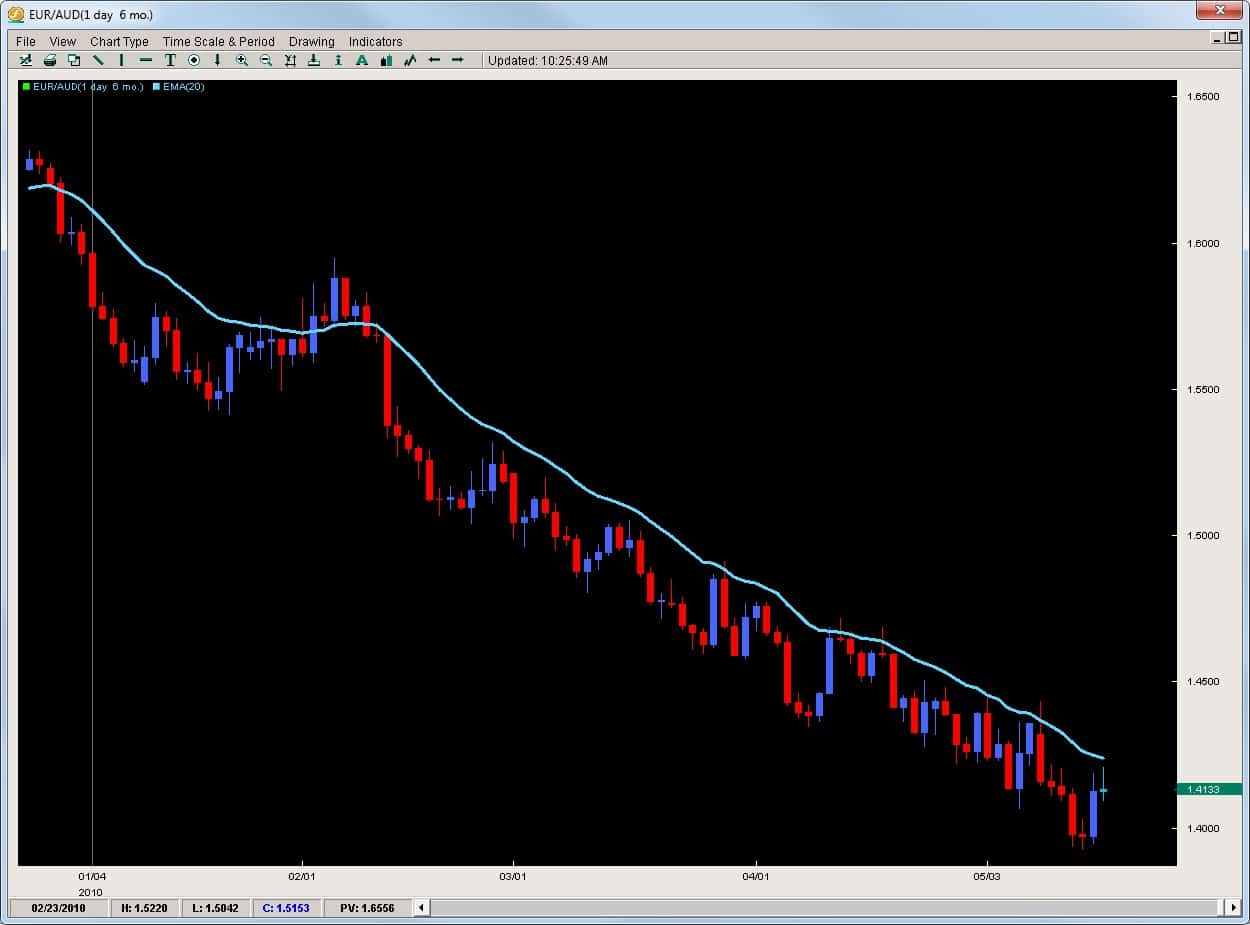 The EURAUD opened the year at 1.6000 and is currently sitting at 1.4130, shaving off 1870pips. Thus, trading does not always have to be complicated requiring lots of indicators to find good trades. By understanding how to read price action, determine impulsive vs. corrective moves and spot good formations, you can find great trading opportunities.
If you are serious about learning how to trade this market successfully, and find simple high-probability trades using pivots and price action only, you can check out the Trading Masterclass or the Advanced Ichimoku course which will teach you rule-based proprietary price action strategies and systems to trade these profitable setups.
One of the most challenging aspects for traders is finding and entry point into the market, particularly when looking for reversals or rejections. However this is not as complicated as it seems for there is a tool which is exceptional at helping traders find intraday entries for reversals – Pivot Points.
What are Pivot Points?
Originally created by floor traders, Pivot Points were simply used to mark key support and resistance levels based upon the previous High, Low and Close for the last day of price action. These three metrics were combined, then divided by 3 and this formed the Daily Pivot. The DP (daily pivot) was used to determine if the overall pressure for the day would likely be more down or up. If price opened above the DP, buying was generally preferred and vice versa if it opened below.
From the DP several other pivots were formed which were Resistance or R pivots and Support or S pivots. Finally, after becoming so popular they created Mid-Pivots which were simply the halfway point between any two pivots. Below are the calculations for the pivot point trading technique which we use:
DP = (H + L + C) /3
s1 = DP – (H – DP);//S1
s2 = DP – (H – L); //S2
s3 = L – (H – L); //S3
r1 = DP + (DP – L); //R1
r2 = DP + (H – L); //R2
r3 = H + (H – L); //R3
S1 = Support 1 pivot
S2 = Support 2
S3 = Support 3
R1 = Resistance 1 pivot
R2 = Resistance 2
R3 = Resistance 3
Here is what they look like on a chart below
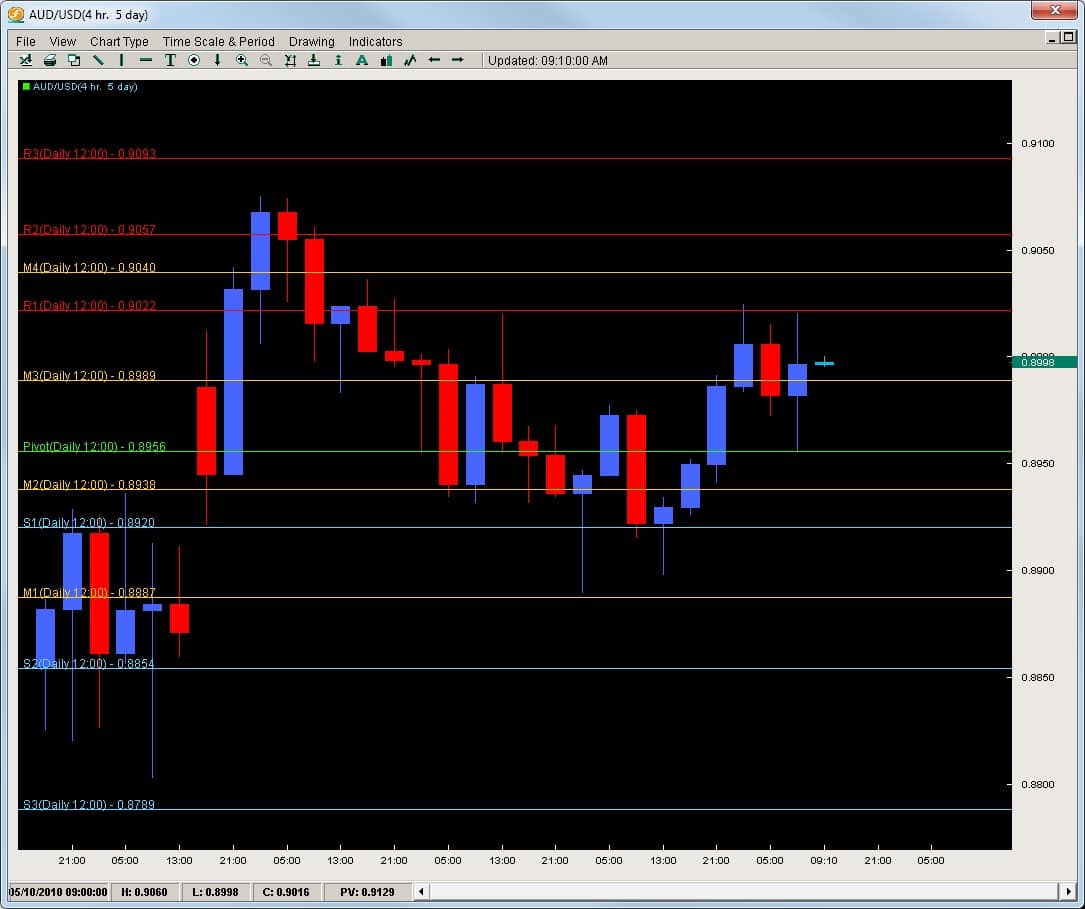
The blue colored lines are the support pivots and the red colored ones are resistance pivots while the yellow are the mid-pivots. As the name suggests, support pivots are the intraday support levels for that day while the resistance pivots offer key resistance price levels to watch for that day. We set our pivots to the London open since the London traders are basing their charts off their open and with the majority of traders coming out of London, we feel these will be the most effective and consistently watched by the institutional market.
The Statistics
The bottom line is price action has a greater chance to respond to a pivot level for that day than any other indicator out there. Our quantitative research done over the last 10 years suggests every 1hr candle from the London open to NY close has a 70+% chance of touching a pivot. Meaning, if you are going to be in a trade for more than 1hr, chances are the price will touch, react or respond to a pivot.
Since the institutional traders move the market, they are likely placing orders here on an intraday basis more than anything else.
How to use them for Reversals and Rejections?
To use forex pivot points for reversal entry or a rejection/reversal play, the first thing we need to do is find an existing trend or momentum play. If you read our article on Impulsive vs. Corrective moves in reading price action, you will be able to easily spot these.
EURCAD
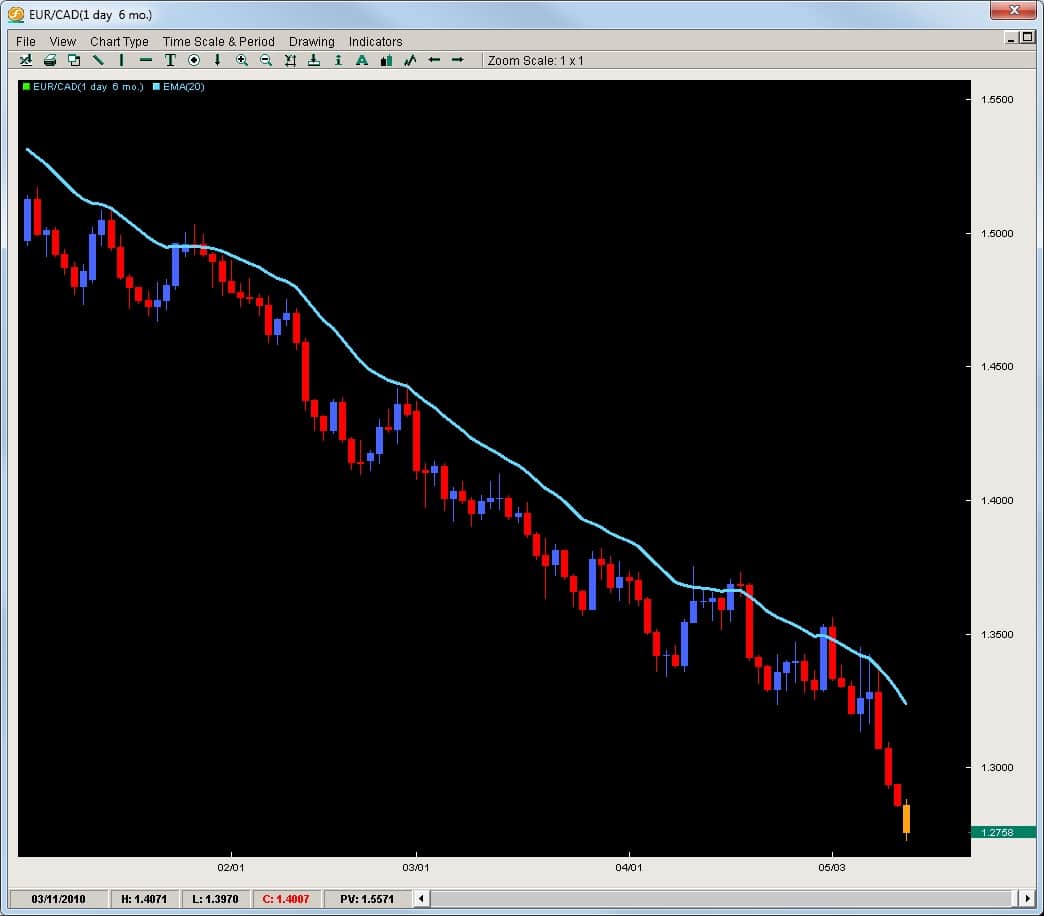
We will start with the EURCAD which on the daily chart below we can see is clearly in a downtrend.
Without needing a heavy IQ to see this is in a downtrend, we will look to take shorts on this pair. As you can see, the pair often pulls back giving us some intraday moves to get back into the trend at a higher price to sell it lower.
The Intraday charts and the Pivot Points
The best way to get into these trends is to find a pullback on an intraday chart, like the 30m, 1hr or 4hr charts. We will use the 30m chart or this example although the pivots should not change as long as you are on any intraday time frame. They should be the same for the entire 24hrs from London open to London open.
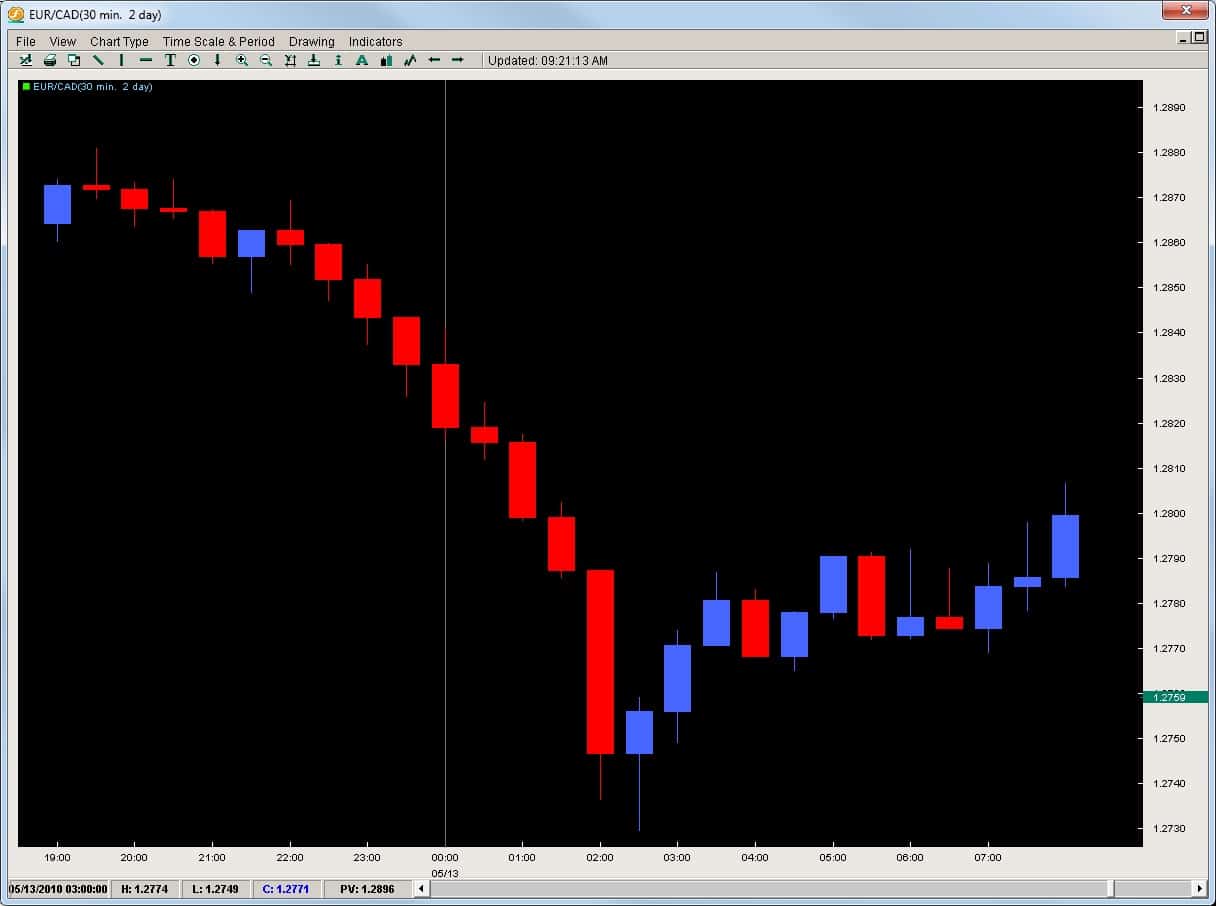
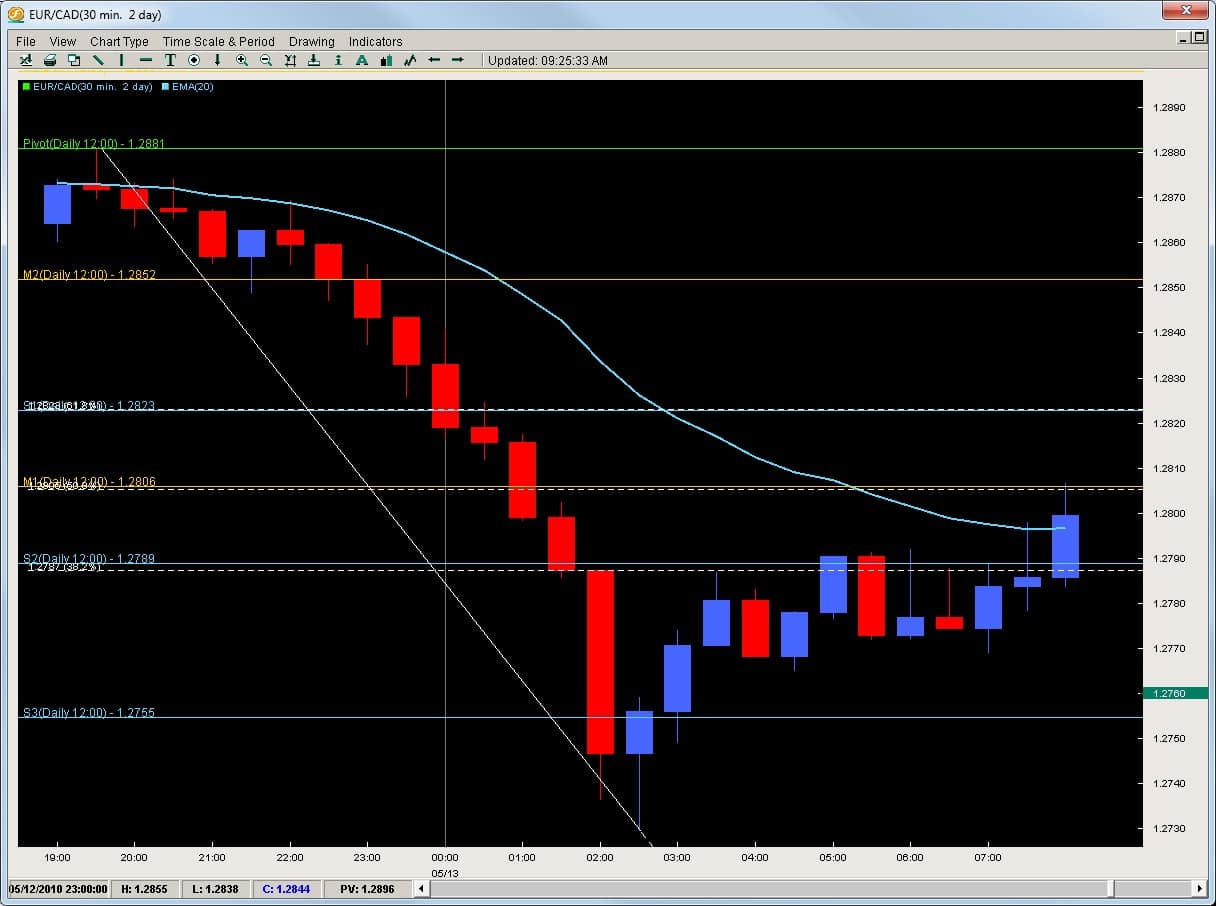
Looking at the EURCAD on the 30m chart below, the pair sold off aggressively and then formed a bounce. It gave a nice pullback which was not impulsive thus signaling the bulls had not come in with a domineering force. See chart below.
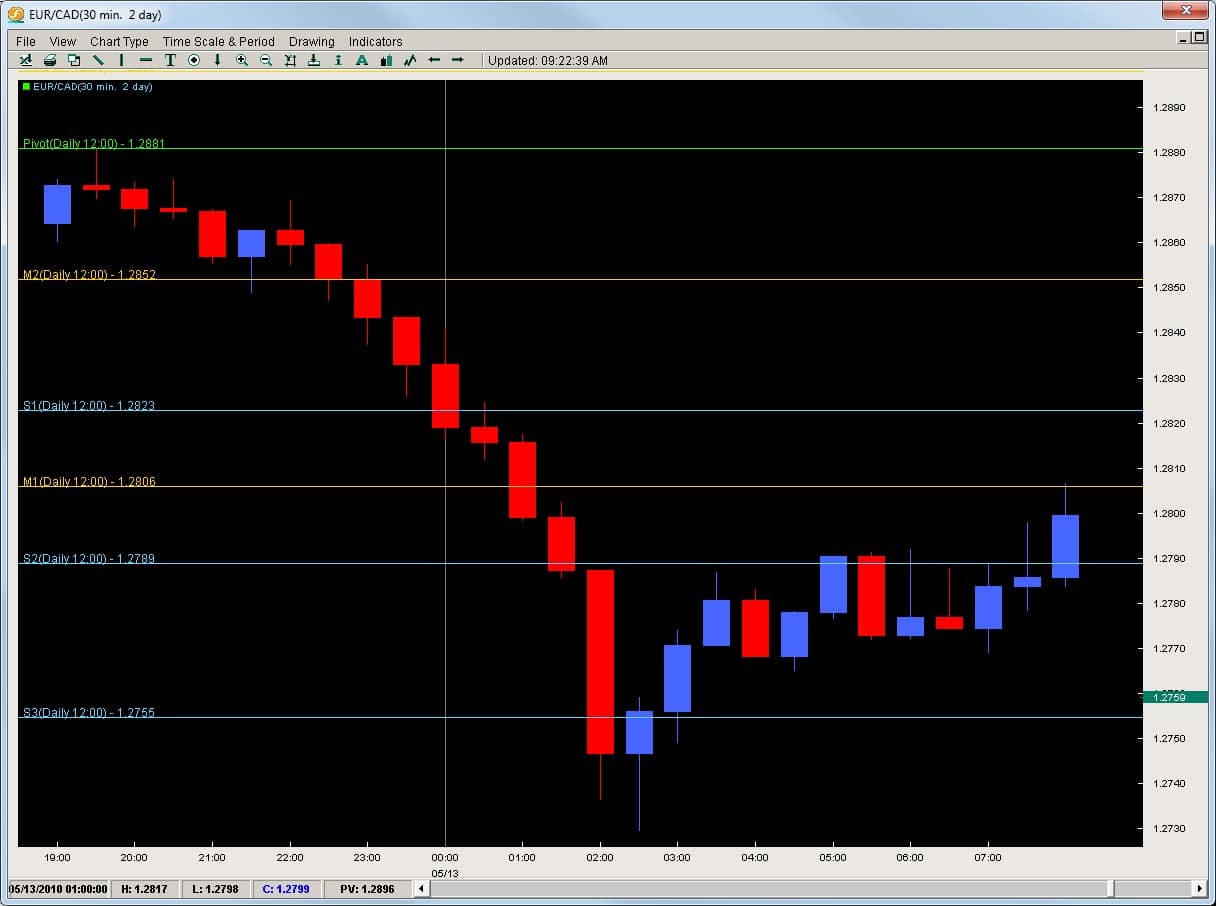
Now, noticing the move back up is not impulsive, we should be looking for a sell entry point to get into the market. The chart above was without pivots, but the chart below has the pivots on giving us a clear price level to get into the market.
Now we can see how after price reversed a little, it got stuck by the S2 pivot (2nd blue line to the bottom) which rejected price 5x before it broke. Price then advanced to where? The M1 Pivot.
Now pivots by themselves are potent and we can certainly use them for our entries to reject or get into a reversal. However, when we combine them with a 20ema or Fibonacci retracement, they become that much more powerful. Here is the chart below with both of them added onto the chart.
As you can see, they all come together right around the 1.2800 level which gives us a perfect location to get into the market. We could make the argument the Fibonacci levels were more important to the price action on the day, but before the sell-off ended, but until a trend is over, Fibonacci levels cannot be drawn. Hence, we can see how powerful a pivot trading strategy can be and how much price action responds to them since they were affective price before the trend ended and the Fibonacci levels were even drawn.
If you are serious about learning how to trade this market successfully and find simple high-probability trades using pivots and price action, you can check out our Trading Masterclass.
In the current environment with the Euro getting punished across the board against every major currency and likely even the Iraqi Dinar, as traders we want to be taking advantage of these environments by getting short and staying short. However, there are times when the short term moves day traders like to take advantage of in these strong sell-offs communicate something different that we do not want to keep adding on shorts to a current downtrend or move. This is often found two simple price action formations called the ‘Piercing‘ & ‘Outside‘ formations. We will go over both so you can recognize them, learn what they mean from a price action perspective and how to relate or trade them.
The Piercing Candle
This is a simple two candle setup that is probably best applied to nothing less than 1hr time frames and ideally higher. The higher you go, the stronger it will be. Below is a traditional example of a Piercing Candle.
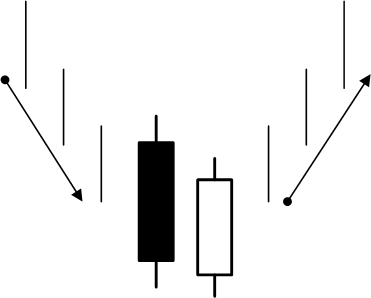
The way the formation works is we have to be in an established trend (either up or down). We will call this two candle formation an AB formation meaning there is an A candle (first) and a B candle (second). In this AB formation, the A candle is in the direction of the trend and is generally strong, one of the stronger or larger candles in the current trend. It could be large for two reasons;
1) Market is heavily participating in the trend
2) The market is giving one last push possibly before short covering (or long covering depending upon the direction of the trend) and taking profits
The institutionals usually like to give a really strong push before giving up a trend. An example of a piercing candle is in the chart below.
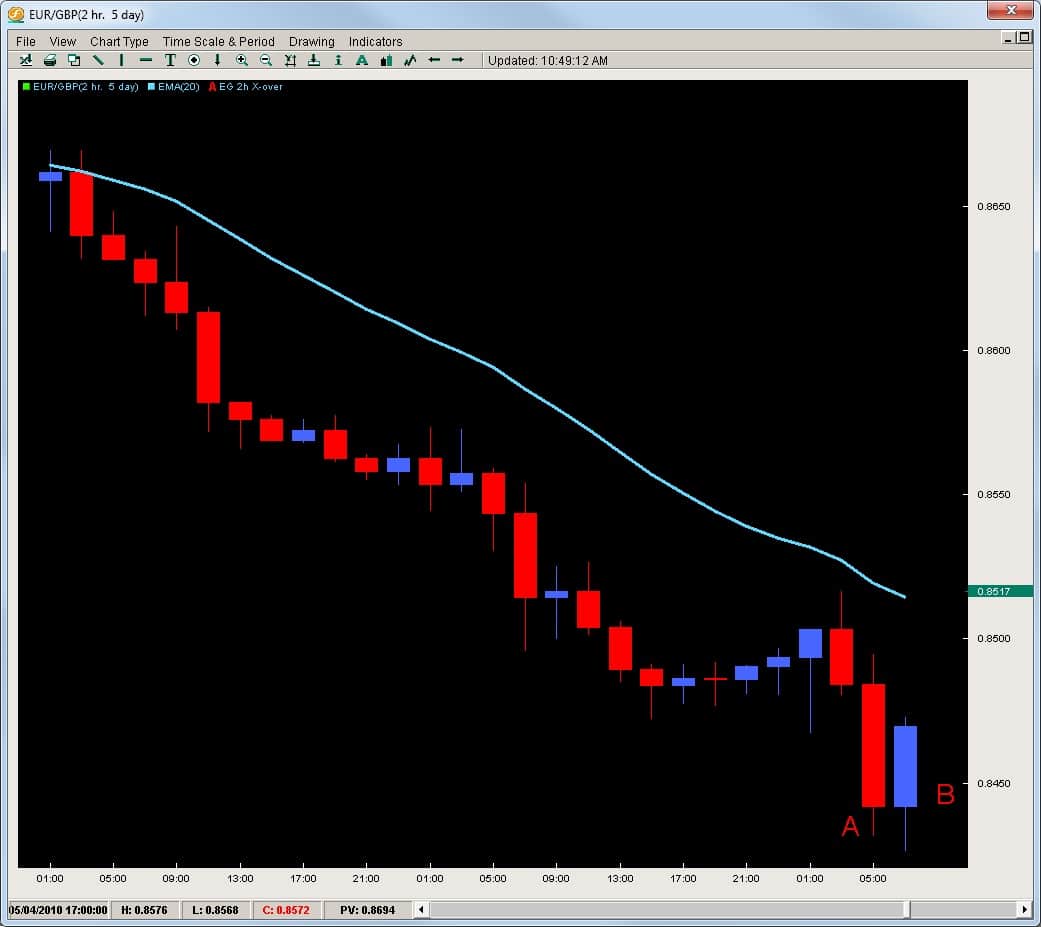
As you can see from the chart above, we clearly have a strong downtrend on the EURGBP. This is the 2hr chart and notice how at the end of the move, the A candle is quite large but is countered by a very strong blue candle. This AB formation meets the first two requirements being that;
a) we have to be in a clear trend and
b) the A candle has to be strong or large (ideally one of the larger ones in the move). We will address another reason why it helps for the A candle to be large soon.
Another requirement of the piercing formation is that the B candle ‘pierces’ a minimum of 50% into the previous candle. The more the better but it cannot engulf it which is another pattern. The max. it could pierce into the A candle is 99% for it to remain a piercing pattern.
Why is the 50% the line in the sand?
The reason why is anytime you have a strong downtrend, you have one side of the market clearly in control. For a really strong with-trend candle to be followed up and reversed minimally 50% or more by the next candle suggests it has the strength to counter the already existing momentum. This signifies strength to stop a moving force and reject it by 50% or more. Once it closes 50% or higher, it becomes a piercing pattern.
When we see these, its no longer a good idea to keep selling or trading in the direction of the trend until the coming reversal shows signs of weakening and the trend will likely resume. Below is the follow up candle to the AB piercing pattern.
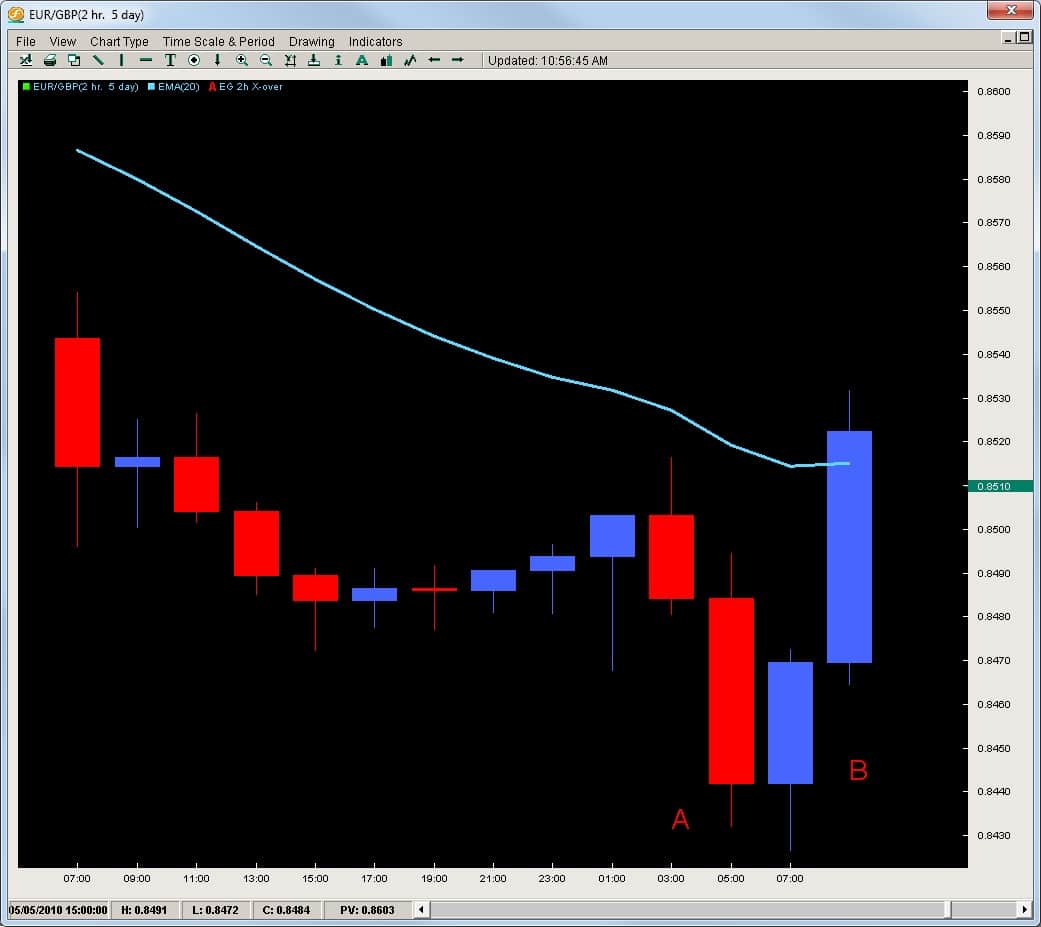
It is very common to see a strong follow up candle to a piercing pattern and this aids the price action context.
Thus, it is very good to be able to spot these patterns, especially if you are trading a strong downtrend and adding onto the position as it continues to advance. If you feel the trend is going to continue, one technique could be to wait for the pullback to reach a 20ema on the 2hr or 4hr time frame. If price stops here and then starts to reverse, then you can start to look for with-trend setups. You can also check out my article on the with-trend failure setups using the 20ema for another technique as well.
One other technique to get back in the trend is wait for a break of the lowest low or highest high from where the piercing formation was. A break of this level means whoever countered the trend has given up all the ground they made and are now losing money and the trend is likely to continue. Either way, being aware of these formations on the 1hr, 4hr, or daily time frames can alert you to take profits on your trend trades and wait for another setup.
Outside Reversal
This is another price action formation that you need to be aware of if you are trading trends and are wanting to know when to take profits and get out. Remember trends can go much farther than you think so having fixed targets or parameters for getting out of them is not always advised. It is better to wait for the price action context of the trend to communicate when the trend is ending before you get out and the Outside Reversal can sometimes paint this picture.
Taking a look at the same pair but on the 4hr time frame, we can see from the chart below the downtrend is met by a very large candle which engulfs or the price action is completely outside the previous candle. This formation is also an AB formation whereby the A candle is also like the piercing, a large candle, yet the B candles’ price action is ‘outside‘ meaning the wicks and ideally body of the B candle are both higher and lower then the highs and lows of the A candle. See chart below.
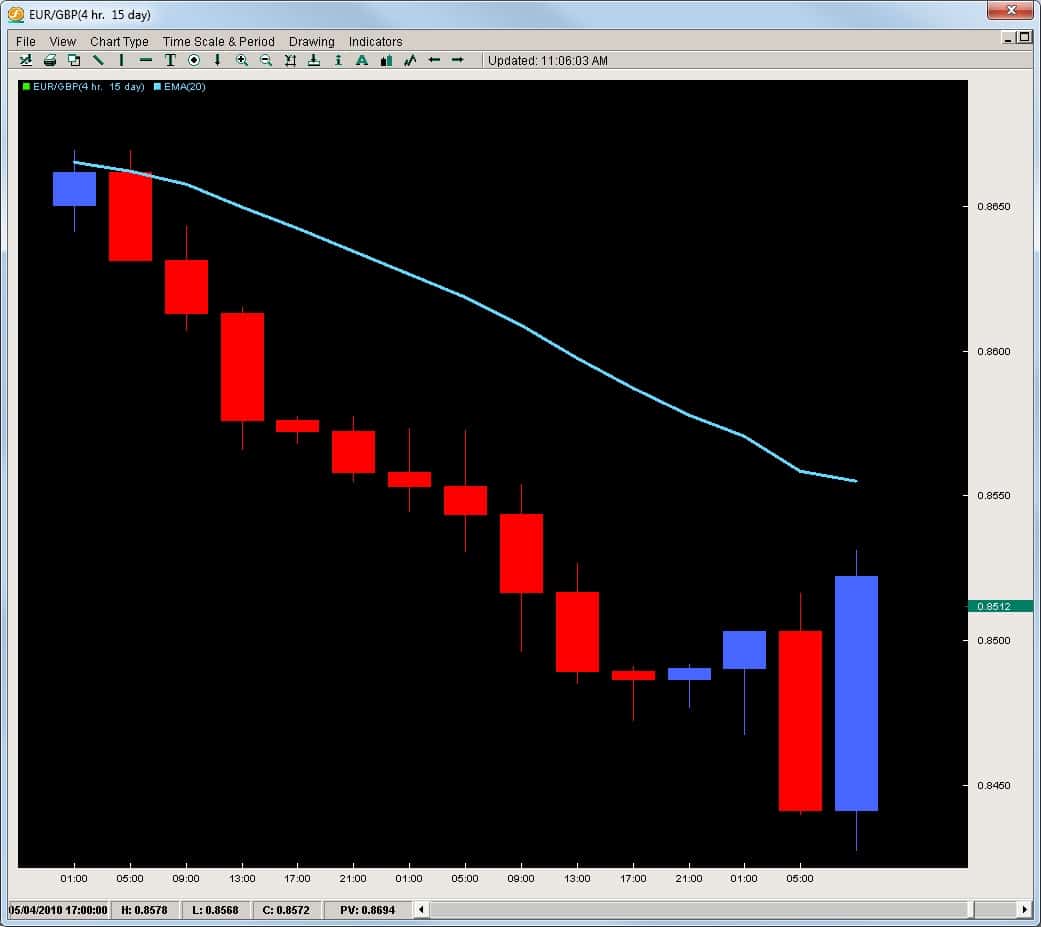
The same mentality applies with this and the piercing pattern, meaning when we see such a strong rejection without any hesitation, stalling, or bottoming formation, we have to pay serious attention to it and make sure to take profits when trading the trend and this formation shows up. Notice how the A candle at the end there is the largest in the last swing down, but is completely taken out by the B candle. To stop the trend momentum so forcefully and take out all the gains means the order flow changed hands real fast and control has been taken by the other side. We have to take profits on this and then wait for another setup to get back in the trend or look to see if its going to start a full on reversal of the trend.
Another example of this formation is in the chart below.
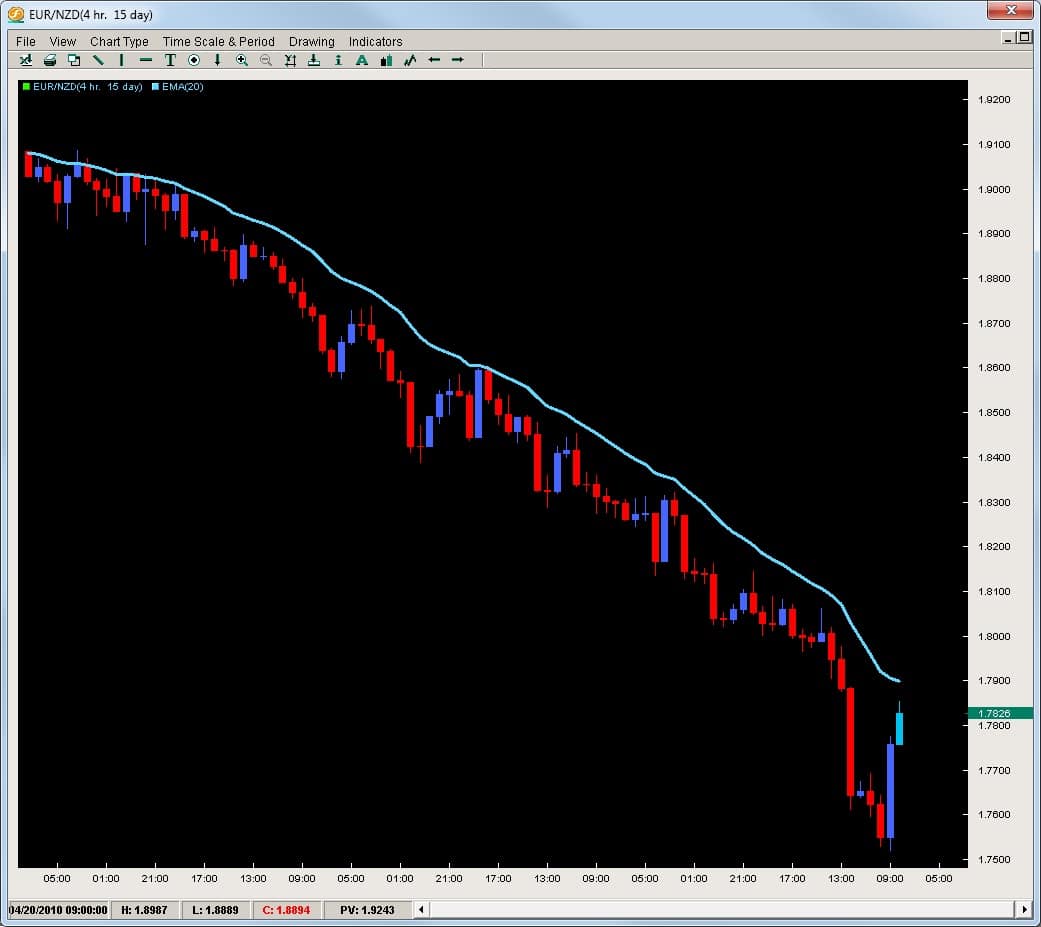
Look at how long this trend has been active with the euro losing 1700 pips to the kiwi. Then out of nowhere the pair reverses course with a huge outside formation and follows it up with another upcandle. All the other blue candles were not game changers for this trend, however this outside formation in two candle climbed 300+pips of the 1700 = 17.5% reversal of all the gains. You can bet any institutional traders short who just watched 17.5% of their gains get wiped out in 8hrs after being short for over 20days will take profits or even exit all together.
Thus it becomes critical to be able be aware of these and what they mean regarding the order flow behind them. This is crucial because environments like these where one currency (the euro) is suffering against everything across the board gives traders really good environments to make a lot of money in a concentrated period of time. These are times where the best traders like Jesse Livermore and Richard Wyckoff would die for and make large amounts of money just trading these environments. In some sense, it totally makes sense because the direction is easy to call and we just have to get in and stay in to make the money on these trends. Learning how to do this can often bring about a month or two worth of gains in a matter of a few trades. However, we have to be aware of the price action context which undermines these moves and tell us to take profits.
If you would like to learn more about price action forex piercing patterns and successful trading strategies, then check out our Trading Masterclass where you will learn high-probability rule-based systems to take advantage of such moves. If you want to learn how to get into trends and take 80% of the move, then check out our Advanced Ichimoku Course.

