Last year Nathan at winnerstradingedge.com wrote a brilliant piece which you can find here talking about Why Nial Fuller’s Method Doesn’t Work (referring specifically to his risk models).
In this article, he is responding to Nial’s claim that the superior forex risk management system is to risk a fixed dollar amount per trade. It should be noted Nial’s main claims were 1) a fixed dollar amount could get you out of a DD (drawdown) faster when winning, while 2) it would take longer to get out of the same DD if you used a fixed % equity model.
Nathan decides to demonstrate in two scenarios how a fixed % equity model is actually far superior. Nathan’s data shows clearly using a fixed dollar amount actually hurts you both in DDs (drawdowns) and during winning streaks.
I completely disagree with Nial Fuller and have always endorsed a fixed % equity risk model as being far superior. I will demonstrate this later with data and several scenarios. But first, onto Nathan’s results.
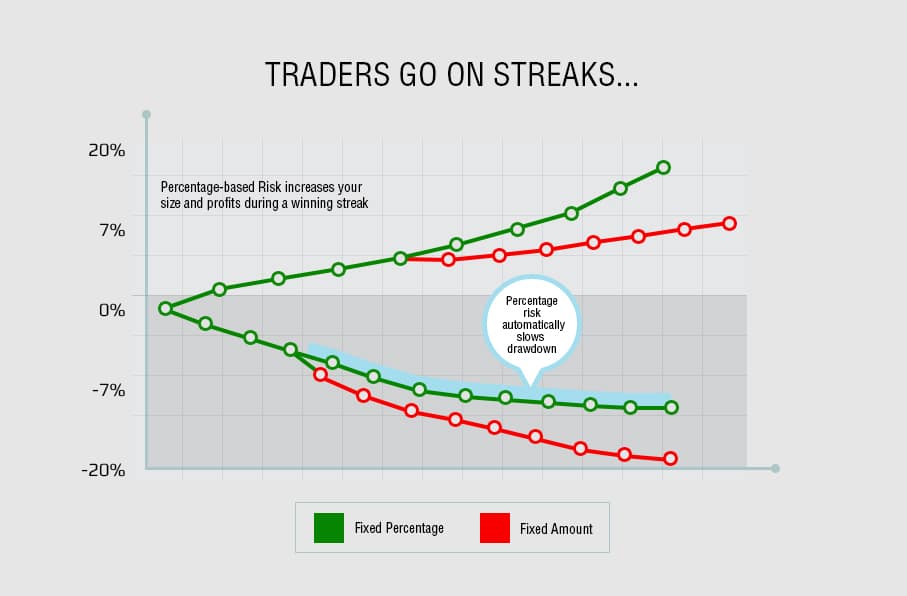
In this chart below, he shows two accounts each with the same starting balance of $10000. The two accounts were either using a 2% risk per trade method (representing the fixed % equity model) vs. the fixed dollar amount (risking $200 per trade each trade). Below is the graph showing the performance of the two models.
Nathan in his experience noticed how traders go on winning streaks. He thus tested two scenarios, whereby the traders go on either a 10 win-streak, or a 10-loss streak. The green line is our model (fixed equity % model). The red line is Nial’s model (the fixed dollar risk method).
During a winning streak, our fixed % equity model pulls away from Nial’s fixed dollar amount and continues to gain further as it goes on. This happens around trade 5 and continually separates further after each winning trade.
For the losing streak, our fixed % equity model again outperforms Nial’s, by losing less each trade, thus protecting your capital.
After Nathan published this data highlighting the differences, people on both sides disagreed. But nobody was providing any more data to back up either side. We at 2ndSkiesForex decided to run the numbers ourselves and further demonstrate how a fixed % equity model was far superior.
The first forex risk scenario we looked at was a 10 win trade recovery after the 10 loss series Nathan presented above. Here is how the data plays out below.
After 10 losses, Trader A goes on to win the next 10 using the fixed % model:
-As per the chart above, Trader A has a balance of $8171 at trade 10. This continues below-
$8334.42 at trade 11
$8501.10 at trade 12
$8671.12 at trade 13
$8844.54 at trade 14
$9021.43 at trade 15
$9201.85 at trade 16
$9385.88 at trade 17
$9573.99 at trade 18
$9765.06 at trade 19
$9960.36 at trade 20 for fixed 2% rule
After After 10 losses, Trader B goes on to win the next 10 using the fixed % model:
-As per the chart above, Trader B has a balance of $8000 at trade 10
-Since the math is easy, at trade 20 Trader B has a balance of $10000, for a whopping .4% difference.
Now in comparing the numbers as a whole over these last three scenarios, lets look at the following three facts:
1) During the first 10 win UD (updraw), you get +1.58% BETTER performance (more upside) using a fixed % model
2) During a 10 loss DD (drawdown), you get +1.71% BETTER performance (or lesser DD) using a fixed % model
3) During the next 10 win UD (updraw) you get -.4% LESSER performance (or lesser gains) using a fixed % model
So in two out of the three forex risk scenarios above, the fixed % equity model outperforms the fixed dollar amount. The total edge is +2.89% over the fixed dollar amount using the fixed % equity method.
But lets take this a few steps further and lay out the other 4 scenarios from here to see which performs better. They are;
Scenario 1 = 10 more straight wins from trade 20
Scenario 2 = 5 more straight wins from trade 20
Scenario 3 = 5 more straight losses from trade 20
Scenario 4 = 10 more straight losses from trade 20
Scenario #1: (10 more straight wins from Trade 20, or T20)
Trader A Balance = $9960.36
Trader B Balance = $10000
After 10 more trades (T21-T30), the fixed 2% model will have a balance of $12143 while the fixed dollar model will have a balance of $12,000. Summed up, the fixed % model has $143 MORE in profit, or a 1.2% GREATER gain. Hence the fixed % model wins this scenario.
Scenario #2 (5 more straight wins from trade 20)
Trader A Balance = $9960.36
Trader B Balance = $10000
After T25 (or 5 more straight wins), fixed 2% model has a balance of $10998.69 while the fixed dollar amount has a balance of $11,000, or a whopping $1.31 more, which is only a .01% gain over the fixed % model. Pretty weak difference. But a win nonetheless for the fixed dollar model.
Scenario#3: (5 more straight losses from trade 20)
Trader A Balance = $9960.36
Trader B Balance = $10000
By T25, the fixed % model has a balance of $9002.78, while the fixed dollar amount has a balance of $9000. Summed up, the fixed % model has $2.78 MORE in profit, or a .03% gain over the fixed dollar amount. A small difference, but nonetheless a win for the fixed % model.
Obviously from here the answer gets much uglier for the fixed dollar amount model as this progresses, but here are the numbers below.
Scenario #4: (10 more straight losses from trade 20)
Trader A Balance = $9960.36
Trader B Balance = $10000
By T30, the fixed % amount has a balance of $8136.84, while the fixed dollar amount has a balance of $8000. So the fixed % model has $136.84 MORE in capital, or a 1.7% gain over the fixed dollar amount.
When you tally up the 2 scenarios by Nathan, plus the 4 we just ran, the score is 5-1 with the fixed % equity model being the far superior model.
Here are the numbers and scenarios summarized below;
Scenario A (Nathan’s scenario – 10 wins from 10k) = +1.58% better performance for fixed % equity model
Scenario B (Nathan’s scenario -10 losses from 10k) = +1.71% better performance for fixed % equity model
Scenario 1 (as per my description above) = +1.2% better performance for fixed % equity model
Scenario 2 (as per my description above) = -.01% worse performance for fixed % equity model
Scenario 3 (as per my description above) = +.03% better performance for fixed % equity model
Scenario 4 (as per my description above) = +1.7% better performance for fixed % equity model
This comes out to a grand total +6.21% better performance for the fixed % equity model across 6 scenarios.
Translation
This shows a huge advantage using the fixed % equity forex risk management model which is clearly far superior to the fixed dollar amount method. This is only across 20-30 trades using any one scenario above. The more trades this gets applied to, the better the performance. Over a traders lifetime of 500, 1000, or 5000+ trades, this edge becomes exponentially superior.
Keep in mind, you cannot do any risk of ruin calculations using a fixed dollar amount, however you can using our % equity model. Anyone using Nial’s fixed dollar model is simply throwing money away over time.
This should end the debate between which forex risk management system is the better model. Clearly the fixed % equity forex risk management model wins by a Mortal Kombat Fatality.
I would like to state I am welcome to see evidence to the contrary if/when it is presented, as I am totally open to seeing it.
Make sure to share this “how much to risk per trade” article as it discusses a critical topic for your trading. But more importantly – leave a comment whether you agree or disagree, and why.

