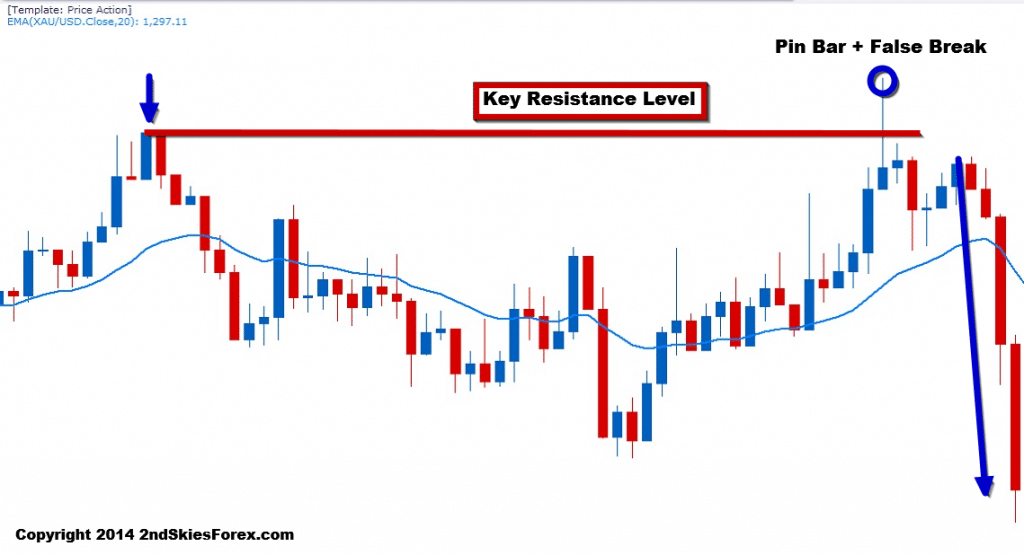
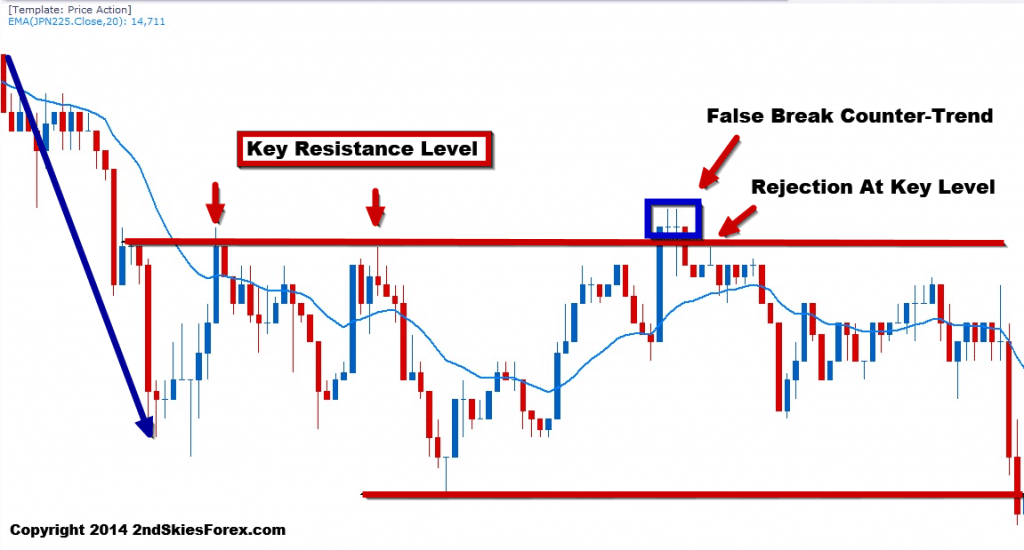
trading quiz on price action trading

In my Price Action Course, I am often sharing my personal live trades, using them as a learning experience for the private members.

My goal is to help them learn price action, so one of the methods I will employ to help them with this is create trading quizzes.

Today I want to share one of those forex trade quizzes on an actual live trade setup I took.

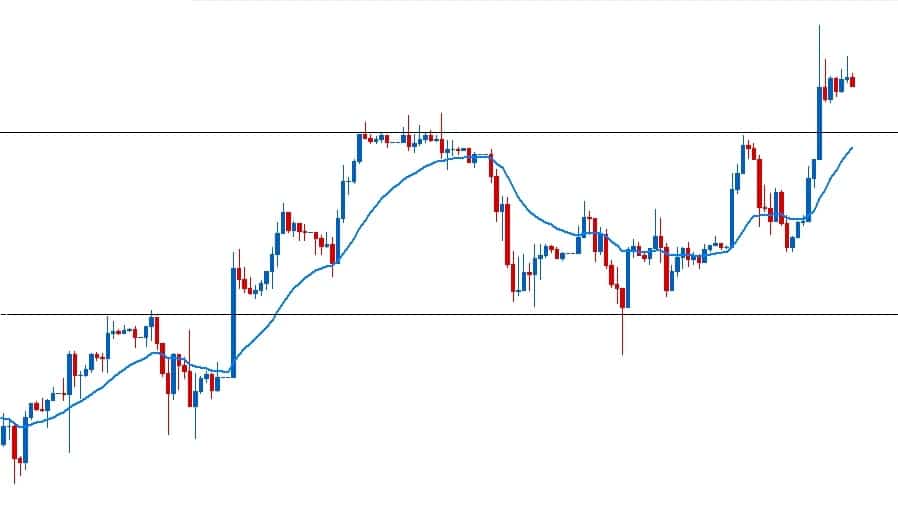
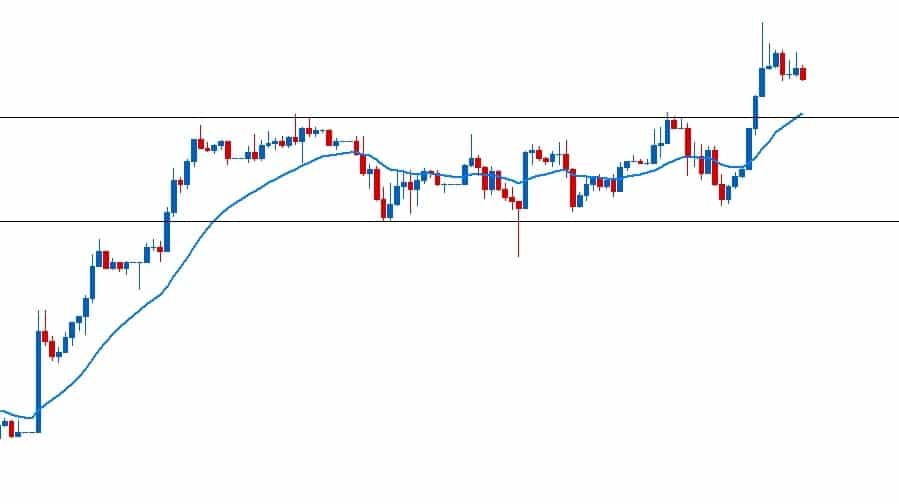
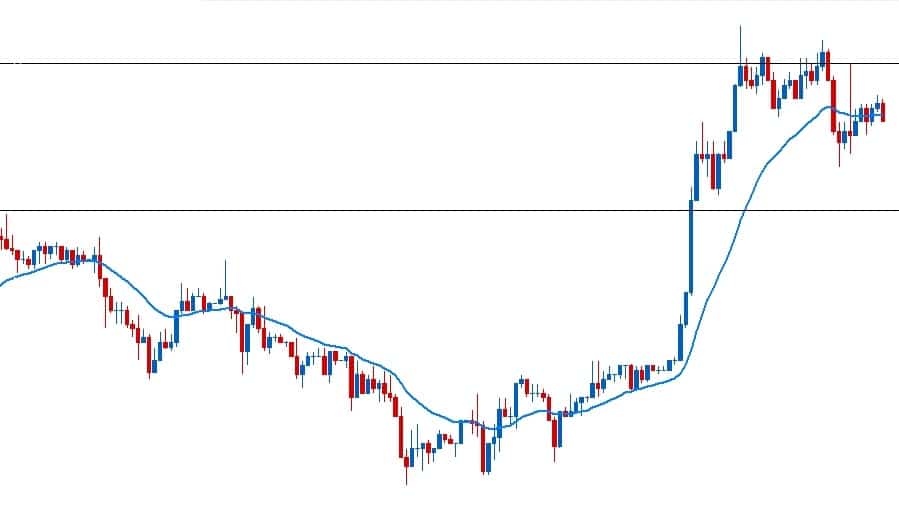
Before taking the trade, I was looking at 3 different charts, so I took screenshots of each chart I was considering trading.

I will often do this when reviewing my trades at the end of the week, or examining the price action to increase my pattern recognition skills.

If you want to learn price action and how to trade it, that learning process must come from many sources – not just trading or watching videos.

The Trading Quiz

Below are three charts, all of which I was considering trading last week. Each one presented opportunities, both trading with the trend, some counter-trend, while others both long and short.

For this price action forex quiz, examine each chart in detail. Look at the overall price action context and structure. Some are offering with trend setups, some are offering counter-trend setups, and some are offering both (or none at all).

Your job is to decide which ones to trade, where, and how.

Hence your answers are the three possibilities:

a) Trade With Trend
b) Trade Counter Trend
c) No Trade

For each trade, fill in your answer (using a, b or c for each chart), what you see in the price action, and why you will take this trade. You can choose A and B as appropriate answers.

This is a great opportunity to see how well you understand price action, how well you can spot with trend or counter-trend setups, & what opportunities you can find in the charts.

There will be no prices marked, nor will I tell you what instruments they are (so you cannot cheat :-). I did however mark some key support and resistance levels I am looking at to give you some small hints.
But by and large, this is just pure price action trading and analysis.

Here we go.

Price Action Chart #1

price action chart #1

Price Action Chart #2

price action chart #2

Price Action Chart #3

price action chart #3

Your Quiz:

In the comments section below, fill out your answers. You can list the name of the trade (Price Action Chart #1, 2, or 3). Then provide your answer (a, b or c). And lastly, explain the reasons for your trade setups and why.

Then I will respond with a follow up article what live trade setups I took, sharing my exact entry / exit points, and what I was reading in the price action.

Now try to answer each one using your current trading skill set. The winner with the best answer (most detailed, complete and closest to mine) will get a $50 discount on any one of my forex trading education courses. I will announce the winner with the next article.

Good luck and I look forward to your answers.

The World Cup ended a few days ago with Germany hoisting the trophy. Some are speculating this Germany may be the best national team ever.
aggregation of marginal gains german wins world cup 2ndskiesforex
Such a statement will be argued across bar tables and countries for years to come. Regardless, below are a few amazing facts about Die Mannschaft winning the World Cup;
1) No European team in 6 prior attempts had won the WC in Latin America
2) Their goal differential (difference between goals scored vs. goals allowed) was tied for the best ever at +14, scoring 18 goals, allowing only 4 in 7 games.
3) They finished the WC with the highest ELO rating for a WC champion ever (source: Nate Silver)
There is more, but they won without having any major superstars like Messi, Ronaldo, or Neymar.
How did they do it?
The answer is a method known as The Aggregation of Marginal Gains. This is a strategy for improving performance in any sport, skill or performance based endeavor (i.e. trading). This method is the offspring of Dave Brailsford, the General Manager for Team Sky (Great Britain’s professional cycling team), who has helped British cycling become dominant since 2010.
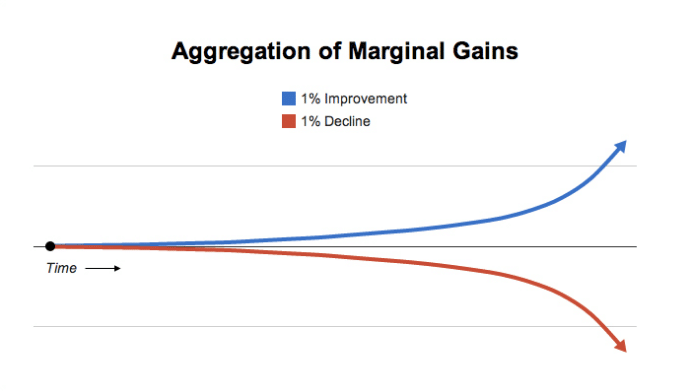
The idea is simple – find and improve as many areas of your discipline as possible by 1%. If you add up those small gains, it will lead to a dramatic improvement in performance.
How did the Germans utilize this method to win the 2014 World Cup? They employed 40 sports scientists to look at every aspect of the game. Their mission was clear – find the smallest advantages wherever they existed. Putting this into context, while they had 40 sport scientists, Brasil had 2. Below are just some of the 1% marginal gains they produced.
1) Climate Trends – they analyzed various tropical climate trends in relationship to player performance and reduce the risk of injuries.
2) Alpine Training – before the WC, they had a 10 day preparation camp in an isolated village in the Italian Alps, 1,000 meters above sea level. Training at this altitude helps to increase the production of oxygen-carrying red blood cells – thus increasing stamina.
3) Base in Porto Seguro – 1 year before the WC started, they build a 60 room base helping them adjust to the tropical conditions more easily. The German climate is far from anything resembling ‘tropical’. Most teams booked hotels in the south of Brasil where it was much cooler, thus making it harder to adapt.
There is more, but you get the key point – they prepared in every way possible giving them the edge available.
If I’m correct, many teams and nations will be studying their methods to improve their respective programs.
An Edge in Trading
In trading, most tend to think of their ‘edge‘ housed only in their strategy. That would be a rookie mistake.
Your trading mindset is an edge, your risk management is an edge, your trade management is an edge, your training method is an edge, your preparation is an edge, your trading plan is an edge, your spreads are an edge, etc. There are certainly more, but create a 1% increase in any or all of these, and the aggregation adds up to a huge shift in performance. That difference could be the gap or cleft between you losing money like you are now, and making money consistently.
The Slightest of Edges
In trading, the difference between losing and being flat is often marginal. Sometimes just a few small shifts in your trading can bridge the gap. The same goes for moving from break-even to profitability. Just increasing your accuracy alone by a few % can mean the difference between having no edge, and making money consistently.
Just even using the fixed % model vs. the fixed dollar amount will improve performance as we’ve demonstrated before. Below is a great chart just showing one of the ways the fixed % model is superior in performance.
fixed-percent-equity-risk-model-superior-than-fixed-dollar-amount-graph-1-2ndskiesforex
Another great example is housed in your risk management. Using the risk of ruin formula, imagine you are a trader who can consistently get a 1:1 reward to risk ratio with your price action strategy. If you are 50% accurate with this R:R ratio, you are losing money. Increase your accuracy to 55%, and now your system makes money (assuming you have a manageable spread).
NOTE: I have a FREE Risk of Ruin Calculator which you can use by clicking on the link.
Edge In the Spread
Coming back to the spread, if your current markup on the GBPUSD pair is 1.5 pips, and you can reduce that to just 1.4 pips, a .1 pip decrease in your spread may not look like much, but take a long view and see what happens.
I have been trading for 14+ years now. Let’s use a low number assuming I make 20 trades per month trading 11 months per year.
14 years x 11 months = 154 months of trading 
At 20 trades per month, I would have executed 3080 trades
A .1 pip increase = a +308 pip gain 
At 10 standard lots per trade, we are talking $100 per pip 
At $100 per pip, we are talking a difference of $30,800 profit, all from a .1 pip improvement in my spread!
Can you see the power of how one small gain leads to a big increase in performance?
Now imagine making 5, 10 or 100 of such gains. By using the aggregation of marginal gains method, you can create small gains which lead to huge improvements in performance. Such gains can be the difference from losing money, to breaking even. or breaking even to making money month after month.
Below is a fantastic graphic how a 1% increase in performance over time will affect your outcome (source: Jeff Olsen).
aggregation of marginal gains in forex trading chris capre 2ndskiesforex
 
Edges To Be Found in Trading
In trading, every edge counts, which is why you have to take time to really dig into your trading system and method. Such analysis can turn a barely profitable trader into a highly successful one. My top students have all dug deep into every aspect of their trading, and this is why many of them would outperform 95% of all traders on the planet.
Below is a list of some possible edges you can find in your trading:
1) Improving your entries – Are you using optimal entries, or sub-optimal?
2) Decreasing Stop Size – Take a trade setup with an 80 pip stop & 120 pip target (1.5 R:R). Now reduce the stop by 10 pips. Your R:R increases from +1.5R to +1.85R (23% increase), all from tightening your stop by 10 pips.
3) Trade Management – is a trailing stop kicking your out too early, or helping you lock in the maximum amount of gains?
4) Time Stops – are you holding your trade for days, maybe weeks on end for a simple 1R gain? Or could your capital, time and mind be used for trades with higher R and a quicker return?
5) The instrument you are trading – Perhaps you can make a little money with one pair, but testing the system on another pair shows a big increase in performance.
6) Reducing your spread – perhaps you can get equal performance in terms of accuracy and R:R ratios in a lower spread instrument.
7) Time of Day – Are you trading intra-day? Perhaps trading during more ideal times for your system could increase profitability.
8) Risk of Ruin – do you even know your risk of ruin, or the mathematical probability you will make (or lose) money? Knowing your RoR can mean the difference between losing and making money every month.
9) Your Trading Mindset – maybe your strategy makes money consistently, but you use it improperly, or don’t pull the trigger when you get a prime setup. Your trading mindset could either keep you focused on process, or constantly worrying about that big loss you just took. Ask yourself what edge do you have in your mindset, and how do you work to improve this.
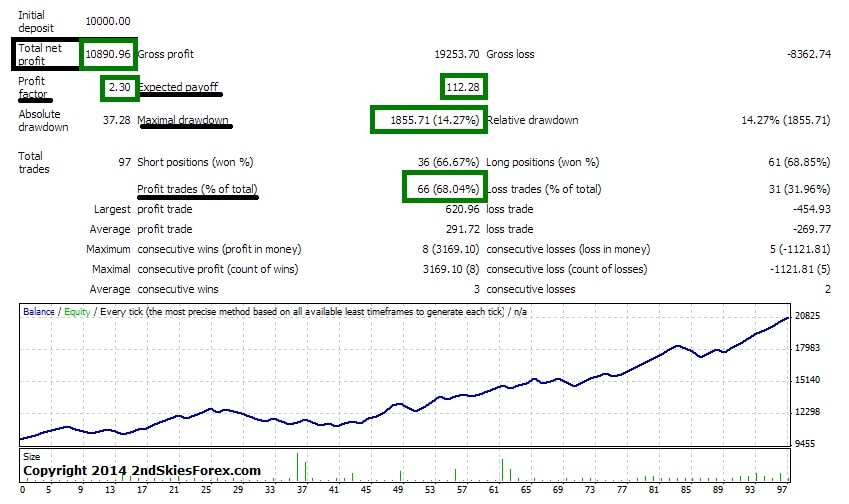
10) Trading Strategy – does your trading strategy have an edge? Below is a strategy from our Price Action Course on just one pair and one time frame, including the performance data gaining +108% over 97 trades risking only 2% per trade.
total-performance-profitable-strategy-2ndskiesforex-price-action
In Closing
The aggregation of marginal gains is a powerful method that can be applied to trading, sport or any skill based endeavor. The training in the alps did not win Germany the World Cup. Nor did the base they built in Porto Seguro. Nor did the analysis on climate trends and player performance. But adding them all together, alongside with their futbol system, training, teamwork, and a focus on the details, it all added up to a winning advantage, setting records and making history.
Now that you’ve seen the power of making small gains in your trading and how it can affect performance, ask yourself what can you look at to give yourself a better edge? Where can you make small gains, and what details are you missing?
Along those lines, what other edges do you think could be useful to improve trader performance?
Please make sure to share your ideas, comments and suggestions, and what you have used to increase your performance.

By now we have fully entered the summer trading months which are traditionally slower to begin with. When you combine the summer + the lack of ‘flow information‘ shared by bank traders under investigation, you have an environment of lesser volatility, smaller moves, and more false break setups.

With that being said, how can we maximize our time, while still remaining active and consistently profiting? Below is a mini how-to-guide for summer forex currency trading.

In this article, I will share 2 simple tips to help you trade pairs with stable volatility, larger moves, and also remain active during the slower summer months.

Summer Forex Currency Trading Tip #1: Switching Pairs & Instruments
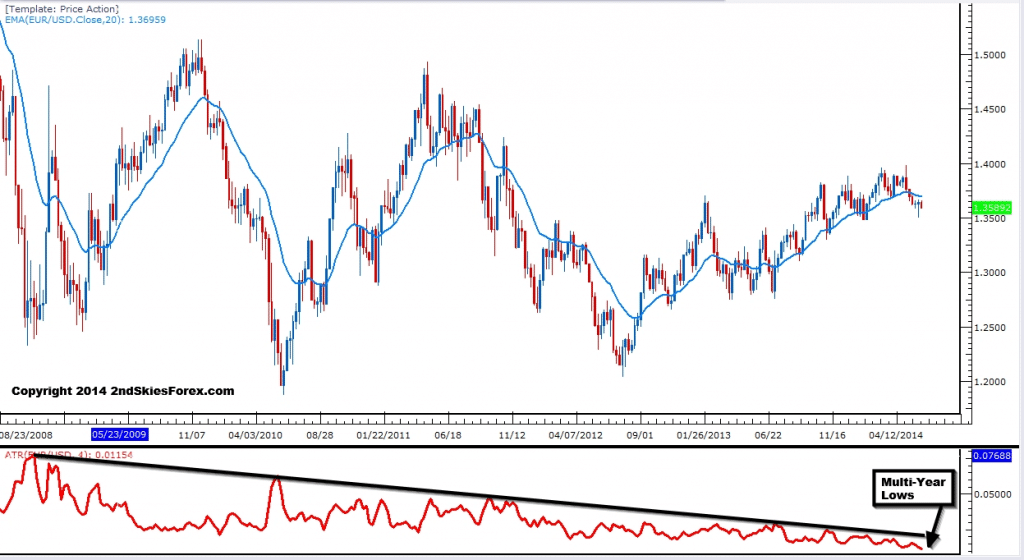
Below is the weekly chart for the EURUSD, the most heavily traded pair on the planet. Do you see that red line under the price action part of the chart? That is the weekly ATR which measures the average trading range (in pips) per week.

eurusd atr weekly chart

The average range of the pair on a week to week basis has been declining for years with it currently being at an all time low. It is the same for most majors, including the USDJPY and GBPUSD. If you are expecting a few hundred pip move on any of the above pairs, you could be sitting on your hand for days which is not the best use of your time. So what can you do about this?

My suggestion is to switch pairs that are more volatile. For example, instead of trading the GBPUSD or the AUDUSD, why not switch to the GBPAUD? It is far more volatile due to the ‘weighting‘ of the pair. If you can learn to spot good moves on the AUDUSD, then it will usually correspond to a directionally opposite move in the GBPAUD.

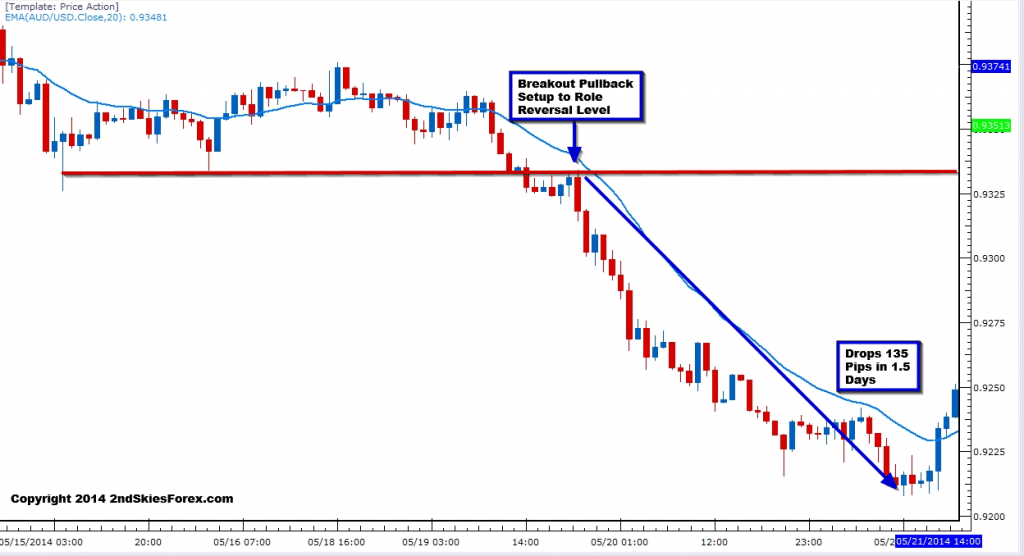
Take a look at the two charts below to get a better idea of this concept. In the first chart, we are looking at the AUDUSD 1hr intra-day chart. You’ll see the pair selling off heavy in the middle of the chart after a breakout pullback setup around 9330.

audusd 1hr chart breakout pullback setup

The trade happened in the Tokyo session, and took about 1.5 days to drop 135 pips. Now take a look at the chart below of the GBPAUD at that same time and notice the pattern.

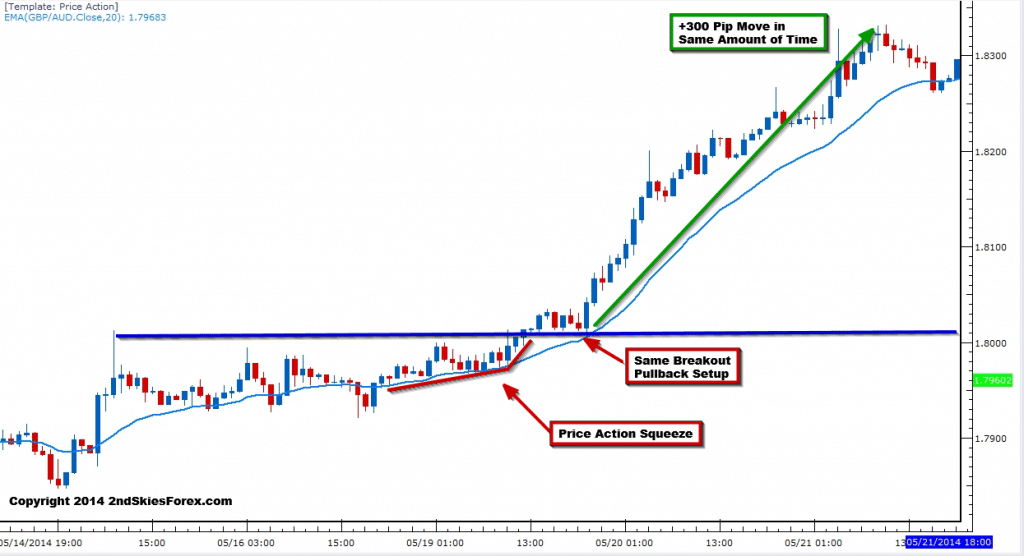
gbpaud breakout pullback setup 2ndskiesforex

As you can see. the GBPAUD also make a breakout pullback setup off the role reversal level, yet it runs for +300 pips (a larger move by 2.2x). The size of each stop would have been relatively similar, which would have led to more profit on the second trade, and money in your account. Even an every day 40-50 pip directional move in the AUDUSD can lead to a +120 pip move in the GBPAUD.

Thus start looking at pairs which are naturally more volatile, and will be less affected by the lack of ‘flow information‘ shared by bank traders who are currently less active.

An additional suggestion would be to add other instruments, such as global indices and commodities. The Asian indices such as the Nikkei 225 and Hang Seng tend to have consistent volatility.

Along those lines, recently spent time with an HFT trader at IMC (Chicago). He mentioned how IMC is quite active in trading the Asian indices because of the higher volatility. Gold and WTI Crude Oil will also offer some greater volatility. Same with the German Dax and FTSE 100, so consider expanding your instruments giving you multiple options to trade.

Summer Forex Currency Trading Tip #2: Spend More Time Training
Since you are naturally less active during the summer months, why not use that time to build your trading skill set? Forget the idea of walking away when there is no trades to play golf, watch a movie, or read a book.

You want to be a professional trader who has the freedom of working from home, not having a boss who tells you what to do, what to wear and how much you get paid.

Do you get better at golf by sitting on the beach? Do you get better at playing guitar by reading novels? Do you get better at martial arts by playing video games? No, so why in the world do you think this applies to trading? It doesn’t, hence take advantage of the time available.

For those not familiar with it, Forex Tester 2 is a fantastic live simulation platform. You can take virtually any pair, and load up 13+ years of data on any time frame, then live forward trade it as if the price action was forming in real time.

I did a great video on forex training with Forex Tester 2 which shares several ideas how to accelerate your learning curve. This is especially relevant for those trading daily and 4hr strategies.

Ask yourself how long would it take you to log 500 trades if you only trade the higher time frames? Years perhaps? In less than a week, you can log the same amount of trades in FT2.

Think of it being the equivalent training of the golfer at the driving range, hitting ball after ball. Professional golfers on average will hit 500 balls a day. Do you think that helps their golf game and perfect their swing? Ponder that a moment for those of you only trading 3-5x a month, and how long it will take you to build your skill set.

I’ve had several students log thousands of trades after a few months using FT2. Go figure their trading is improving the most, and showing the greatest profits over the last few months.

NOTE: In the link I shared above to the video on FT2, there is a link where you can get a $50 discount on it.

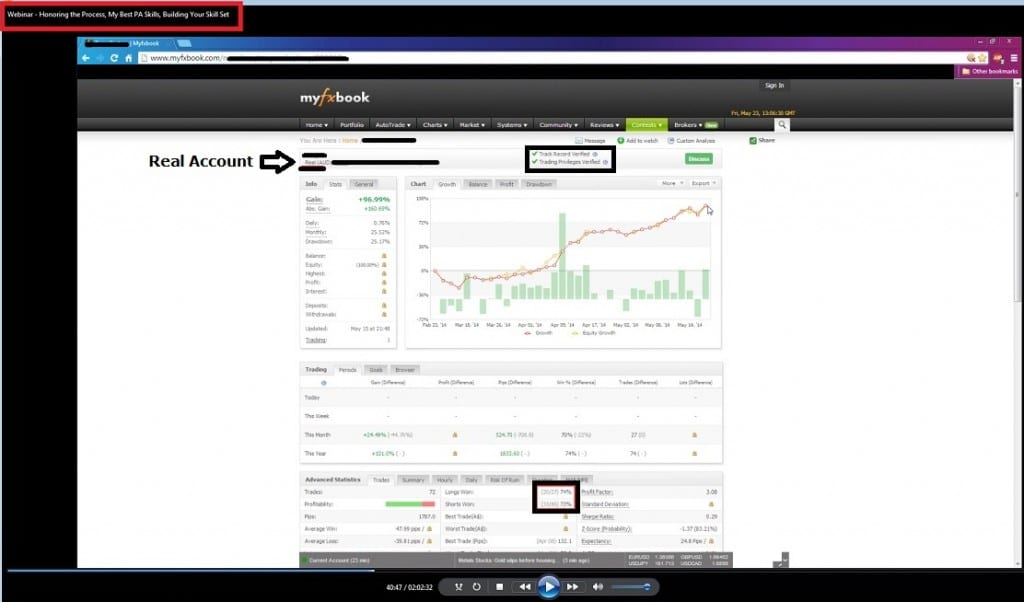
Along the lines of using FT2 to improve your trading performance, I recently did a private member webinar, where we showed a myfxbook account from one of our students. He is trading over 70% accuracy, and up about +96% on his live trading account, with his average wins well out-sizing their average losses. He profit factor is currently +3.08 and is up +1780 pips for the last 4 months.

Below is a screenshot from their myfxbook page we discussed in the webinar.

2ndskiesforex student profit live myfxbook account using price action

They trained over and over again in FT2 and are a member of my price action course.

While others are being lazy traders, they are building their skill set. If anyone is going to really trade for a living, it will be the ones who put in the hours and properly train.

In Summary
These are just a few tips you can use to help stay consistently profitable trading forex in the summer, while using the time effectively to build your trading skill set.

There are many more tips which I share with my course members, along with more ways to utilize Forex Tester 2, building a successful trading mindset, how to train properly, along with adjusting to the ever evolving markets in real time.

Key Talking Points:

  1. False Breaks Offer Great With Trend Trade Setups
  2. Trading the False Break with Pin Bars
  3. Trading the False Break with Engulfing Bars

In my prior article on trading the false break strategy part 1, I shared the basic definition of a false break, covered what is the price action and order flow behind false breaks, and how we can trade them.

In this false break forex trade strategy article, I will discuss how you can trade them using pin bars and engulfing bars, along with entry, SL and TP techniques.

To Recap What A False Break Is
I generally define a false break as one of the two following scenarios:

  1. A break above/below a prior candle that fails to close above/below that candle
  2. A break above/below a key level, quickly reversing that level, and sparking a counter-trend move

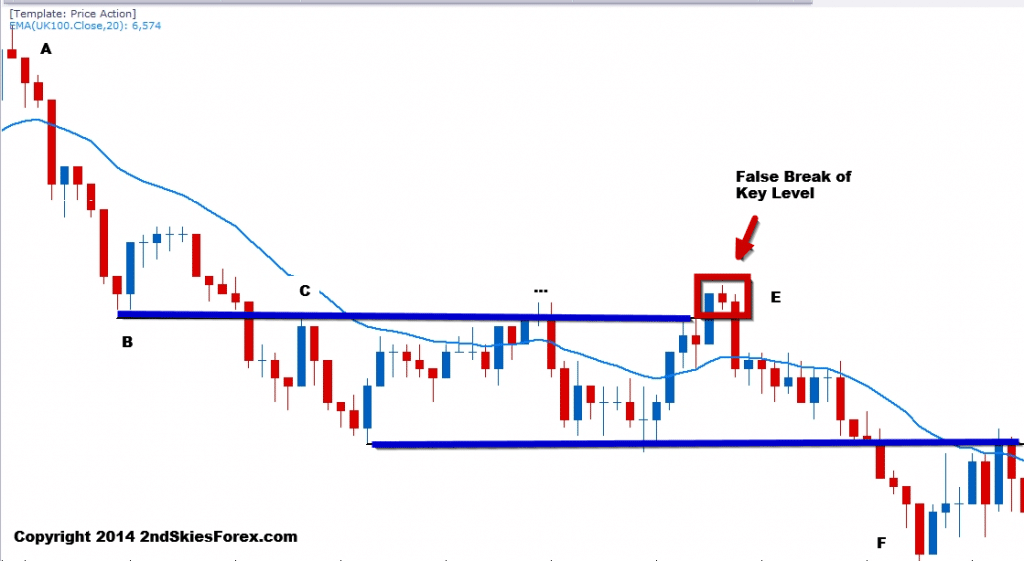
Below is another example of a false break:
forex price action false break strategy 2ndskies c2

Looking at the chart above, we can see a clear downtrend, starting with A in the top left of the chart. The sell-off finds support at B, which eventually becomes a role reversal level at C.

Further along at E, we can see the textbook false break setup, just like we defined in the prior article. The pair breaks up above the key level CT (counter-trend), stalls, then sells off again breaking back below, and offering a great false break setup.

This sell off heads all the way down to F for a nicely profitable trade, and is a great example of a false break setup.

Now we will discuss how to trade the false break setup with a pin bar.

The Pin Bar + False Break Setup
Another type of false break setup is using the pin bar reversal pattern. In many ways, the pin bar by itself, can be a type of ‘false break’.

This is true if the body of the pin bar itself is housed within the prior bar. The breaking above/below the prior bar, and then closing back within that bar, is in and of itself, a type of false break.

What we are going to discuss is how we can use this to trade the false break strategy in combination with the pin bar.

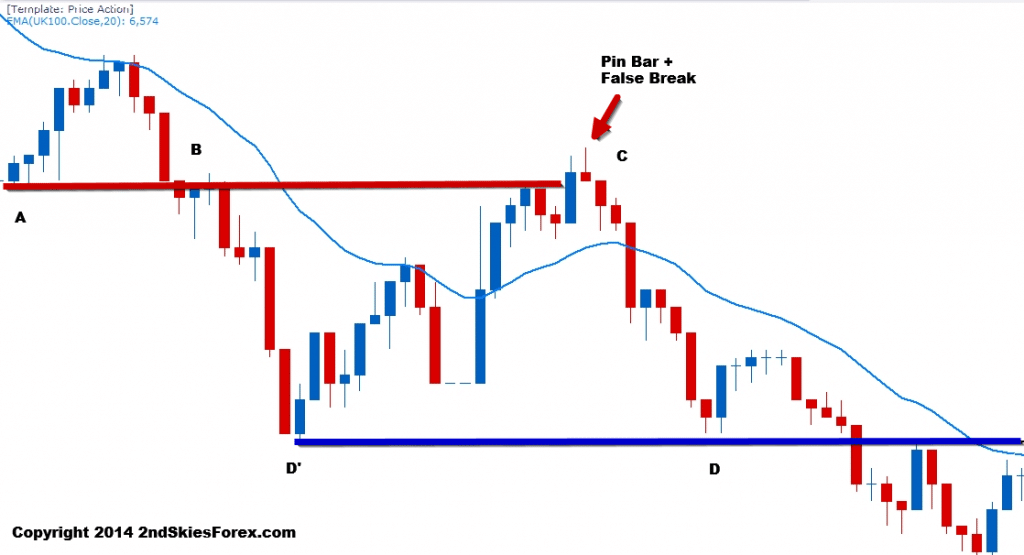
A Pin Bar + False Break Example
false break pin bar price action 2ndskiesforex c1

In this chart above, we can see at A (top left), there is a bullish move to the dynamic resistance (20 EMA). The sell off from the dynamic resistance to B only takes 3 bars, which means it was over 2.5x faster then the buying pressure at A.

From an order flow perspective, the sellers are stronger, since it took them less time to cover the same distance.

After breaking below the support level at B, the pair bounces at D’ towards C, (very same support level at A), hence a role reversal level.

Now notice at C how the pair briefly broke above A. If the buyers were really in control, they would have kept pushing prices. But the pin bar formed a false break above the highs of the blue bar (or prior bar).

This breaking above then back below, suggested a likely false break and more selling. The pair sold off from C to D, re-affirming the pin bar + false break setup.

NOTE: Observe how the support level at D and D’ formed another role reversal setup just after? This is a great example of trading with the trend.

Entry, Stop & Limit
If the pin bar represents a real false break, then the with trend direction should continue. Assuming I have read the price action context correctly, I generally like to enter using one of two methods:

  1. On a few pip break back below/above the key level
  2. On a pullback setup to the key level

The first entry method (more aggressive), can protect you from missing the move, as sometimes the false break never offers a second chance to enter.

For those wanting more ‘confirmation’, then I’d recommend the second entry method.

Now assuming the pin bar is the high/low in the move, I’ll put my stop just above/below the pin bar. For my take profit, if there is a prior level which caused the bounce/sell-off leading into the pin bar, then I’ll target that. One can use that as the only target, or as a first TP holding for a deeper move.

Trading the Engulfing Bar + False Break Setup
In reality, the engulfing bar + false break setup is not much different from the pin bar false break. I am still wanting to trade them with trend as much as possible, looking for a false break followed by an engulfing bar.

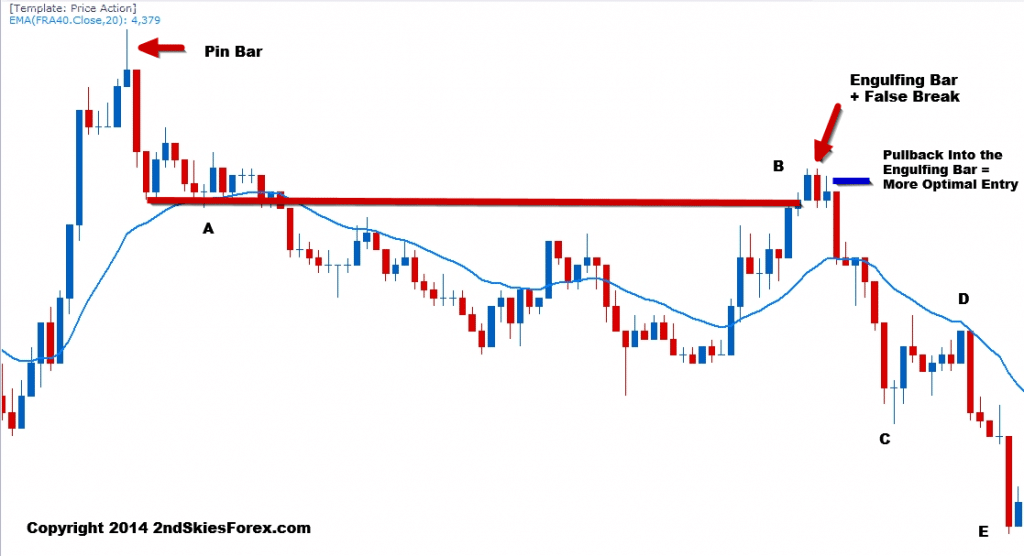
An Engulfing Bar + False Break Example
engulfing bar false break price action 2ndskiesforex c3

Turning to the chart above, we can see the strong selling stops at A. This forms a price action squeeze, which leads to a breakout and further selling.

The pair pulls back to B (the support level at A), and forms a false break. This is immediately followed by an engulfing bar.

Now ask yourself, if the bulls were truly in control, why did the price action immediately reverse after taking out A? This should have been a clue to watch for a false break.

You’ll notice right after the engulfing bar was an inverted pin bar. This is a failed attempt to rally, suggesting the buyers tried to push higher, but failed. What results is heavy selling from the open of the next bar down to C, and eventually E, resulting in a nice profit.

NOTE: Take a look at the move from C – D. This is a corrective pullback following an impulsive move. The corrective pullback went into the dynamic resistance (2o EMA), and then sold off heavily after.

This would have represented a great pullback setup, and is a good example of how impulsive and corrective moves manifest.

impulsive and corrective price action 2ndskiesforex
Entry, SL & TP
The entry, stop loss and take profit techniques are the same as the pin bar + false break. The only variation, would be if the engulfing bar closes back below/above the key level.

If it does, I’ll look to take a pullback into the engulfing bar, which is far more optimal entry as a whole. For more information on why the pullback is a more optimal entry for the engulfing bar, click here.

To Recap
In today’s false break forex trade strategy article, I talked about how false breaks offer great with trend setups. I then went into two more examples of the false break strategy, showing how you can trade them with pin bars and engulfing bars.

I shared entry, SL and TP techniques, along with explaining the price action and order flow behind these great setups.

These are just a few of the false break techniques available. If you want to learn more about trading the false break, along with other forex trading strategies, you can read more about my Price Action Course & Daily Members Commentary here.

Key Talking Points:

  • False Breaks Offer Great Price Action Trading Setups
  • You Can Trade the False Break Strategy with Pin Bars and Engulfing Bars
  • Look for False Break Setups Trading With the Trend

Ever tried to enter on a forex false breakout breakout setup, only to have the trade immediately reverse on you? I’m guessing this has happened to you many times (present trader included).
With the market volatility declining over the last several years, false breaks can and will happen all the time. The key to avoid getting stopped out, and actually profit from these false break setups, is to understand the price action context which often precedes them.
In this two part article series, I will begin today’s discussion by defining a false break. Next, I’ll go over a common false break setup, which is trading the false break with trend. Then I will go over a fundamental false breakout strategy, and conclude by recapping the key points.
What is A False Break?
I would prefer to define a false break as one of the following two scenarios: 

  1. A break above/below a prior candle that fails to close above/below that candle
  2. A break above/below a key level, quickly reversing that level, and sparking a counter-trend move

Below is an example of the first type with a pin bar + false break:
trading the false break strategy 2ndskiesforex c1
In the chart above, you can see the arrow to the top left, showing a bullish move running into resistance. The pair then settles back, and makes a second attempt to take out this key level.
But on the top right, you can see it forms a pin bar + false break.
From an Order Flow Perspective
Looking at this from an order flow perspective, the bulls were in control leading up to the level, and were able to push past it. Either there was massive profit taking on their part, or they ran into heavy sellers a few layers deep behind the level.
Regardless, the sellers over-whelmed the buyers, and pushed the pair back below the key resistance level. After a second attempt to regain the level, the sellers realizing they had control, sold even more, pushing the pair down impulsively.
Trapping Traders
In most false breaks, there are ‘trapped traders‘, meaning traders who are caught long when the pair is about to go short, or vice versa. Those trapped traders once the trade goes negative, will likely be stopped out, & further fuel the counter-trend move.
The more savvy traders will exit manually when they realize they are trapped, while the slower traders will likely get hit for the full stop. There are price action clues to tell when you’ve been trapped, but that is for another article.
Trading The False Break Setup With Trend
It should not be surprising, one of the best false break setups occur when trading with the trend. This is because the underlying order flow is heavily imbalanced, meaning it’s heavily bullish or bearish.
When a false break setup forms counter-trend, it usually runs into buyers or sellers who are happy to take the pullback getting a better price. Their overall strength in the market makes it harder for counter-trend false breaks to be maintained.
This is why false breaks present such great trade opportunities.
Below is a classic example of trading the false break setup with trend:
trading the false break strategy 2ndskiesforex c3
In the chart above, starting with the top left, we can see the heavy impulsive selling. Eventually this leads to a bounce which hits the key resistance level 2x (marked by two red arrows). After forming a new low (red line at bottom), the pair bounces to retest the bears at the same resistance level.
Now note how the pair breaks above this level with a really large blue bar, closing at the highs. Ask yourself, if the bulls were really in control, how come they did not produce any follow through?
The next two doji candles showed no real strength or follow up buying, which should have been a warning sign to any bulls already long. Bears wanting to trade with trend, should have been looking for the false break and close below which they got on the 3rd candle.
Entry, Stop & Take Profit
With such a clearly defined trend and resistance level, there are two general entry techniques;

  1. Sell on Break back below the key level
  2. Wait for pullback setup to the key level

More aggressive traders who feel confident in their price action skills may sell on the break back below the key level. This may or may not offer the best price, but you may not get a second chance to enter if the sellers came in hard on the false break.
More conservative traders can wait for a pullback setup to the key level. If the false break is real along with the level, then the trade should hold and not go much into the negative.
I generally recommend placing the stop above the high (or below the low) of the false break by a few pips, depending upon the volatility and liquidity of the instrument.
The first target should be the other end of the consolidation. If you want to go for multiple targets, then the next key support or resistance level would be suggested.
To Recap
In today’s forex false breakout article, I talked about the price action and order flow behind a false break setup, and why it can be a powerful trade opportunity. I discussed the two types of false breaks and how to generally define one.
Lastly, I covered why to look for with trend setups trading the false break, giving the entry, stop and take profit methods.
When you learn to read price action in real time, you will begin to spot these false break setups more easily. As you get skilled in identifying them, you will avoid the common traps, and profit heavily from them as they offer great opportunities.
In the second part of this article, I will talk about using a false breakout strategy with pin bars and engulfing bars.

Last year Nathan at winnerstradingedge.com wrote a brilliant piece which you can find here talking about Why Nial Fuller’s Method Doesn’t Work (referring specifically to his risk models).

In this article, he is responding to Nial’s claim that the superior forex risk management system is to risk a fixed dollar amount per trade. It should be noted Nial’s main claims were 1) a fixed dollar amount could get you out of a DD (drawdown) faster when winning, while 2) it would take longer to get out of the same DD if you used a fixed % equity model.

Nathan decides to demonstrate in two scenarios how a fixed % equity model is actually far superior. Nathan’s data shows clearly using a fixed dollar amount actually hurts you both in DDs (drawdowns) and during winning streaks.

I completely disagree with Nial Fuller and have always endorsed a fixed % equity risk model as being far superior. I will demonstrate this later with data and several scenarios. But first, onto Nathan’s results.

In this chart below, he shows two accounts each with the same starting balance of $10000. The two accounts were either using a 2% risk per trade method (representing the fixed % equity model) vs. the fixed dollar amount (risking $200 per trade each trade). Below is the graph showing the performance of the two models.
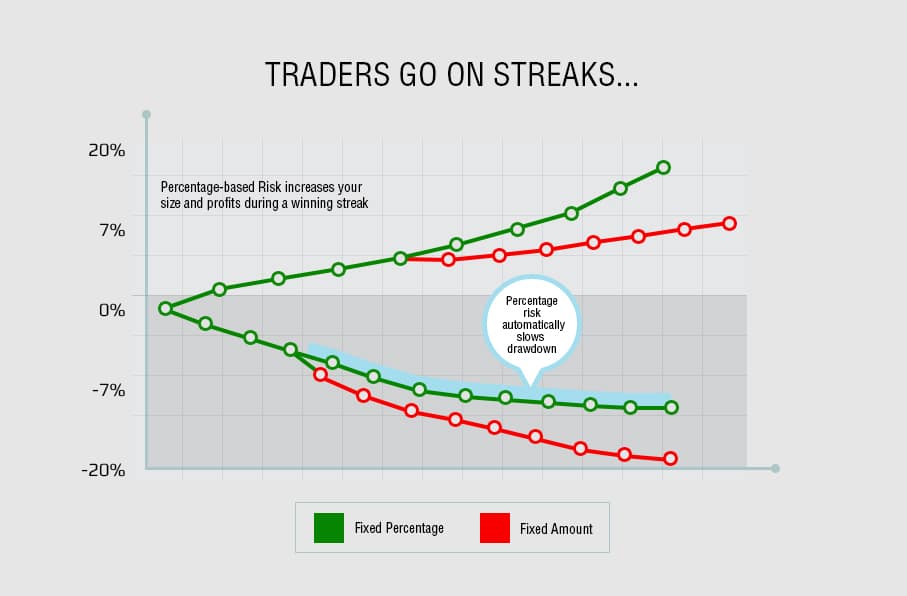
fixed percent equity risk model superior than fixed dollar amount graph 1 2ndskiesforex

Nathan in his experience noticed how traders go on winning streaks. He thus tested two scenarios, whereby the traders go on either a 10 win-streak, or a 10-loss streak. The green line is our model (fixed equity % model). The red line is Nial’s model (the fixed dollar risk method).

During a winning streak, our fixed % equity model pulls away from Nial’s fixed dollar amount and continues to gain further as it goes on. This happens around trade 5 and continually separates further after each winning trade.

For the losing streak, our fixed % equity model again outperforms Nial’s, by losing less each trade, thus protecting your capital.

After Nathan published this data highlighting the differences, people on both sides disagreed.  But nobody was providing any more data to back up either side. We at 2ndSkiesForex decided to run the numbers ourselves and further demonstrate how a fixed % equity model was far superior.

The first forex risk scenario we looked at was a 10 win trade recovery after the 10 loss series Nathan presented above. Here is how the data plays out below.


After 10 losses, Trader A goes on to win the next 10 using the fixed % model:
-As per the chart above, Trader A has a balance of $8171 at trade 10. This continues below-

$8334.42 at trade 11
$8501.10 at trade 12
$8671.12 at trade 13
$8844.54 at trade 14
$9021.43 at trade 15
$9201.85 at trade 16
$9385.88 at trade 17
$9573.99 at trade 18
$9765.06 at trade 19
$9960.36 at trade 20 for fixed 2% rule


After After 10 losses, Trader B goes on to win the next 10 using the fixed % model:
-As per the chart above, Trader B has a balance of $8000 at trade 10
-Since the math is easy, at trade 20 Trader B has a balance of $10000, for a whopping .4% difference.

Now in comparing the numbers as a whole over these last three scenarios, lets look at the following three facts:
1) During the first 10 win UD (updraw), you get +1.58% BETTER performance (more upside) using a fixed % model
2) During a 10 loss DD (drawdown), you get +1.71% BETTER performance (or lesser DD) using a fixed % model
3) During the next 10 win UD (updraw) you get -.4% LESSER performance (or lesser gains) using a fixed % model

So in two out of the three forex risk scenarios above, the fixed % equity model outperforms the fixed dollar amount. The total edge is +2.89% over the fixed dollar amount using the fixed % equity method.

But lets take this a few steps further and lay out the other 4 scenarios from here to see which performs better. They are;

Scenario 1 = 10 more straight wins from trade 20

Scenario 2 = 5 more straight wins from trade 20 

Scenario 3 = 5 more straight losses from trade 20

Scenario 4 = 10 more straight losses from trade 20


Scenario #1: (10 more straight wins from Trade 20, or T20)
Trader A Balance = $9960.36
Trader B Balance = $10000

After 10 more trades (T21-T30), the fixed 2% model will have a balance of $12143 while the fixed dollar model will have a balance of $12,000. Summed up, the fixed % model has $143 MORE in profit, or a 1.2% GREATER gain. Hence the fixed % model wins this scenario.


Scenario #2 (5 more straight wins from trade 20)
Trader A Balance = $9960.36
Trader B Balance = $10000

After T25 (or 5 more straight wins), fixed 2% model has a balance of $10998.69 while the fixed dollar amount has a balance of $11,000, or a whopping $1.31 more, which is only a .01% gain over the fixed % model. Pretty weak difference. But a win nonetheless for the fixed dollar model.


Scenario#3: (5 more straight losses from trade 20)
Trader A Balance = $9960.36
Trader B Balance = $10000

By T25, the fixed % model has a balance of $9002.78, while the fixed dollar amount has a balance of $9000. Summed up, the fixed % model has $2.78 MORE in profit, or a .03% gain over the fixed dollar amount. A small difference, but nonetheless a win for the fixed % model.

Obviously from here the answer gets much uglier for the fixed dollar amount model as this progresses, but here are the numbers below.


Scenario #4: (10 more straight losses from trade 20)
Trader A Balance = $9960.36
Trader B Balance = $10000

By T30, the fixed % amount has a balance of $8136.84, while the fixed dollar amount has a balance of $8000. So the fixed % model has $136.84 MORE in capital, or a 1.7% gain over the fixed dollar amount.

When you tally up the 2 scenarios by Nathan, plus the 4 we just ran, the score is 5-1 with the fixed % equity model being the far superior model.

Here are the numbers and scenarios summarized below;
Scenario A (Nathan’s scenario – 10 wins from 10k) = +1.58% better performance for fixed % equity model
Scenario B (Nathan’s scenario -10 losses from 10k) = +1.71% better performance for fixed % equity model
Scenario 1 (as per my description above) = +1.2% better performance for fixed % equity model
Scenario 2 (as per my description above) = -.01% worse performance for fixed % equity model
Scenario 3 (as per my description above) = +.03% better performance for fixed % equity model
Scenario 4 (as per my description above) = +1.7% better performance for fixed % equity model

This comes out to a grand total +6.21% better performance for the fixed % equity model across 6 scenarios.


Translation

This shows a huge advantage using the fixed % equity forex risk management model which is clearly far superior to the fixed dollar amount method. This is only across 20-30 trades using any one scenario above. The more trades this gets applied to, the better the performance. Over a traders lifetime of 500, 1000, or 5000+ trades, this edge becomes exponentially superior.

Keep in mind, you cannot do any risk of ruin calculations using a fixed dollar amount, however you can using our % equity model. Anyone using Nial’s fixed dollar model is simply throwing money away over time.

This should end the debate between which forex risk management system is the better model. Clearly the fixed % equity forex risk management model wins by a Mortal Kombat Fatality.

I would like to state I am welcome to see evidence to the contrary if/when it is presented, as I am totally open to seeing it.

Make sure to share this “how much to risk per trade” article as it discusses a critical topic for your trading. But more importantlyleave a comment whether you agree or disagree, and why.

One of the greatest ‘myths‘ out there (or mis-information) is price action on the lower time frames (below 1hr charts) is just ‘noise‘. This is a highly confused notion of price action trading and nothing could be further from the truth.
Prop traders are often trading below the 1hr time frames every day, oftentimes on the 1m, 3m or 5m charts. Bank traders will often be highly active, also trading on the lower TFs. They do this while also building up large swing positions they hold for weeks, perhaps months to trade with the trend. Same goes for desk traders and institutional ones alike.

The bottom line is, professional traders are trading off all time frames. There is no ‘holy grail’ of time frames. There is no bastion of good signals that only exist on the higher TFs (daily and 4hr charts) while anything below the 1hr chart is just ‘noise’ or garbage. High quality signals exist on all time frames, and traders are making money on virtually every time frame you can imagine. The ‘noise’ idea you’ve been told is a myth.lower time frame noise myth busted chris capre 2ndskiesforex
Sorry to kill the sacred cow – but those espousing the freshman idea only good signals exist on the daily/4hr charts clearly do not understand price action.

The idea of noise existing on a particular time frame comes down to the lack of one thing – training. I will use an analogy to demonstrate this point.
Foreign Tongues & Cryptography
If I am walking down a street in my home country, I will understand what people are saying. Why? Because I speak the language. I have been trained to.
Now put me on a busy street in Finland or Mongolia, and I will have no idea what they are saying. Their conversations will sound like noise to me. In fact almost any language that is unrecognizable to me will sound like ‘noise’.
Why? Training.
But give me six months to a year learning that language, and what before sounded like ‘noise’, will now sound like a conversation. It will have information, meaning and a familiarity to it. I will be able to understand and recognize what they are saying. The only difference between the two scenarios, is training.
Same goes for cryptographers (those who translate coded communications). What may sound like noise to me and you, is actually a hidden message or code for them. Again – the only difference between us and them is training.
cryptography training intra-day time frames 2ndskiesforex
It Comes Down To This
If you have been only trading the higher TFs, then for a little bit, the lower TFs will look like ‘noise’ to you. You will not understand the differences, the rhythms, and how the information is expressed a little differently. But through training, practice and experience, you will start to understand the code.
What you will find are great intra-day signals, key levels, and how the intra-day price action flows. You will spot opportunities and see patterns. With a little effort, practice and training, the ‘noise’ of those time frames will start to become clear and trades will start to pop out to you. With proper training comes an improved trading mindset.
That is not to say you should or have to. I always recommend finding what is most natural to you, your availability, and inclinations. That could be only on lower TFs, higher ones, or a mix of both. Everyone will have a sweet-spot. It is up to you to find that.
To be clear, I am not saying this comes easily, but nothing in trading ever does. It takes patience, work, practice and training, but it certainly can be done.
Hence do not believe the confused freshman ideas there are boogeymen down there. I have many students trading the intra-day charts successfully several times a day while maintaining accuracy and profitability. There is no reason why you cannot do the same.

Here is a sneak peak from a video lesson in our price action course. The third topic of the lesson had to do with liquidity, price action and how that affects trading. We discussed how knowing the liquidity of an instrument is crucial to understanding how to trade it and how it will affect the price action, along with your stops and take profits.

sneak peak price action course 2ndskiesforex

Recently I got a question from a newer student asking the following;
“Right now I’m short this pair. It’s in profit, but it just formed a pin bar against my trade before I hit my profit target. What should I do?”
This is a common question I get about what to do when you see a price action signal that is counter to your trade. The question by itself actually tells me a lot about the student and where they are at in their process (beginning, middle or more advanced).
My response was similar to the following;
“It is important to understand we are not pattern traders. We are price action traders. Being a pattern trader, as in trading pin bars, inside bars, engulfing bars, or fakey’s does not make us a price action trader.
Pin bars are not the death of trends. I can come up with about 50,000 examples of trends both intraday, or on the 4hr and daily time frames whereby the trends ran into a pin bar at a key level, then smashed right through it. I can also come up with thousands where they did the same and reversed.
‘Wait, but those were counter-trend pin bars, what about with trend pin bars?’ 
Same thing, I can come up with 50,000 of those that were with trend, and the market reversed the prevailing trend. I can also find you thousands that were with trend and worked out.
So what was the difference between the ones that did work out and ones that didn’t?
The key was the price action context around the pin bar. How the price action was leading up to the pin bar, and around it (the context of how the pin bar formed) is what will make that signals useful or not.”
This is why it is such a freshman idea and a complete fallacy to think all you need to trade successfully is 3 simple patterns (pin bars, engulfing bars, inside bars). All that + trading with trend at key levels and VOILA! You have your A+ setup and a profitable price action trade.
If it were only that simple (FYI – if it were, a lot more people would be profitable).
So how do you deal with a counter trend signal to your trade?
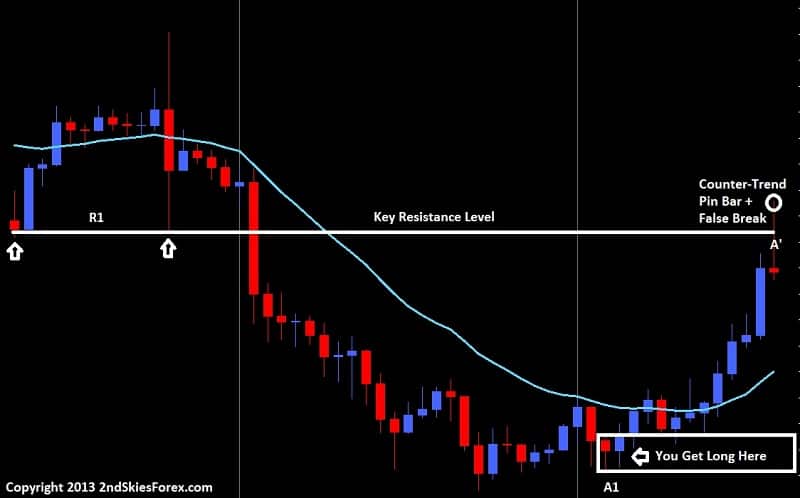
The answer is in reading the price action context around it. I will share four charts below to demonstrate the point clearly.
Exhibit A
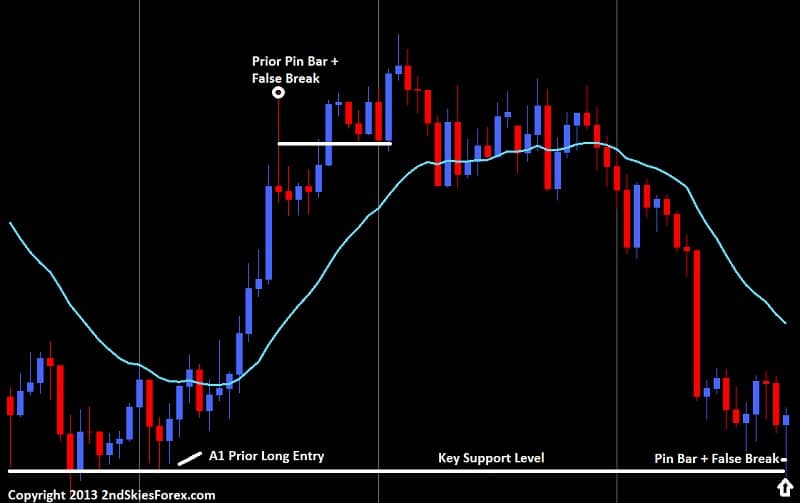
Looking at the chart below, we can see towards the left a double touch off the level R1, then a break through it with a large breakout bar. The market falls heavily and you look to get long around A1 on the bottom right of the chart. Your trade is working out great, but you run into a pin bar + false break (A1) at the key resistance level R1.
price action counter trend trade pin bar key level dev2ndskies.wpengine.com
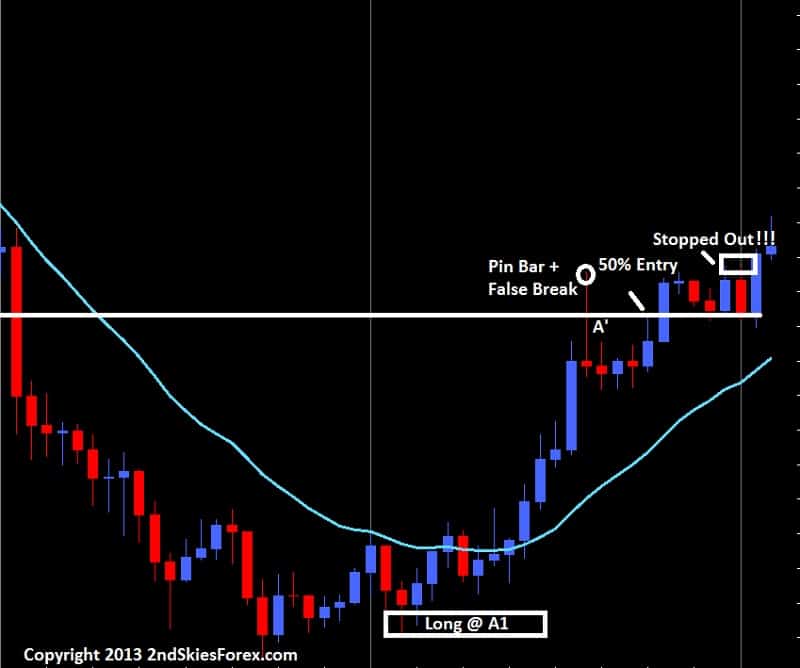
Minions of the 50% retrace entry on the pin bar are salivating because they think this is a great chance to short as you have a pin bar + false break at a key level, and the 50% retrace is at the level.
Meanwhile, you being long back at A1 see this pin bar and are worried about the market reversing thinking the move is over, so you exit.
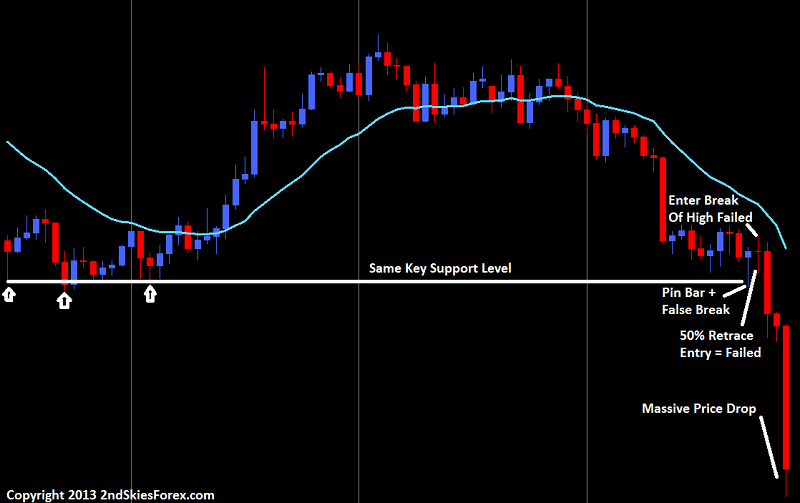
Turns out both of you were wrong (see chart below)
pin bar 50 percent retrace entry failed price action context dev2ndskies.wpengine.com
Exhibit B (later on in the same chart)
In this next chart below which is only a couple days later on the same pair, price eventually falls back to the same key level where we bought at A1 prior. It forms a consolidation just above it, then a pin bar + false break.
pin bar false break price action context dev2ndskies.wpengine.com
Great! Time to get in on the 50% retrace entry yes as its at a key level. Or, the other option touted is to get long on a break of the pin bar high yes? Either way, this is an A+ setup right since the pair is in a range and formed a pin bar at a key level right?
See the next chart below
price action context pin bar entry fails dev2ndskies.wpengine.com
Turns out both pin bar entries failed, even though it was at a key level while price action was in a range. Now imagine you were long around the top of this chart, and ran into this counter-trend pin bar signal at a key level. You probably would have taken profit.
But by not understanding the price action context around the level, you would have missed out on a ton of profit, almost double your profit leading up to that pin bar.
This is why its important to graduate beyond the freshman concepts of trading pin bars, inside bars, engulfing bars, fakey’s, or whatever price action patterns. If trading were that easy, as in trading with the trend + key levels + price action signal = profitable trading, then a lot more people would be making money.
The difference between knowing when to take those signals is in learning to read the context and order flow behind the price action. Pin bars are not the death of trends. Nor are the other patterns. In isolation, or even with trend analysis + key level analysis does not make it a good trade.
Thus my answer to this students question about what to do when you see a counter trend price action signal to your trade – my response is to understand the order flow and price action context around that signal. When you begin to do this, your trading will start to turn. You will find yourself winning more trades, and holding onto trades longer. And while others are buying this last pin bar – you are selling it, and you’ll understand why.

In my prior article on the New York Daily Close Charts, I exposed the forex myth demonstrating how the New York Close Charts are not superior to the UK GMT 00.00 charts.

For my price action course members, I just updated our stats on the inside bar strategy, and compared the NY 5pm Close vs. the UK GMT 00.00 Close. For the second time, the results showed no superiority in performance.

Keep in mind, this is just a price action strategy I built, with no server time in mind. We tested it using identical parameters, and here are the results below;

FXCM UK GMT 00.00 Close
-9 Pairs Total Made the Cut
-13 Possible Trade Combinations (via pair/time frame)
-All 4 time frames had profitable setups (Daily, 4hr, 1hr, 30m)
-60% Hit Rate

NY Daily 5pm EST Close
-9 Pairs Made the Cut
-13 Possible Trade Combinations
-All 4 time frames had profitable setups
-61.5% Hit Rate

Now, if the NY Daily Close Charts are so superior, how come they only account for a 1.5% edge in hit rate, yet in the other system they had a 4% lower hit rate?

Does this sound like massive superiority to you? I didn’t think so.

Although you hear it all the time they are superior, who is backing it up with actual statistics? Nobody……save here.

What was also interesting is many of the pairs others are purporting to be profitable using the inside bar strategy are not – not by a long shot.

What the data simply translates into is that neither one is significantly more profitable than the other. However, it is important to know which pair and time frame is, as many did not match up across the different server times for continued profitability.

Now I did promise to discuss an alternative platform besides MT4 for those that want to stick with the NY Daily Close. First, before I share the platform, I should state why I do not like MT4 for trading;

1) Execution on Market Orders is Slow – so slow that FXCM spent a ton of money and time just to remove the 3rd party bridge and no auto account syncs so that it would execute faster
2) Bulky – not user friendly or flexible unless you can program an EA
3) Have to do more clicks for simple trading operations (i.e. closing multiple positions at once, etc.)

There are many other reasons, but if you do any sort of intra-day trading (1hr charts and below), or market orders, you will find other platforms to be far faster with their execution. Even the MT4 demo platforms can have slower execution then a live order on another platform.

What MT4 is Good For
The only use I have for MT4 is to run my algos which inform me of setups (that I execute on other platforms). For programming EAs, it can definitely be cheaper and simpler, but beyond this, for trading purposes, MT4 is slower and bulkier.

A More Intuitive Platform
For those that want a more user friendly and intuitive platform, I suggest the FXCM TS2 (Trading Station 2) platform. The execution for market orders or any sort of intra-day trading will be far superior and faster than almost any MT4 platform. But even more important, you will have to do less clicks to execute orders.

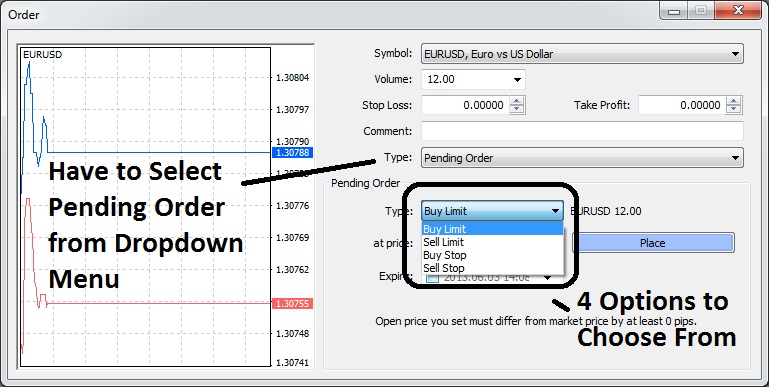
Case in point, open up a new order tab in MT4 to execute a pending order. Here is the window below;

mt4 new order window dev2ndskies.wpengine.com
Now notice, just to execute a pending order, you have to 1) click on the ‘New Order’ button, 2) select ‘pending order’ from the drop down menu, 3) then choose from 4 types of orders.

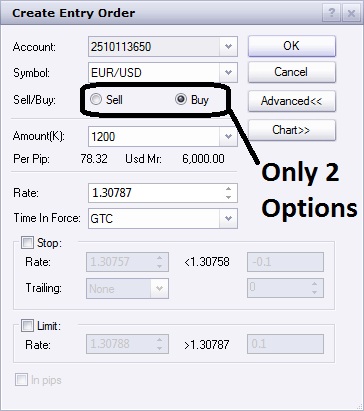
Let’s contrast that with the FXCM TS2 process with the window below;

new york daily close charts fxcm pending order window dev2ndskies.wpengine.com
To execute a pending order you simply 1) hit the ‘entry’ order button, and 2) select the ‘buy’ or ‘sell’ button.

Notice the difference?

We are talking 2 steps instead of 3, which when you are trading intra-day, could mean a big difference in execution and getting your price. But also notice which one is more confusing. With MT4, you have 4 order types to choose from, while with FXCM’s TS2, it’s a much simpler ‘buy’ or ‘sell’, regardless of whether its a buy stop or buy limit order – the platform and technology does the work for you.

But for those trading any significant size, or any intra-day price action strategies, execution is critical, and seconds can mean getting your price or missing it.

Trade History On the Charts
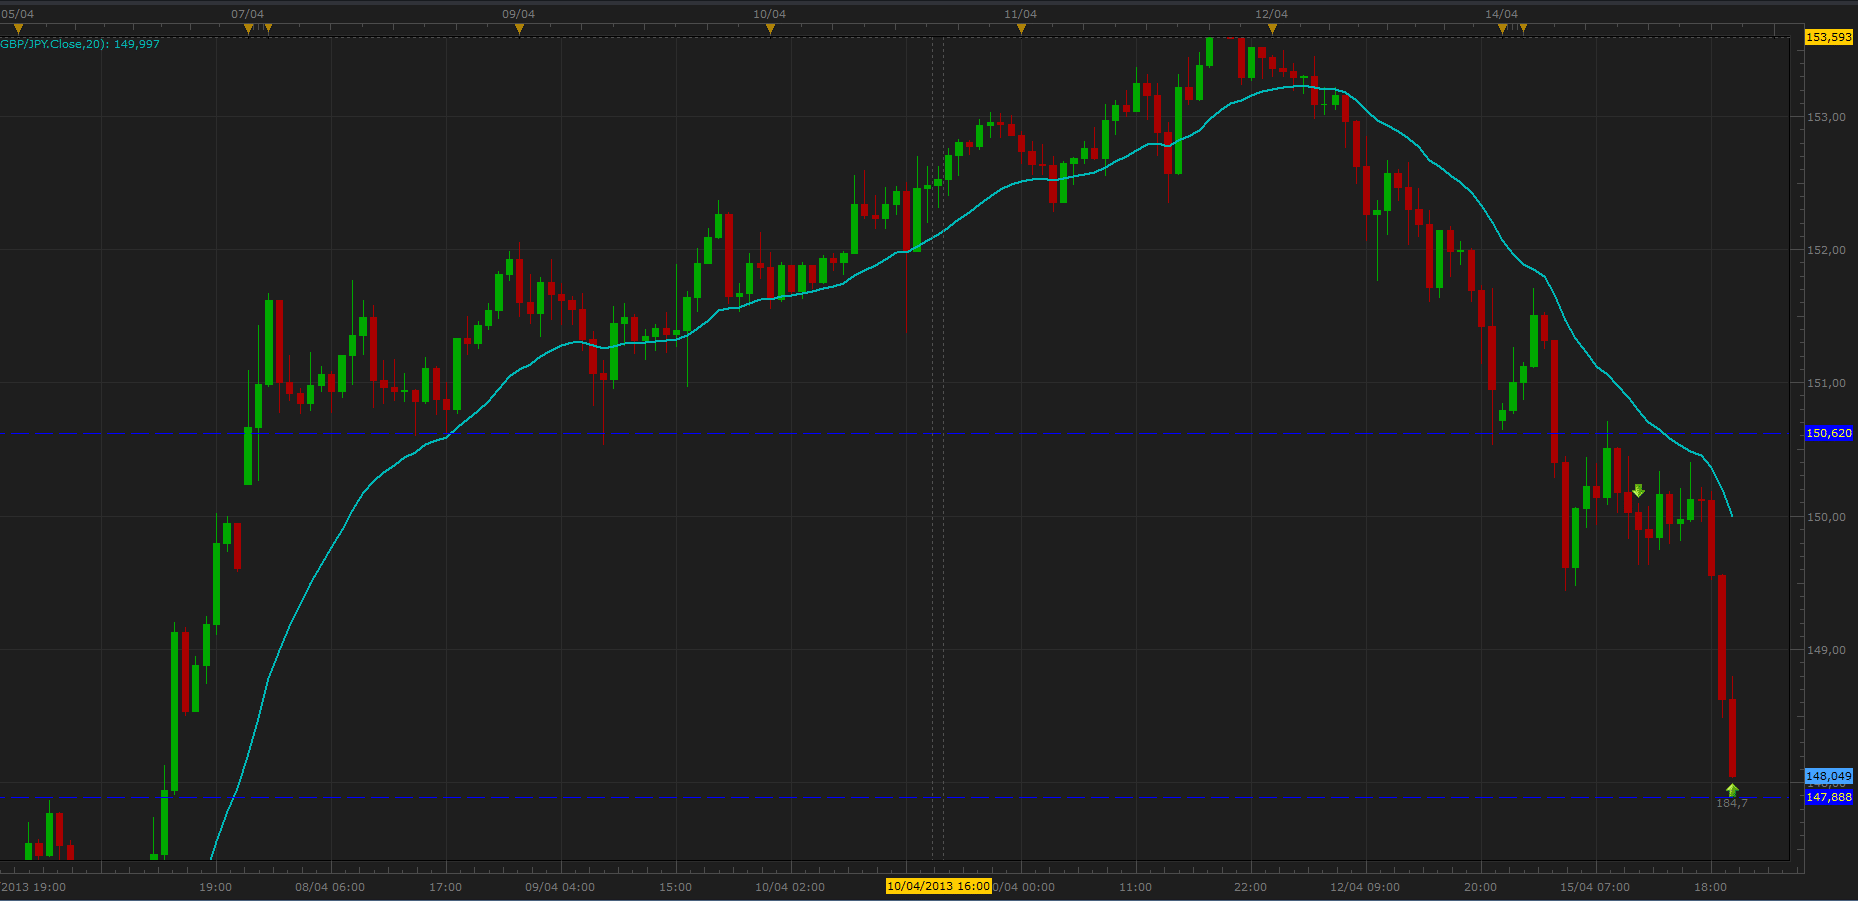
One other feature I really enjoy about the TS2 platform is it shows the trades (or trade history) you made in the last 24hrs on the chart, particularly your entry and exit levels. I find this particularly useful for when I’m doing intra-day trades, sometimes I cannot take screenshots of my trade as I’m in several trades at once. When I close the trade, the TS2 charts (Marketscope), will actually show me the entry and exit level on the charts. A good example is below;

GBPJPY price action course trading dev2ndskies.wpengine.com 184 pips

The benefit of this feature allows to me to take screenshots of trades I missed,  then store them for analysis at the end of the trading week so I can isolate patterns behind my winners and losers. But with MT4, these are not available. Once the trade is closed, the entry and exit levels on the chart are gone, which makes for more work.

Although this is a small feature, it’s all these little features that add up to a big result. When it comes to a trading platform, user friendliness is critical, and the more work you have to do to execute a trade, the more time and profits can be wasted.

I hope this article now has conveyed to you 1) the New York Daily Forex Close Charts being superior is a myth, and 2) there is a far superior alternative platform for trading then MT4 which also uses the NY 5pm Close should you wish.

For those wanting to learn which pairs and price action systems are profitable in your server time, then make sure to check out my Price Action Course where you will learn which pairs, time frames, and systems are profitable across specific server times.