The stock market is a heavily regulated space, and this is understandable. It’s a high-risk market where traders can watch as all their money burns down to the last dollar. One of the most common requirements for trading the stock market as a day trader is the $25,000 rule.

You need a minimum of $25,000 equity to day trade a margin account because the Financial Industry Regulatory Authority (FINRA) mandates it. The regulatory body calls it the ‘Pattern Day Trading Rule’.

The question now is this: are you a Pattern Day Trader?

So in this article we discuss everything you need to know about the $25,000 day trading rule, why it is important, and how to get around the limitation.

What Is the Pattern Day Trading Rule?

The Pattern Day Trading rule was designed by FINRA to limit traders to a maximum of 3 day trades for a 5 day rolling period.
To be honest, we think the rule is rather antiquated, but that is another debate to be had.

For today’s article, it’s important to understand who is a Pattern Day Trader?

First, let’s clarify what a day trade is.

A day trade is when you open and close a position (round trip) during the same trading day.

As mentioned before, you can make 3 day trades within a 5 rolling day period. If you make a 4th day trade in that time, it violates the rule and your broker will likely put a restriction on your account.

Generally, you are only allowed to violate this rule 1x or 2x max, before your broker will be required to pause trading on your account.

Let’s go over a few examples of what a ‘day trade’ is, so you have more clarity on the subject.

Suppose you believe Amazon’s stock will rise in the next few days, so you buy it at $150 per share. Before the end of the day, you sell your shares in Amazon for $155. That is one day trade.

The next day you buy Amazon stock at $155 and sell it for $158, still within the same trading day. That would be your second day trade in a 5 day rolling period.

You become a pattern day trader if you keep this pace up for two more days within the next three trading days. If you violate this by exceeding the 3 day trade limit within a 5 day rolling period, your broker will require you to put in the $25,000 minimum balance limitation on pattern day traders.

If you don’t have the equity, you will be restricted from closing any trades till your rolling 5 day trade count goes below 4.

Why Do You Need $25,000 To Day Trade 01

Why Does the Pattern Day Trading Rule Exist?

If you’re wondering why the government would slap such a minimum balance & day trading restriction, here’s some history to give you a little context.

In 1974, before the introduction of electronic trading, every trade and transaction was made manually. There weren’t any day traders then because it would be a lot to open a trade only to close it a few hours later. The minimum equity in a trading account was only $2,000 then.

Then the introduction of electronic trading happened, followed by the dot-com bubble, which led to the proliferation of day trading. After this bubble crashed, many inexperienced traders who had gotten into day trading for its “quick money” lost their investments.

To prevent such a scenario from happening again, the SEC and FINRA came up with the pattern day trading rule. The idea was to limit low-capital traders from getting into the margin market, assuming that only serious professional traders would meet the $25k minimum requirement.

In our view, we are now in a completely different time and market, with very different structure and flows compared to the period the rule was created in.

What Happens if You Break the Pattern Day Trader Rule?

The first thing that will happen once you break the pattern day trading rule is that your account gets flagged by your broker. Some brokers may proceed to place your account on a 90-day suspension, while others may initiate a margin call.

If you fail to stop defying the PDT rule, you leave yourself and your equity at the mercy of the broker, and by extension, FINRA and SEC.

Is It Possible to Day Trade With Less Than $25,000?

The $25,000 mark may be a high minimum mark for many individual day traders, especially those who only want to test the waters. But many would argue that this limit is not the most effective way to prevent a large scale loss like the one we had after the dot-com bubble.

This then begs the question; is it possible to day trade with less than $25,000?

It is possible to day trade with less than $25,000. There are at least five ways to circumvent the pattern trading rule.

Why Do You Need $25,000 To Day Trade 02

How To Day Trade With Less Than $25,000

Here are some ways to day trade with less than $25,000 without flouting the pattern day trading rule:

  1. Plan your trades
    The easiest way to get around the pattern day trading rule is to plan your trades so that you don’t make over three trades within five trading days. So, if you already made three trades, don’t make another until it’s five days after the first trade. Of course, now that you only have three trades to remain below FINRA’s radar, you need to be precise about your trades. The margin for error has been reduced.
  2. Trade other financial markets
    The pattern day trading rule covers only stocks and options. Forex and crypto are exempt from the rule. There is no government-imposed minimum balance for these two, making them viable day trading opportunities. However, you should also find out the government laws regarding these markets before trading them.
  3. Trade on foreign stock exchanges and with foreign brokerages
    The pattern day trading rule is limited to brokerages and traders trading the US stock exchange. The rule does not apply to brokerages and stock exchanges outside the country. Thanks to this loophole, traders can simply trade stocks from foreign stock exchanges using foreign brokerages. But before you invest capital with any broker, find out the laws they operate under in their country. A downside to this method of trading with less than $25,000, however, is that there are stocks you’ll be unable to trade because they’re only listed on US exchanges.
  4. Split your investment among multiple brokerages
    The pattern day trading rule only monitors one account at a time. This “single-mindedness” makes it possible to circumvent the $25,000 day trading limit by simply spreading your capital across multiple brokerages. You can then make up to three trades within five trading days on each account. While this method is perhaps one of the easiest ways to day trade with less than $25,000, it can limit your trading power. Because your capital has been split, you may not be able to afford some stocks. And for those you can afford, you may not be able to open sizeable positions that will earn you reasonable profit.
  5. Swing trade
    Consider swing trading if you can’t day trade because your equity is less than $25,000. Swing trading is not too different from day trading. Only that your trades will last from days to weeks. Of course, this would require more patience, but it doesn’t require that you have an equity higher than $25,000.

There is one other alternative to the 5 options listed above.

If you were to trade a “0 DTE option” (0 Days to Expiration) and let the option expire at the end of the day, technically the option is settled on the next day, even though it was opened and closed at the end of the aftermarket session.

This is not considered a ‘day trade’ according to the rule, so it’s a way to trade short term without violating the rules.

You could also make a trade one day, and hold it until the after market session. When that ends, by the time the market opens in pre-market the next day, its considered a new day, so you can close it first thing, thus avoiding the rule.

It’s not a day trade, but it is a way to trade short term.

Those are a few options to trade short term without violating the rules.

Is The Pattern Day Trading Rule Limited to the US Alone?

The pattern day trading rule is limited to the United States alone and regulated by FINRA. Any brokerage regulated by this body must follow the pattern day trading rule.

Does The PDT Rule Cover US Stocks Only?

The pattern day trading rule covers stocks and options in the US alone. Other financial markets, like crypto and forex, are exempt from the rule. Stocks on foreign stock exchanges also have no business with the PDT rule.

Why Do You Need $25,000 To Day Trade 03

Mistakes To Avoid When Day Trading in the US

In a bid to outsmart the system, some traders make some mistakes that end up being costly.

  1. Holding trades overnight to avoid day trading
    This mistake is common among novice day traders who don’t want their accounts flagged as pattern day trading accounts by holding trades overnight. Just know that holding overnight exposes you to changes in the market overnight that will be reflected in the pre-market session the next day. This unpredictable fluctuation could cost a trader losses that were not anticipated.
  2. Mounting trade sizes to make up for the PDT rule
    Knowing that there are only three trades in five working days because of the PDT rule, some traders tend to oversize their trades, hence risking too much on a single trade.

This is a huge mistake because the trader would be increasing their risks with the increased trade size.

Conclusion

While you need a minimum of $25,000 to day trade on a US margin account according to the Financial Industry Regulatory Authority (FINRA), there are ways to get around this $25,000 rule.

But remember that whatever you do, make sure to practice proper risk management.

There are a multitude of markets, strategies, and styles for how traders make money. As a whole, traders make money by speculating on the rise and fall of the prices of financial instruments. The various markets traders often speculate on are stocks, options, forex, crypto, commodities, fixed income, and other derivatives.

Traders place buying and selling orders that end up with a profit if their trade thesis is correct, and a loss if it’s not. Below we’ll give a comprehensive explanation of the various possibilities on how traders make money.

The Various Markets Traders Can Make Money In

The are numerous markets where traders can participate with other buyers and sellers to make money. You’ve probably heard about the stock market, the option market, the forex market, the crypto market, the futures market, or the commodities market. Each market offers various financial instruments traders can buy and sell to profit from a change in price.

We’re going to go through these various markets and how a trader makes money in each.

Who Is A Stock Trader, And How Do They Make Money?

Stock traders are individuals or groups that make money off the rise or fall from a company’s stock price through buying and selling. The amount of money a stock trader makes is determined by a) the size of their position (in shares) and b) the dollar value the stock share prices move in their favor

Some basic ways a stock trader makes money:

Buy Low, Sell High

This is a method through which stock traders aim to buy a stock when it’s cheap and sell it off at a higher price in the future.

Imagine it’s 1998 and you think Amazon could be worth much more than it currently is in a couple decades. You decide to buy $5000 worth of Amazon shares at $5 per share which would be 1000 shares. Two decades later, you return to your trade and find that the stock price of Amazon is now over $2500 per share. You own 1000 shares of Amazon, and at $2500 per share, your initial 5K investment is worth $2.5 million dollars.

You happened to buy Amazon when it was ‘low’ and had correctly assumed it would gain in price, thus selling it higher. This is one of the simple ways in which you can buy low and sell high.

Short Selling

Another way to make money through stocks is what we call short selling. This is the opposite of the example below above. Here the goal is to sell high and buy back lower.

Let’s imagine it’s 2007 and you’re worried about the housing crisis and how it might affect banks who own a lot of the mortgage back securities that were so rampantly traded.

You found a stock you think is vulnerable to the housing crisis called Bear Stearns. It’s currently priced around $120 per share, and you think it can go lower, so you decide to ‘short sell’ the stock. Now how do you sell a stock you don’t own?

Technically you ‘borrow’ the shares from someone who has them, then sell them, then buy them back later for a lower price, thus pocketing the difference.

Since you were pretty prescient and were right about Bear Stearns going lower, over the next several months, the stock went down from $120 per share to $60 per share, and you closed it out for a $60 per share profit.

That is how you short sell a stock.

Dividends

One of the unique ways a stock trader makes money is by buying dividend stocks. Dividend stocks are stocks of companies that pay income to their investors quarterly, or annually via a ‘dividend’ which is a small distribution of cash from the company to the shareholders. This is done as a reward for owning their stock. The dividend a shareholder gets is often a percentage of their investment.

Hence, every time a dividend is given by the company at scheduled dates per year, you can either a) get the dividend proceeds put into your account, or b) have those dividends reinvested into more shares, thus increasing the size of your position.

Traders who often seek dividends are looking for ‘passive’ income as they don’t have to do anything to get the dividend income.
How Do Traders Make Money 01

Who Is A Futures Trader, And How Do They Make Money?

A futures trader trades ‘futures’ contracts with a broker to buy or sell a financial instrument at an agreed price and time (in the future).

Imagine you think the price of a commodity may rise by the next 6 months. Futures allows you to get into a contract that mandates you to buy the commodity by December at an agreed price if you don’t close it before the future contract date. Your contract is with a broker or a dealer.

When December comes, if the commodity increases in price as predicted, you profit. But instead of buying it at the current high price, you can buy it at the lower, agreed upon price. The difference between the current price and the price you purchased it at is your profit.

However, if your speculation is wrong and the commodity’s price falls below your agreed upon price, the contract mandates that you buy it in December at that higher price for a loss.

Keep in mind this is only if you don’t close the future contract before the contract expiry.

Who Is An Options Trader And How Do They Make Money

Options trading is a form of derivative trading whereby you trade contracts that are called ‘options’ on an underlying stock, index, or ETF. They are called ‘options’ because you have the option to convert your option contract into a long or short stock/index/ETF position, or close it for a profit/loss based upon how the trade works out.

All options are traded on a specific underlying (like a stock or ETF) at a specific ‘strike’ price on a specific expiration date.

If the contract moves in your favor, either in terms of direction, time, volatility, or any combination of the three above, you profit. If the sum total of the ways above moves against you, you take a loss on the trade.

All option contracts are traded for a ‘premium’ which is the value of each contract. For example, you could buy a call option on Apple stock at the $150 strike price for the June 17th expiry for $3.00 with the $3.00 being the ‘premium’.

Each contract you trade is for 100 shares, so 1 contract x $3.00 x 100 shares = $3.00.

If Apple stock rises and your call contract is worth $5.00, then you profit the difference $5.00 – $3.00 (premium you paid) which is $2.00. For one contract, that would be a $200 profit, or a 66% increase on your investment.

The beauty of trading options is that you can make money on the stock going in your direction, you can make money via time, you can make money by an increase or decrease in volatility in the underlying, or any combination of the above.

Options simply give you way more ‘options’ in terms of how to make money, far more vast than simply buying and selling, or needing the stock to go up or down.

Who Is A Forex Trader And How Do They Make Money

The Forex (or foreign currency exchange market) is another financial market that allows traders to make money by buying and selling currencies against other currencies. If you own US dollars and spend US dollars in the US, the overall value of your US dollar going up or down against other currencies doesn’t matter too much to you.

But when you travel abroad to another country, the value of your US dollar versus other currencies matters. When you trade currencies, you’re always trading the value of one currency versus another.

Forex trading deals with currency pairs, which are two currencies valued against each other. The most popular and traded currency pair is EURUSD, with the first currency (EUR = Euro_ being the main currency, and the second currency (USD = US dollar) being the ‘counter’ currency.  So, if the price of EURUSD is 1.21, it means 1 Euro is worth 1.21 US Dollars.

Another example of a currency pair is the USD/JPY—which is the US dollar vs the Japanese Yen. If the price of the USD/JPY pair is 101, it means 1 US dollar is worth 101 Japanese yen.

When trading Forex, you profit through the fluctuations in the price of a currency pair going up or down. This means you can make money in both directions and can trade long (buying the first currency against the counter currency) or short (selling the first currency versus the counter currency). If you buy the EUR/USD pair and it goes up in value from the time you buy it, you profit. If you sell the USD/JPY and the USD goes down in value to the JPY, you profit.

Hence by making trades on the value of one currency against the other, you can profit.

How Do Traders Make Money 02

Who Is A Crypto Trader, And How Do They Make Money?

Crypto trading is the latest entry into the financial markets space. A crypto trader speculates on the price of cryptocurrencies, intending to profit when their speculations are correct. Just like trading forex, when you trade the value of one crypto currency, you are doing so by trading one crypto currencies value against another.

There are several ways to make money through crypto trading, but the most popular are:

Spot Trading

This method involves buying a cryptocurrency at a low price to sell it at a higher price. Spot traders must purchase/own the cryptocurrency they are trading.

Futures Derivatives Trading

This method involves trading cryptocurrencies as commodities in the futures market. Unlike how it is in spot trading, the trader doesn’t have to own the cryptocurrency(s) being traded before they can make money from it.

Arbitrage Trading

Arbitrage trading takes advantage of the different prices of the same cryptocurrency across exchanges. A cryptocurrency exchange is a financial platform that allows you to buy, sell, and trade your crypto assets.

So, a trader may buy bitcoin (a popular cryptocurrency) from one exchange with a lower rate and immediately transfer it to another exchange where the same cryptocurrency is listed at a higher price, selling it for a profit.

Methods For Trading the Financial Markets

While we have discussed the essentials of how traders make money, this article would be incomplete if we didn’t offer you a glimpse into how traders decide on what to buy or sell.

This brings us to various methods for trading the financial markets.

There are two main trading analysis methods for traders, regardless of whether they’re trading stock, forex, future, crypto, or options. These trading methods are:

  • Fundamental Analysis
  • Technical Analysis
  • Sentiment Analysis
  • Flow based Analysis

What does each mean?

Fundamental Analysis

Fundamental analysis is primarily focused on the macro/economics behind the underlying instrument to try and determine if the stock/currency/etc will rise or fall.

For a stock, this could include looking at the earnings figures over a period of time, the financials of a company, the price to earnings ratio, or many other economic variables behind the company’s performance to determine its value and if it should be priced higher or lower.

While we feel this is an important aspect of ‘information’ that drives price, we feel its incomplete by itself.

Technical Analysis

Technical analysis is a methodology focused on using charts and technical pieces of information to determine if the underlying is under or over-priced (meaning should it go up over time or down over time).

Technical analysis involves using price charts of the underlying over various ‘time frames’ from the 1 minute charts (for day trading) up to the weekly or monthly charts (for long term trading).

Traders who use technical analysis can employ strategies using price action, indicators and other technical methods to determine what the next direction and price is more ‘probable’ for the underlying.

While we consider technical analysis important as a piece of ‘information’ to make trading decisions, we also feel its incomplete by itself.

Sentiment Analysis

Sentiment analysis involves using the overall ‘sentiment’ (or impression) of the underlying to determine what the majority of traders are most likely to do with the underlying (i.e. buy or sell it).

This can include using data sets like social media (positive vs negative mentions), the number of people talking/writing about the underlying, the ‘commitment of traders’ reports for forex currencies, and more.

This approach takes a ‘gestalt’ approach to traders assuming that which is most discussed or talked about is most likely to move.

While we consider this an important piece of the ‘information’ puzzle regarding trading, we also feel its incomplete by itself.

Flow Based Analysis

Flow based analysis involves looking at data sets that give traders information about the order flows of the market. This could include looking at the volume of shares traded, the open interest and volume for the options traded, looking at time and sales, level 2, or other forms of analyzing flows.

In our perspective and 21 years of trading, this is the most important methodology for analyzing the market and making buying and selling decisions.

Why?

Because all forms of information used to make buying and selling decisions must eventually become an order (a buy or sell order). Once that order becomes ‘actualized’ (meaning activated in the markets) it becomes part of the entire pool of orders.

Order flows are the one thing all the various models have in common. They must all go through the channel of becoming a buy or sell order.

And the collective order flow in the markets is the most proximate driver of price action. Thus, if this is the most ‘proximate’ driver, then this is the closest derivative we have to understanding how the price action on our charts changes moving up and down over time.

Thus, we prefer this model simply because it doesn’t matter what the ‘reason’ a trader bought or sold something (whether it was technically based, fundamentally based, sentiment based, or flow based), the common denominator in all of them is they all become an order which becomes part of the flow.

Hence our methodology focuses on what are the flows that are driving the market (regardless of the reason behind them) and then look at that to determine how the price will move.

Categories of Traders

Traders come in different categories or types. The trading category a technical trader belongs to depends on their personality, capital, and time horizons for holding positions.

The categories of traders are:

Swing Traders

Swing traders are characterized by trades that last for over a day and generally up to a few weeks or months. They are interested in catching substantial market moves that often last for days or even weeks.

Because of its nature, swing traders often refer to the hourly and 4-hour timeframes to make their trades. Although they may check other timeframes of the same commodity to get a clearer view of the market, you’ll mostly find them on those two timeframes.

Swing trading does not require much time on the chart, so traders who are busy with other jobs might prefer this.

Position Traders

Position traders are long-term traders. They make trades that last for months or even years. Warren Buffet is a position trader who likes to hold positions over long periods of time and capture large trends.

Position traders are primarily unconcerned about minor short term price fluctuations on the chart. Instead, they’re in the trade with months or even years in their crosshairs.

The daily, weekly, and monthly timeframes are the favorites of position traders. Also, position trading requires even less time on the chart than swing traders.

Day Traders

Day traders want to start and end trades within a single trading day. Some day traders even close every open trade at the end of their trading hours because they don’t want to leave them open overnight.

Day traders make decisions quickly and therefore must think and calculate quickly. They most commonly use time frames from the 1 minute up to the 1 hour chart.

Scalpers

Scalpers are traders that attempt to accumulate many quick profits from small trades that only last for minutes, sometimes even seconds. They don’t care about the big moves, unlike the position or swing traders.

Scalp traders base their trades on the accumulation of many trades regardless of the general market trend. The 5, 10 and 30 second charts along with the 1-minute, 3-minute and 5-minute timeframes are most commonly used for scalpers.

Algo Traders

While the financial markets have been around for decades, algorithm traders (algo traders) are only as new as a few years ago.

Algo traders rely on computer algorithms to make trades on their behalf. These traders may not know much about the financial markets they’re trading, but they trust the computer to make their trades.

These categories are not constricting. A trader can switch from one to another as it pleases them. Again, it mostly boils down to trader personality and natural skill sets.
How Do Traders Make Money 03

Can Trading Make You Rich?

Trading can make you rich, just like many businesses or professions. However, not everyone will be rich in trading. In fact, the statistics of traders who failed in trading way outnumber than those who became successful.

Trading takes a lot of time to master as it requires many skills to develop before you can make money trading. And trading is very risky so its important you understand all the risks involved in trading, specifically as it pertains to the markets you are trading.

How Much Do Traders Make Per Year?

It is hard to tell how much a trader makes per year because there are a lot of factors involved, such as capital/investment amount, trading skill, trading instruments, and so many more.

Two traders may buy the Amazon stock at the same time and price, but one may buy more shares than the other. Also, one may be using leverage, allowing them to potentially gain more than the other who isn’t leverage trading. And for each trader, the losses or gains would be different.

By the way, leverage is an extra amount a broker lends you to make trades that your capital would typically be unable to cover, thus increasing your potential profit (or loss).

Generally junior traders at major banks are making $200-300K per year in their first few years, but many of the top bank traders are making tens of millions per year.

Conclusion

If you forget much of what we covered in this article, remember the following key notes:

  • Traders make money through their speculations about the price fluctuations of financial instruments. They then make trades to back their speculations.
  • The trading analysis methods are fundamental, technical, sentiment and flow based trading methods. Fundamental traders use news and economic reports to inform their trading decisions. Technical traders use charts containing the historical price movements of the commodity to inform their trades. Sentiment traders are interested in the overall gestalt of what traders think (positively or negatively) about the instruments they are trading to make decisions. Flow based traders look at the overall buying and selling flows to see where the price is most likely to move.
  • Traders come in categories, including swing, scalp, day, position and algo traders.

And finally, remember that the financial markets are very volatile and not constant, but dynamic. You could lose all your money invested if you don’t have proper risk management strategies.
There are many stocks you can invest in towards accomplishing your goals of building financial success and abundance. Stocks are often referred to by their various categories and classifications. You will often hear financial analysts talk about ‘growth’ stocks or ‘value’ stocks to invest in, so we’ve provided a list of those stocks below, and how to define or understand them.

  1. Common stock
  2. Large-cap stocks
  3. Mid-cap stocks
  4. Small-cap stocks
  5. Dividend stocks
  6. Growth stocks
  7. Value stocks
  8. Penny stocks
  9. Domestic & International stocks

What Types of Stocks Can You Invest In

Common stock

The majority of stocks you or anyone else will invest in are common stock, which simply means ‘partial ownership of a company. When you hold common stock as a shareholder, you own a partial share of the company and thus value should it increase.

Technically, a stock can go to any upward price, thus giving you an opportunity to profit from the value of that stock rising, but you also take on the risk the value of your investment if the stock goes to zero.

Large-Cap, Mid-cap, Small Cap & Micro-cap Stocks

There are many types of ‘cap’ stocks, which simply refers to ‘capitalization’ or the size of the company’s worth when you consider the total of all their shares.

Companies with a market cap of $10 billion or more are considered ‘large’ cap, and with the recent growth of some mega companies like Amazon, Facebook and Google, all with market caps above $200 billion, they are referred to as Mega-cap stocks.

A general rule of thumb is the larger the cap, the more stable the company is because it has more capital to deploy for R&D, investments, or to pay off debts weathering a downturn in the economy.

Mid-cap stocks are those with a market capitalization between $2-10 billion, and often are considered strong players with well-known brand names, boasting a good size, but are not too small. This allows them to target a combination of growth and profitability.

Small-cap stocks have a market capitalization between $300 million and $2 billion. They are generally considered to have greater rooms for growth but have less stability, and thus can pose a greater risk.

Dividend Stocks

Dividend stocks are simply stocks that provide a dividend to their shareholders on a regular basis, either monthly, quarterly or yearly. These stocks offer a potential second income on your stock portfolio because you have the capital appreciation (increase in value of the stock) along with the dividend you receive on the stock.

Because of this passive income, dividend stocks are often sought out by stock investors because the dividends can help negate some of the risk of the stocks value decreasing.

Growth Stocks

You will often hear the term ‘growth’ stocks floated around. These are stocks that are simply seeing their sales or profitability rise.
It is often the case growth stocks carry more risk due to the fact the companies are pursuing growth, and thus dedicating their resources towards new growth and sales, often at the expense of padding their balance sheet.

Growth stocks can also be companies that are involved in increasing demand in their sector, like many stay at home companies did during the COVID crisis.

It’s important to note a company could be growing in terms of sales and profits, but those numbers can be slowing in comparison to the past, or in relationship to other peers, thus having a potentially negative effect on their stock.

Value Stocks

Value stocks are seen as the other side of the coin to growth stocks. They are generally considered more conservative investments as they are well known, mature companies with a well developed industry not having much expansion left.

One might wonder why invest in value stocks? Because they can often provide stability, or have stable incomes that are less likely to be threatened by changes in the market.

If you are looking for more stable stocks, you should definitely consider adding value stocks to your portfolio.

Penny Stocks

Technically, penny stocks are referred to as any stock valued at less than $1 a share, but recently you’ll hear about traders or investors discuss stocks up to $3 as penny stocks. While technically not correct, its important to note penny stocks are new companies trying to develop a viable product, capture market attention and build revenue.

These are highly speculative investments and often prone to pump and dump schemes thus having tremendous volatility in their share price.

While there are some up and company companies that start off as penny stocks, and actually do grow into well developed companies, this is not the norm.

Domestic and International Stocks

A domestic stock is one that is within the country you are from. Since we tend to focus on U.S. stocks, we refer to any stock with its headquarters in the US as a domestic stock.

An international stock is one from outside the U.S. whereby its headquarters and business primarily reside outside the U.S. While they can have sales/business in the U.S., its not their main headquarters or place of business.

International stocks are often harder to invest in for U.S. residents as brokers don’t often list many stocks outside the U.S. However, many international stocks have a listing in the U.S. to get access to the U.S. stock investors.

Stock Market Sectors

While stocks are broken down by the various types listed above, they are also often categorized by the sector or industry they are in. Below are some of the most basic categories you will find:

Communications: telephone, internet & wireless services like Verizon (NYSE: VZ)

eCommerce: companies that primarily do business over the internet like Amazon (Nasdaq: AMZN)

Financial: banks, mortgage finance & credit card processors like Visa (NYSE: V)

Healthcare: health care insurance providers, biotech & pharmaceutical companies like Johnson and Johnson (NYSE: JNJ)

Materials: construction metals/materials, mining, lumber & chemical companies like DuPont (NYSE: DD)

Technology: hardware, software, or semiconductors like NVIDIA (Nasdaq: NVDA)

Utilities: electric, water or natural gas companies like Exxon Mobil (NYSE: XOM)

Read more about stock market sectors here.

Dividend stock investing gives stock traders and investors the opportunity to create passive income, along with capital appreciation and long-term growth. However, owning a dividend yielding stock by itself does not make it a good investment, and this can create confusion as to which stocks to invest for their dividends.

There are many factors to consider when investing in dividend yielding stocks to consider. Below we’ve provided our list of what to look for in dividend stocks so you have the tools needed to find great dividend stocks to invest in.

Then we’re going to share with you 3 dividend stocks to consider for your investing portfolio, along with several dividend aristocrats.

What are dividends and what to look for in dividend stocks?

For those publicly traded companies that have extra cash on their balance sheets, they have options on what to do with that extra cash, such as reinvest their money into R&D, expand existing operations, consider an acquisition.

But another option is to pay out their shareholders which incentivizes them to hold or buy new shares while brining in new investors to acquire shares, thus supporting the stock price.

What is a dividend?

Now a dividend is a payment from the company directly to the shareholders which often comes quarterly, and in fixed periods.
To give you an example, the company can give you a dollar value per share you own, or a fixed % of the shares you own quarterly.
Investors can either take the cash value of what they are given in dividends, or have those proceeds be received as partial shares of the company.

Investing in Dividend Stocks

Source: Techdaily

Passive income or increasing overall shares?

Now if you’re looking for passive income, you can take the dividend as cash. But if you’re looking to build your stock position in the company long time (since you think the company has potential as a long term investment), you can receive those partial shares, thus increasing your share size in the stock.

Which companies offer dividends?

Its important to understand which companies often give dividends. If a company is new and has growth initiatives to drive new markets and increase market share, they will often not give dividends because they need that extra cash to build their business.

But if you’re a well established business with predictable sales, while they’ll invest in themselves, by offering a dividend, it attracts value investors, which creates stability in the stock.

How to calculate dividends?

The two most important factors to consider when looking at dividends are dividend payment and payout ratio.
The dividend yield measures how much you receive in dividends vs how much the stock costs.
A simple equation to understand this is dividend payment / price of the stock.
Using an example, lets say you own a stock that pays out $2 for every share you own, every quarter (4x per year), which comes out to $8 per year.

If the current price of the stock is $100, and you own 1 share at $100, and you’re making $8 per year, the yield is $8 (dividend payout) / $100 stock price, which comes out to an 8% dividend yield.

Across the S&P 500, the average yield is approximately 2%, but many can offer 4%, 6% or even up to 10%.

Dividends can increase or decrease

Its important to note dividends can increase or decrease over time, especially during recessions (like Covid 19) where dozens of companies cut their dividends to compensate for lost yield.

Hence you cannot think of a dividend as a sure thing, especially during bear markets or recessions.

Key Concepts to help you find great dividends stocks

  1. Dividend history – companies can increase or decrease dividends over time. If a company raises its dividend consistently, that is the sign of a healthy company with a stable balance sheet.
  2. Revenue and earnings growth – stability in the dividend companies you invest in is key as it gives you a more reliable metric to measure your dividend growth and potential income.
    If the revenue and earnings growth is steady quarter after quarter, that’s a well run company. If the earnings are all over the map, up one quarter and then down the next with no predictability, that could be a sign of trouble.
  3. High yield – obviously higher yields are preferable, but only if the company is strong and can maintain it without hurting their business.
  4. Competitive advantages – often a defining feature of a company, when a business has a durable competitive advantage, such as a unique product (think Apple), algorithm in their software (Google search) , or high barrier to entry (Tesla cars and technology), these advantages make it hard for customers to buy other products. This allows the company to enjoy the advantage and revenues since there are less competitors out there offering a worthy viable product.

By using these 4 metrics above, you can find potentially good dividend stocks to add to your investment portfolio.

Dividend investing is a long term strategy

It’s important to understand that investing in dividend stocks most often yield the best results when it’s done over a long term horizon.
Remember, there are two ways you make money from investing in dividend stocks:

  1. Capital appreciation of the stock
  2. Dividend returns

While the majority of your income from investing in stocks will be capital appreciation of the stock over time, the dividend offers a second income, and can provide one in volatile times, particularly when the stock loses value.

Hence, when investing in dividend stocks, you’re concerned with the overall trend over years, not the day-to-day price fluctuations.
Thus, the key is to find companies that have long term potential, growth and value while lesser volatility. These can provide stable incomes over the years while growing massively over time through capital appreciation.

Investing in Dividend Stocks

3 Dividend Stocks To Buy

  1. Apple (Nasdaq: AAPL) – one of the most abundant companies in the world, Apple is a stalwart tech stock giant that has recently started paying out dividends since its earlier years were dedicated towards growth. With one of the most loyal customer bases globally, and an incredibly tight ecosystem of technology, Apple has been expanding its revenue beyond phones into wearables and subscription services. While the dividend is only .6% (as of July 21’), it’s a stock that has stable gains over the years.
  2. Verizon (NYSE: VZ) – one of the most ubiquitous wireless communication providers in the US, Verizon has multiple streams of income, like high speed internet service, 4G & 5G wireless service and more giving it a utility-like income from its core products, which everyone pretty much needs these days (i.e. cell phone service and data plans).This combined with lower debts vs most of its competitors has earned it a place among dividend investors.
    Verizon should also be one of the top beneficiaries and providers of the consumer transition to 5G mobile technology, enjoying strong prospects for future growth and revenue. Oh and it currently provides a 4.47% dividend, making a one of the stronger dividend yields available while maintaining lower volatility in price.
  3. Microsoft (Nasdaq: MSFT) – One of the most well know global brands in computer operating systems and software (i.e. Microsoft Office), MSFT has grown massively in the last several years, increasing sales while maintaining recurring subscription based revenue from its suite of products. Along with having a solid balance sheet, MSFT recently won a part of the JEDI cloud computing contract for the US gov’t, providing billions in contract revenue for the future. With low debt and lots of cash on hand, Microsoft is a stock with potential long term prospects while providing a respectable .81% dividend.

What are dividend aristocrat stocks?

The dividend aristocrat index (a part of the S&P indices) is a group of companies that have minimally increased their divides for at least 25 consecutive years.

This creates a list of companies which have given investors a consistent dividend during bull and bear markets, thus providing some stability to investor portfolios.

Considering their long track record of dividend increases, this makes them potentially more stable investments than your average dividend stock.

We’ve listed a few below to consider for your stock portfolio:

  1. Target (NYSE: TGT) – with a dividend yield of 1.43% (as of July 21’), we feel the long term prospects for Target are strong.
  2. Johnson & Johnson (NYSE: JNJ) – with a portfolio of health care products from Tylenol, Band-aids and more, JNJ offers a 2.5% yield and has been enjoying solid growth and capital appreciation since Covid.
  3. 3M (NYSE: MMM) – one of the older and heavily diversified industrial conglomerates, 3M sports a solid 2.96% dividend and has been steadily increasing in share price since the Covid crash.

In Closing

Every long-term stock investor should consider dividend stocks as potential candidates into their portfolio.
Stock investors should consider a combination of stocks from the dividend aristocrats while adding some high yielders to their portfolio.

By having a solid portion of your portfolio holding stocks with dividends, you add stocks that offer passive income, potential stability and solid prospects for capital appreciation.

Watch this video to learn 5 necessary tips for day trading stocks.

Day trading stocks can offer you a lot of opportunities for profit, but they also require strong trading skills, quick thinking and the right tools to make money trading.

In this video, I share with you 5 tips for day trading stocks that I use personally and will help you in making money day trading stocks.

Read more

Volume is a critical tool and indicator for trading stocks. You have to learn how to trade using volume so you can avoid false breakouts, find the best breakouts, and see how volume can support or negate your trading ideas.

In today’s stock trading video, I’m going to share with you how to day trade stocks using volume. I’m also going to discuss how volume gives you a key piece of information about order flow, and how learning to read the order flow in the price action and volume can improve your trading performance.

Read more

Watch a live price action breakout pullback setup for +110 points (+2R) on the FTSE 100. In this forex trade video, the first thing I establish is my trading ‘framework‘ which is the process and format I go about choosing my price action trade setups. Then I talk about the price action context and how that helps me establish what trading strategies I want to use. Once I have this, I show you how I pick my entry,  stop loss placement and take profit. If you want to learn to make trade setups like this, check out my price action course where you get access to our members trade setups forum, private member webinars, trader quizzes, and a free ‘trading analytics‘ session with me where I do 20+ metrics on your trading and give you actionable insights on increasing your accuracy and profitability.

Read more

Norwegian Cruise Lines stock ($NCLH) has crashed 40% from its recent highs, and we just got more bad news on deck.

To learn how I’m trading Norwegian Cruise lines stock, along with potential trade ideas, analyst ratings and what the major technical pattern that is forming, watch this video!

Read more

Less than two weeks ago, a course member asked me the following question (click to enlarge):

2008 crash

Here was my response:

“You have to be prepared for bigger pullbacks & volatility than usual. You have to keep staying short till you see a broad base of instruments bottoming and showing a transition in the price action and order flow” – from my members coaching session Feb 14th.

This week, we got a taste of this volatility, and there is a decent chance the selling + volatility may just be starting. Hundreds of my clients and friends have been asking me, “Is the stock market about to crash?”

In this trading article, I’m going to discuss the coronavirus, the increase in volatility, what’s happening the financial markets, is the stock market going to crash and how I’m trading it.

So grab the popcorn and a good beer as we’re going to get into the thick and thin of it.

Coronavirus + Volatility = Panic!

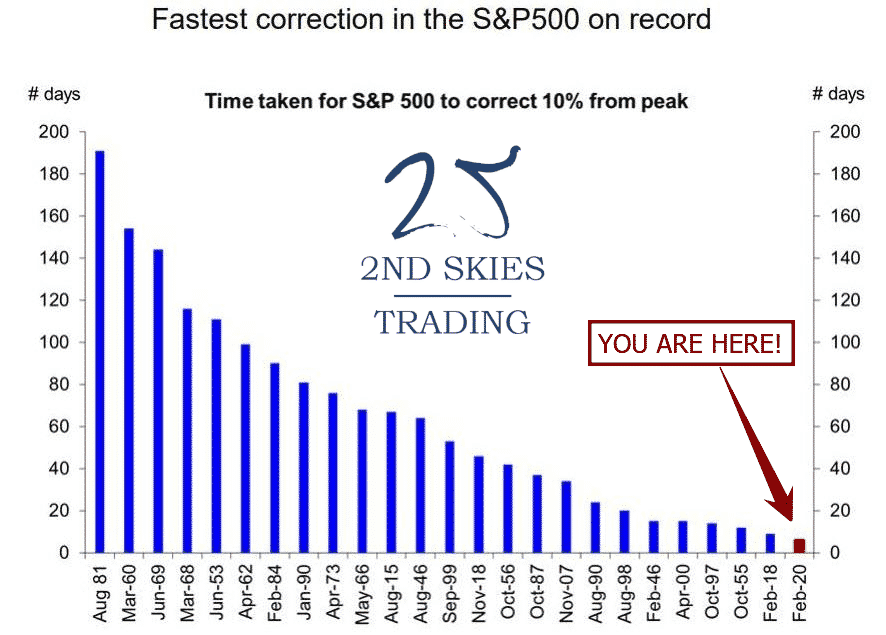
Let’s get into some stats around this week’s incredible sell off in the global markets. This week’s drop in the S&P 500 was the fastest 10%+ drop IN HISTORY!

Exhibit A: The Fastest Correction (10%) in History (S&P 500)

fastest correction S&P 500 in history 2ndskiesforex

In the last 7 trading days starting with February 20 – 28 (from open to close) lost 440 points shedding 12.9% while global markets puked $5 trillion in market cap.

Translation: In the last 7 days, we lost the GDP of the UK & India combined! (source: investopedia)

Also of note, the fastest and second fastest 10% declines (from peak) have happened within this decade.

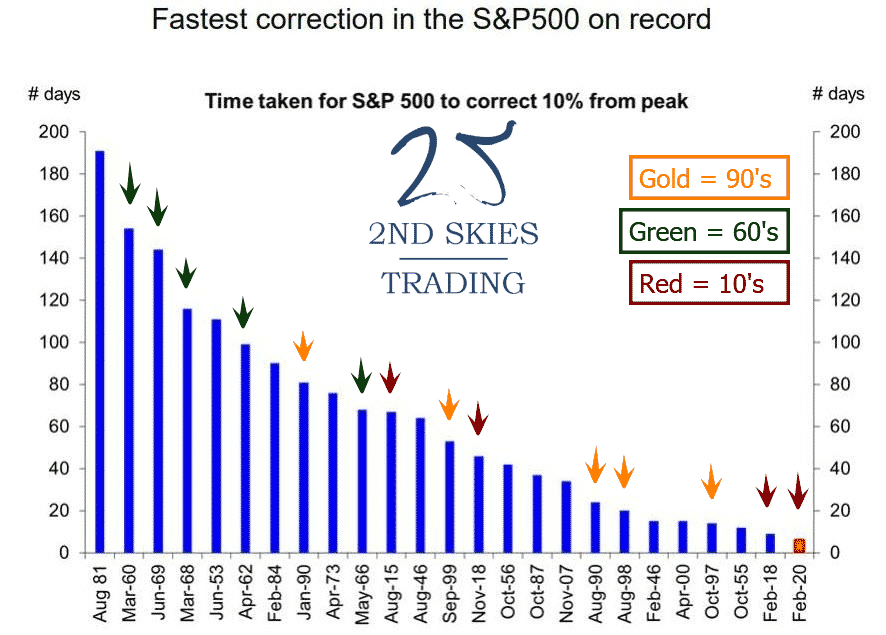
Of all the decades going back to the 40’s, the 60’s and 90’s had 5 of the fastest 10% corrections in history. This decade is in 2nd place with 4 of them (see below)

fastest corrections by decade 2ndskiesforex

Also of note is 3 of the last 5 of these fast 10% corrections have happened in the last two decades and 7 out of 10 in the last 30 years.

Translation: these corrections are happening faster in more recent history than before.

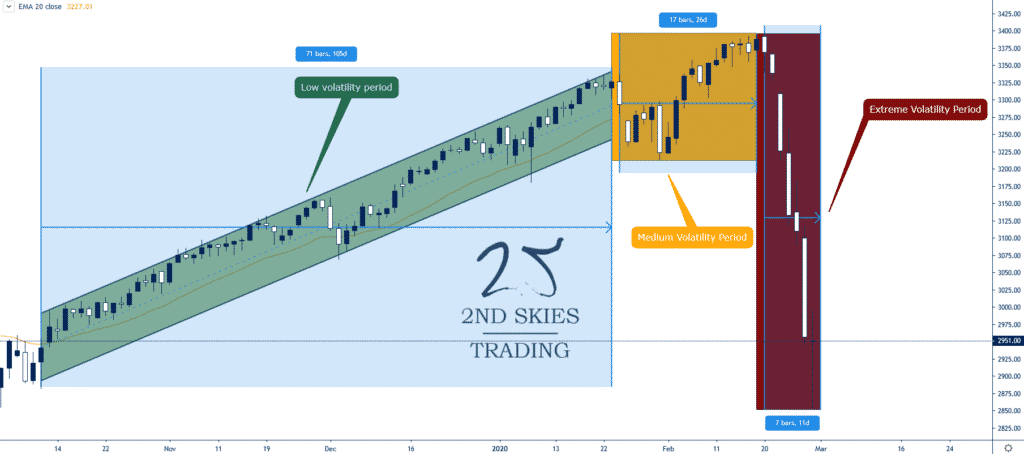
What is also important to note is how low volatility was in the S&P 500 until the corona virus started to become prevalent in the markets (see below).

volatility ranges S&P 500 2ndskiesforex

We had 71 days of super low volatility and many 5 day stretches where the markets never dropped more than .5% (green box)

Then we had a period of 17 days with mildly increasing volatility when the coronavirus was becoming more of an issue.

This culminated in a 7 day explosion of volatility last week erasing months of gains in a flash.

This is one of the most important trading lessons I’ve learned over 20 years. That markets can and often do sell off faster than the run ups.

The reason why this can happen has to do with market psychology and behavioral finance.

In a long bull trend, the general emotions are complacency, confidence and greed. This has to do with simple biology.

We are wired as humans to react more rapidly to stimuli which threaten our existence. Slow non-volatile bull markets don’t threaten us, so we don’t often react with alacrity at a small sell off.

The emotions behind a bear market or extreme selloff is fear, worry and panic. Hence a sharp selloff and quick loss in our portfolio is threatening, thus leading to fast reactions (SELL & SELL EVERYTHING!).

This is why markets can sell off far more quickly then on the way up.

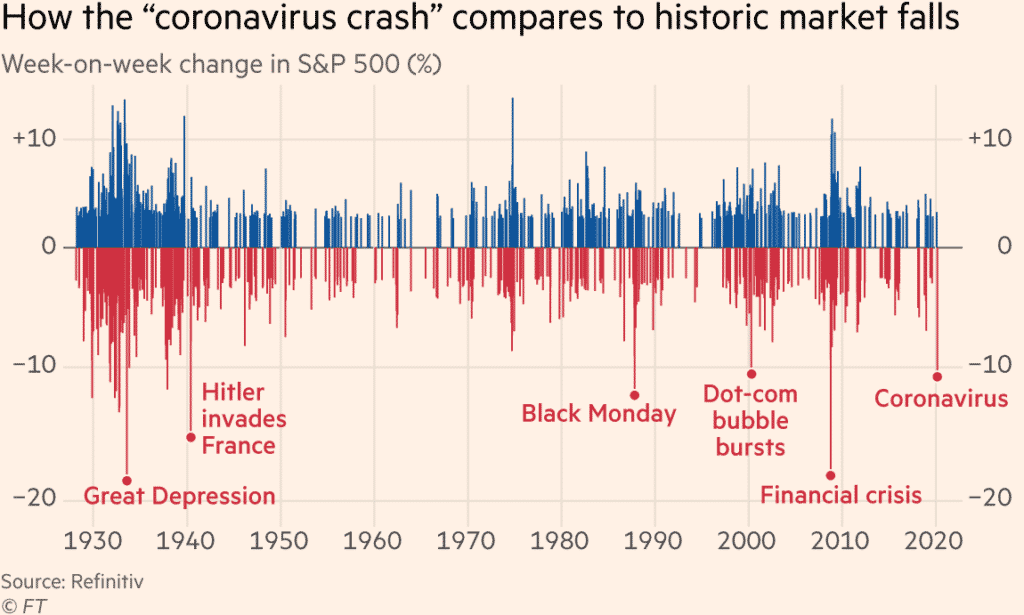
There is a reason why the fastest week-on-week changes in the S&P 500 (%) are during crashes vs bull runs (see below).

fastest week on week moves S&P 500 2ndskiesforex

The big moves to the downside (week-on-week %) are simply larger and more frequent.

This also means big week-on-week changes create a feedback loop for panic selling to continue.

What this means for investors and traders is we make quicker trading decisions during bear vs bull markets.

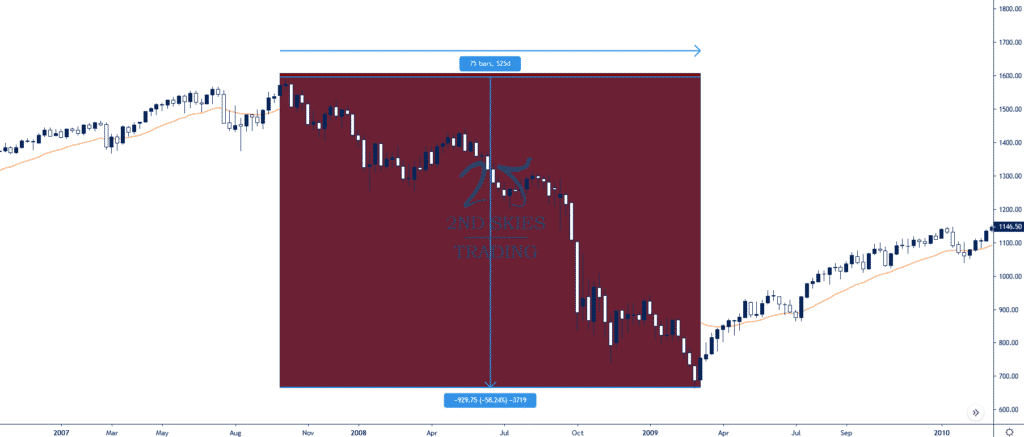
Now in comparison to the 2008 financial crisis, the S&P 500 lost 58% from Oct 07’ – Mar of 09’ over a period of 525 days peak to trough (image below).

2008 sell off S&P 500 2ndskiesforex

We’ve already lost 12.9% (about one-fifth of the 08’ drop) in just 7 days!!!

And if we happen to get another 58% decline, we’ll be looking at an S&P 500 around 1400 by the time this is over.

Translation: this selloff has the potential to be one of the most rapid declines in history. And the speed at which we’ve lost so much so fast last week could create more selling from investors globally.

Going from a low volatility environment to a high one this quickly will create stronger biological reactions, hence the formula Coronavirus + Volatility = Panic!

Is The Stock Market Going to Crash?

Short answer: I don’t know. I don’t think we’re there yet.

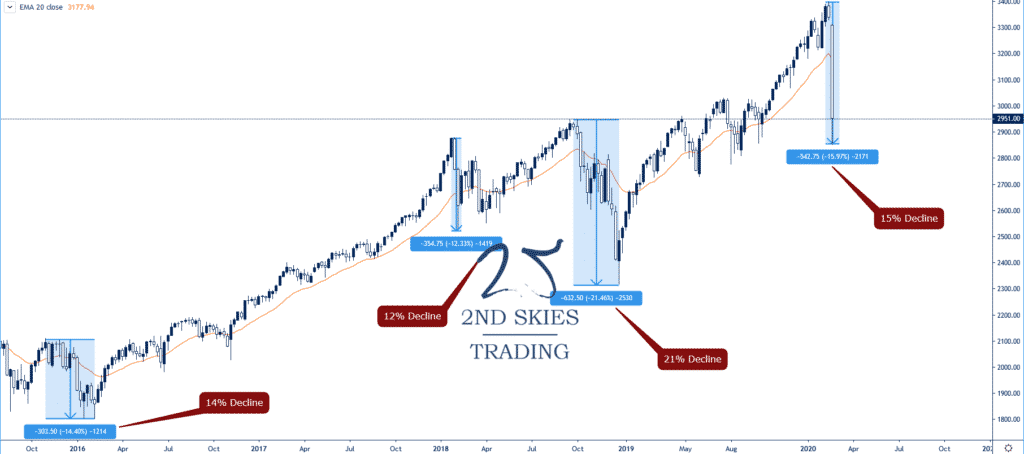
We’ve had many 12+% declines in recent history (4 total) since 2016 with a 12.33% decline (Jan 18’) being the smallest and a 21.46% decline the largest (Nov 18’).

recent declines S&P 500 2ndskiesforex

I think once we start seeing a 25% drop or larger, investors along with major institutions (Fed, Trump Admin) will start to really panic.

Combine this with the fact we’re in an election year and the last thing Trump wants is a stock market collapse.

In some sense, it’s even a bigger issue for Trump as he campaigned on his business skills, and has proudly taken credit many times about this being the “Greatest Economy Ever” pretty much anytime we’ve posted all time highs over the last few years.

Should we get a strong selloff next week and start reaching the -20% levels, expect a govt stimulus to come which (depending upon how its setup) could create a short term strong bounce.

But here’s the kicker…

Let’s say the coronavirus continues to spread from country to country with more and more population centers becoming infected.

Is a Fed rate cut going to inspire you to travel? No.

Will a Fed rate cut give you the confidence to go out in public and risk getting infected with a potentially deadly disease? No.

And this is how this threat to the markets is different than the 2008 great financial crisis.

The 08’ crisis was an economic one (over-leveraged exposure to housing) which was able to spread globally.

The coronavirus isn’t an economic issue, it’s a biological and containment issue.

Economic policies will be more effective (like in 08’) simply because it was more of a 1-1 relationship (economic problem & an economic solution).

However, economic stimulus isn’t going to change a biological health scare because the relationship isn’t a 1-1 match.

My sense tells me economic stimulus packages will be far less effective vs the actual biological and crisis management of the issue.

That is where IMO traders and investors globally should be looking for signs of a turnaround should this selloff get worse.

We haven’t gotten to the ‘Oh-Sh!t’ levels yet. Once we start to get into a 20-25% decline, then I think you’ll start to see real panic in the markets.

How to Trade & Protect Your Long Term Investments During This Time?

I wouldn’t think of buying anything till at least we see the market open this week.

How the Asian markets open will likely give a strong tell as to how the week will go.

Hence before you go rushing into what you think might be ‘cheap’ prices compared to recent history, wait to see how the market opens.

We’ve only had a few instances of the markets selling off for 3 weeks in a row since Dec 15’ (5 total) and none of them shed this much value.

For now, there are various ways you can protect your long term long term plays if you think there is more downside:

Trading Options

1) collect premium by selling calls on stocks you are holding long term

2) bear put spreads

3) buy outright puts on your long stock positions

Trading Forex

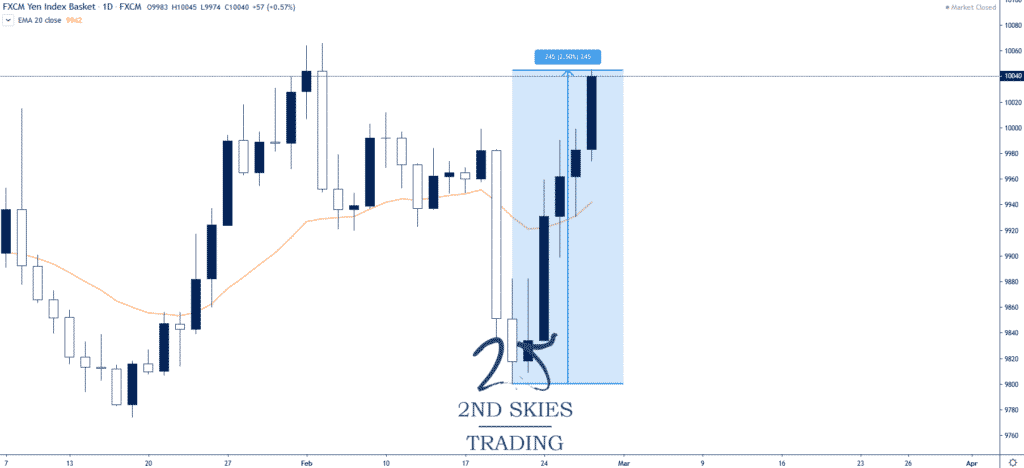
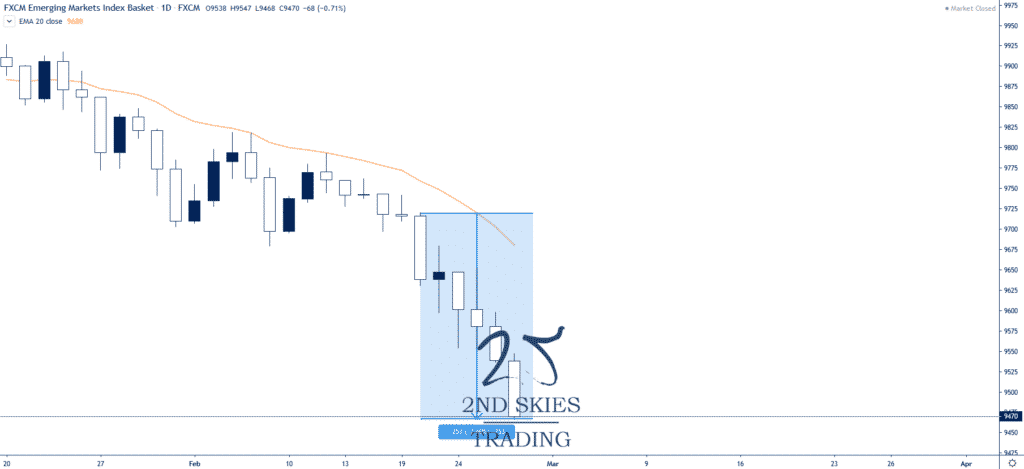
The currencies which have most benefited from this 7 day decline are JPY, CHF, EUR & USD while EM currencies suffered heavily (MXN, RUB, ZAR).

The JPY basket (JPY vs USD, EUR, GBP, CAD & AUD) gained 2.5% last week (image below).

jpy basket 2ndskiesforex

Meanwhile the EM basket (USD vs CNH, MXN, ZAR & TRY) lost 2.6% over the same period (image below).

em basket 2ndskiesforex

The EM currencies which suffered the most losses last week were MXN vs EUR (-9%), RUB vs EUR (-8.8%), RUB vs JPY (-9.5%), MXN vs JPY (-9.6%), CHF vs MXN (9.5%), & the CHF vs RUB (8.8%).

If the virus continues to spread, expect further capital to move into these safe haven currencies vs EM betas.

It’s important to note many of these currencies ran into some key support & resistance levels, rebounding a bit to end the week.

Forex currencies tend to overshoot key levels during major crisis, so if we see them blow past many of the current key support & resistance levels, we could be reaching all time highs or lows (EURZAR, USDRUB, USDMXN) on the quick.

I’ve been trading many of these pairs on the 5 minute charts trading intraday breakout setups with two positions.

I’d suggest using the first position to hit a medium term target while letting the second one run and capture as much alpha as possible till momentum changes manifest in the short term price action.

But this is only recommended if you are doing day trading.

Trading Stocks

If you feel an uncontrollable urge to buy stocks, I suggest the following plays:

Watch the market leaders who exhibited strength heading into the selloff and performed well on Friday. If they continue to exhibit strength, there may be a potential buy, but watch the price action:

1) Microsoft (MSFT) which gained 7.7% on Friday

2) Facebook (FB) which climbed 6% on Friday

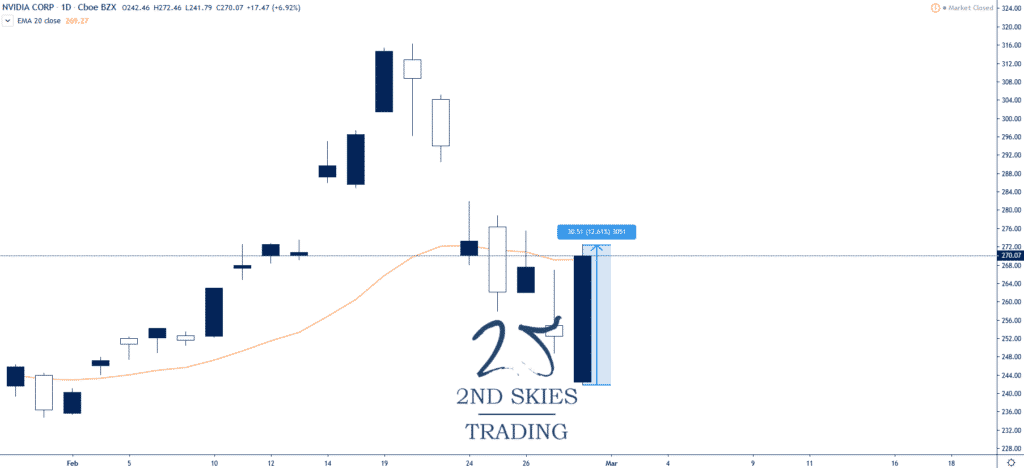
3) Nvidia (NVDA) grabbing a 12.6% gain to end last week

nvidia stock trading 2ndskiesforex

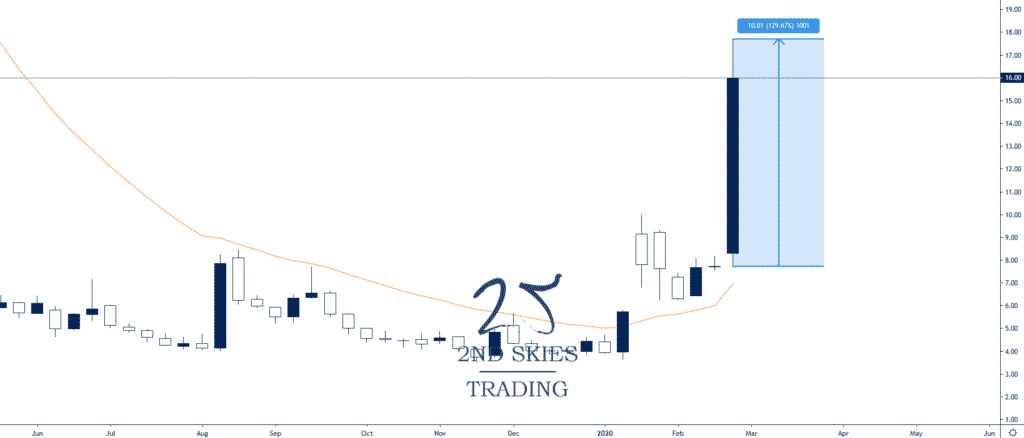
4) If you don’t mind trading nano, micro and small caps, take a look at pharma stocks which have done well recently: NVAX +129% low to high last week, MRNA +96%, and for the truly brave micro cap trader CODX +591% last week low to high (big cajones required 😉)

Novavax (NVAX) chart below:

novavax stock trading 2ndskiesforex

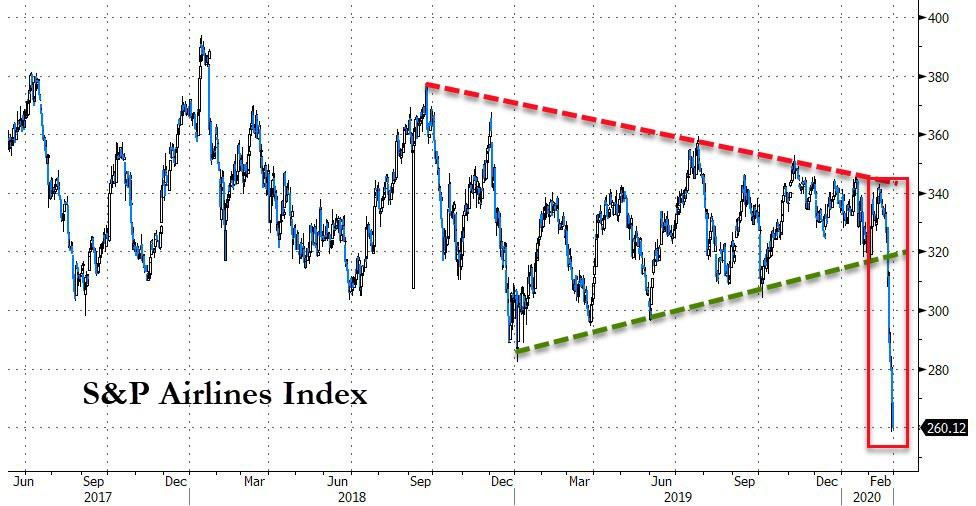
1) Sell Airlines (who wants to fly to another country when there’s an outbreak?) – source: bloomberg

NOTE: A more targeted method would be going after airlines in countries where travel bans or warnings are issued.

sp500 airlines index 2ndskiesforex

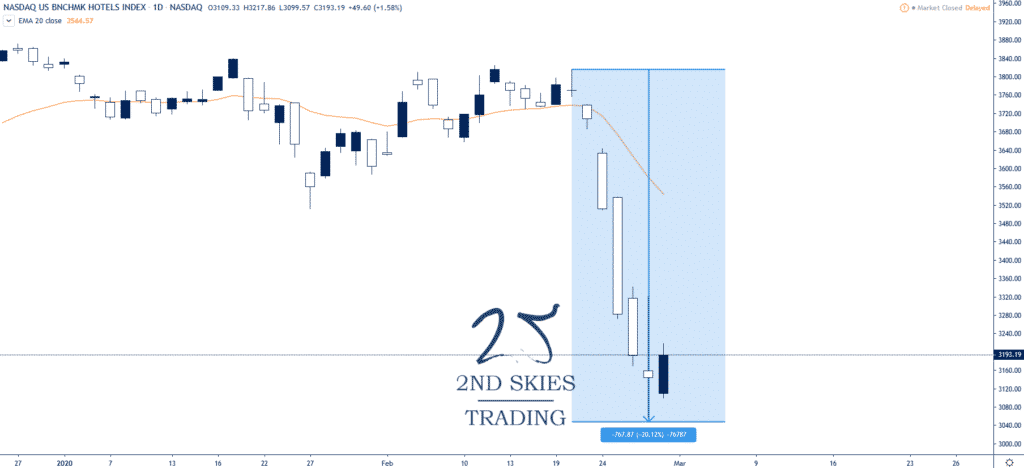
2) Sell Hotels/Entertainment which is down 20% on the week (same reasons as above)

us hotels benchmark index 2ndskiesforex

There’s been a lot of profit taking in commodities, so I’d wait for a change in the short term price action context before getting long (gold and silver in particular).

Wrapping It All Up

Now is not the time to be listening to CNBC analysts, most of whom are not trading. Last week many were all calling stocks ‘cheap’ and in the process getting their a$$’s handed to them.

This is a time to be alert and nimble, using good risk management as the volatility moves on these instruments can wipe out weeks or months of gains if you’re not careful.

Hence trade smaller positions than your usual risk % per trade. Try more ‘proof of concept‘ trades where you put small feeler trades out, and if it progresses, then add on size.

I don’t think the stock market is at its ‘OH SH!T‘ moment yet, but we could get there fast.

I’ve traded now for 20 years and went through 2 major financial crisis (2001 dot.com bust & the 2008 great financial crisis).

The first one I didn’t know what I was doing and performed poorly.

The second one I learned my lesson and killed it.

Traders can make a lot of money if you’re smart and agile, defensive when you need to be and aggressive with precision.

But you’ll need mental toughness to manage your emotions and mindset during these periods.

Do that and you can make a killing. You may not see another time like this for years as its been over 12 since the GFC of 08′.

Hence, avail yourself of the opportunity, be patient, allow for more space in your stop losses due to the increased volatility, and trade with the most impulsive moves till you see changes in the price action and order flow across a broad base of instruments.

******

This was a monster article that took hours upon hours to write and publish. Please make sure to pay it forward by sharing it with others on social media and leaving your feedback below.

Until then, good luck trading and I’ll see you out there in the field.

DraftKings Stock ($DKNG) has collapsed this week and that is not good for Robinhood traders.

Why did the stock collapse and how can you trade and profit from it going forward?

Read more