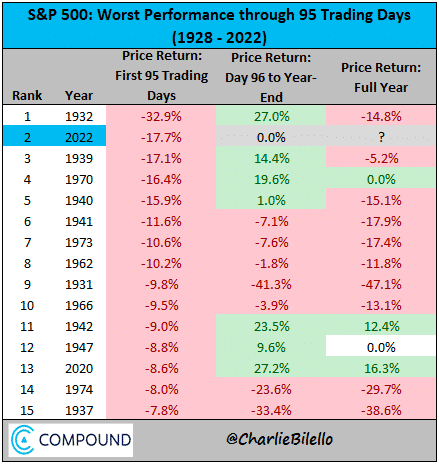
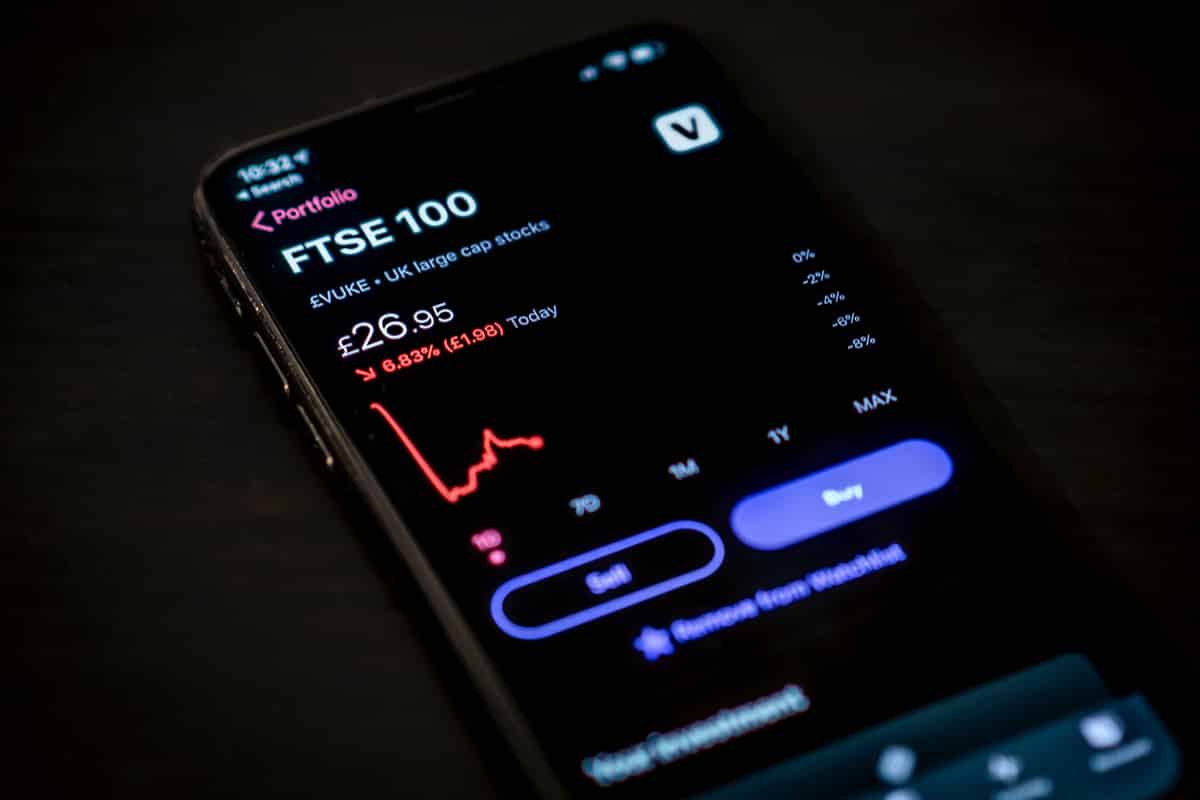
2022 is starting off as one of the worst years in the history for the S&P 500. It’s down over -18.25% and the peak to trough YTD is -20.75% as of this writing (3rd week in May).

Of the first 95 trading days for the year, 2022 is coming in the 2nd worst at -17.7%. The only year to beat it out was 1932 where the S&P 500 did a -32.9% in its first 95 trading days.

S&P 500: Worst Performance through 95 Trading Days

Source: @Charliebilello

Needless to say, many traders are feeling the pain, and this is not surprising. Fed by the incessant mantra “buy the dip” and “stocks only go up”, traders are now experiencing something they haven’t for the first time…a bear market that is actually lasting more than 5 weeks.

If you’ve never experienced a bear market for an extended period of time, it only means one thing…you haven’t been trading long enough.

In this article I’m going to share with you several tips on how to profit in a bear market, including saving some key tips for last, so make sure you read this article all the way through.

Before we jump in, just a bit of context.

My trading career started in mid-2000 which was the last 9 months before the dot-com bust. Essentially, in my first full year of trading, I saw the closing vestiges of a raging bull market, followed by one of the worst bear markets in history. I learned very early on two important things about trading:

  1. How to trade in bull and bear markets
  2. “stocks don’t always go up”

Now after having a professional trading career on the buy and sell side (Wall Street broker + Hedge Fund trader), I’ve seen a market crash or major market sell-off every two years.

Hence, below are some of my most important tips to trading in a bear market. Read them many times over and learn these well because they can help you a) avoid losing all your money and b) teach you how to make money in a bear market.

Tip #1: Why Markets Sell-off Faster Than they Buy-up

If you want to trade a bear market, you have to understand how the price action behaves differently in a bear versus a bull market.

There is a famous saying on Wall Street the “markets take the stairs up and the elevator down”. This means bull markets tend to go up slower than they go down in bear markets.

Why?

Most will say “because of fear and psychology”. While this is true, it’s only a partial truth.

Yes, when you are afraid, you will act faster (read: hammer that sell button when your stocks are crashing), versus acting slower when markets go up (“I’m good, stocks only go up” = complacency).

But this misses some other critical market dynamics as to why markets sell off faster than they buy up. And this has implications for how you can avoid taking big losses.

One of the most important reasons why markets sell off faster than bull markets go up is when prices reach their peak and start to sell off, you (and likely everyone else) are generally at your highest level of leverage.

If a stock has been going up for one, two maybe three years, did you just buy once and hold over those three years? No…you likely bought several times, thus increasing the size of your position (and thus leverage).

How to Trade Profitably in a Bear Market 01


If you buy a stock 1x with 1000 shares at $50, when that stock sells off after a bull run, every $1 drop is only $1000. However, if you bought 1000 shares when the stock was at $50, then added another 250 shares at $60, then another 300 shares at $70, and another 200 shares at $80, along with another 100 shares at $90, and another 150 shares are $100, when that same stock sells off $1, that $1 sell off isn’t a $1000 loss. It’s an $2000 loss! That’s double the loss in your account for the same $1 sell off in the stock.

As a whole, bear markets rarely (and I mean RARELY) happen when there is low leverage in the market because pullbacks don’t cause huge losses and dealers often are in positive gamma (whereby they buy the dips and sell the rips as a natural part of their option dealer hedging activities).

The bear’s claws only inflict a small flesh wound.

However, at the end of a bull run, when you (and everyone else) are levered up, the same cut from the bears claws is no longer a scratch, but = a gaping wound that needs a tourniquet and triage fast or you’ll bleed out.

It’s why @meetkevin (one of those real estate agents cum-youtubers, cum-financial analysts???) lost $12 million in 90 trading days.

Forgive me for saying this, but how can you call yourself a good stock investor, or ‘financial analyst’ if you lost 2-3 years of youtube income (your main income) from your stock trades in 90 days? IMO, people like this should not be allowed to give any stock investing or trading advice, but I digress.

The final points on tip #1 are:

  1. Markets rarely crash when leverage is low
  2. Markets can (and often will) sell-off aggressively when leverage is high
  3. You will lose most of your money when you are the most levered
  4. And therefore…always watch your leverage

Hence, if you want to trade profitably in a bear market, avoid being over-levered. All it takes is one trade going against you to create a massive loss.

Tip #2: Volatility Increases in Bear Markets

The second major bear market I ever traded was the 2007-2009 GFC (great financial crisis). The stock market peaked in July 2007 and lost about 21% over the next 61 weeks. It then proceeded to lose 25% over two weeks!

From every bear market I’ve traded, and every market crash I’ve seen, volatility is generally a) calm heading into the top, b) starts to increase as the bear market gains traction, then c) skyrockets when the capitulation happens.

Thus, volatility tends to increase markedly during bear markets.

Why does this matter to you as a trader?

  1. If you are highly levered, the volatility (amplitude in moves up and down) can increase your losses in a short period of time
  2. You will need bigger stop losses to account for the bigger swings
  3. What seem like bull rallies are just volatile short covering rallies

We’ve already covered why you need to avoid being highly levered during these times. The second point is straight forward because a typical daily move in a sleepy bull market will seem like child’s play in a volatile bear market. 2% moves do not often happen much in the S&P 500 during a multi-year bull market, but they can be quite common in a bear market.

Hence, you will need to adjust by a) having larger stop losses in terms of how far you expect the market to move, and b) reduce your position size to accommodate for the larger stop loss.

The last point from the list above (#3) is important because it requires perspective. In a consistent bull market, a 10% rally over two weeks is rare. In a bear market, this may simply be a short covering rally, so don’t get fooled into thinking a sharp rally means the bull market is back.

Tip #3: Control Risk Per Trade & Have A Max Risk Per Month

Along the lines of widening stop losses and adjusting your position size, controlling your risk ruin and having a max risk per month (read: guardrail) will help you from digging too deep a hole.

Remember, losing 50% on your account means you have to generate a 100% return, just to get back to break even. That means you have to work twice as hard just to recover your losses should you take a big hit.

To avoid this, control your risk per trade to a fixed % of your account each and every trade.

The bottom line is, you don’t know if you’ll win or lose your next trade. If you did, you’d risk more on the next trade you know you’ll win, and either a) risk less on the next losing trade, or b) not trade it at all.

If you don’t know whether you’ll win or lose the next trade, how can you control risk or position size properly? The answer is – you can’t! Thus, you need to risk a fixed % of your account on each and every trade.

NOTE: We recommend 1% per trade, but you’ll need to figure out your risk of ruin to determine what % you should risk per trade.

Having a small fixed % risk per trade means you never have to take a big loss on any one trade. You live to hit the buy and sell button another day.

How to Trade Profitably in a Bear Market 02

Source: Dylan Calluy

Along the same lines, you should have a guardrail to make sure you don’t cause too big of a loss on any given month. This is the red-line whereby if you lose x% in a month, you stop trading, no if’s, and’s or but’s about it.

Think of your worst losing month over your entire trading career. Now imagine if you stopped trading after you hit -5%, or -9% that month? How much would you have saved if you had stopped trading at that point?

Thus, install a cut-off valve that insures you don’t blow a gasket and wash an entire account down the drain.

Tip #4: Learn to ‘Sell the Rip’ and Get Bearish

Ever noticed how a stock could beat earnings, beat on revenue, have great forward guidance, and still sell off?

That’s because of one thing – order flow. If the order flow in the markets is dominantly bearish, it doesn’t matter the ‘reason’, the market is going to sell off.

It doesn’t matter if ‘sentiment’ is dominantly bullish, if the flows are bearish, the markets will sell off.

Period.

You don’t go out to the ocean, notice the waves are breaking left and say “Yeah, I’m going to try and surf where none of the waves are going.”

That would be stupid. The same goes for trading.

In a bear market, the order flow is predominantly on the sell side. Bears are in control, so don’t be an idiot surfer and think you can surf where there are no waves.  Surf with the waves!

In a bear market, don’t blindly follow the mantra “buy the dip”. Instead, sell the rips. Trade with the dominant order flows and you’ll be trading with the largest flows in the market.

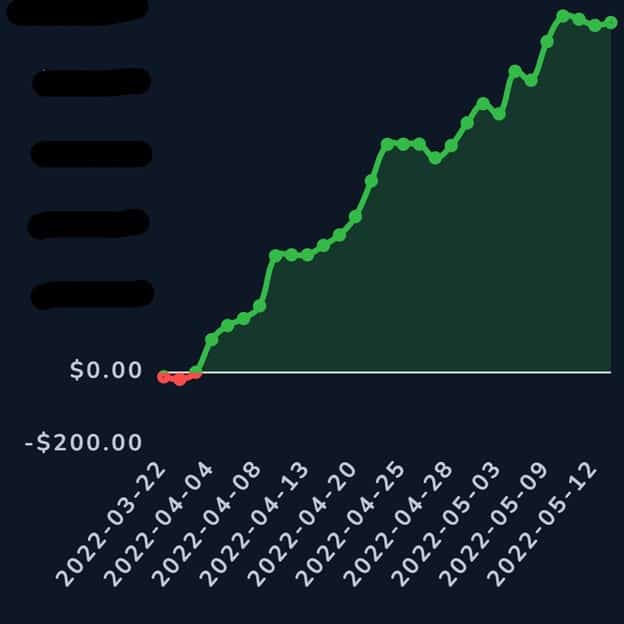
Below I’d like to show you the P&L of one my students over a 30 day trading period whereby the SPY lost 12%.

Student's P&L 01

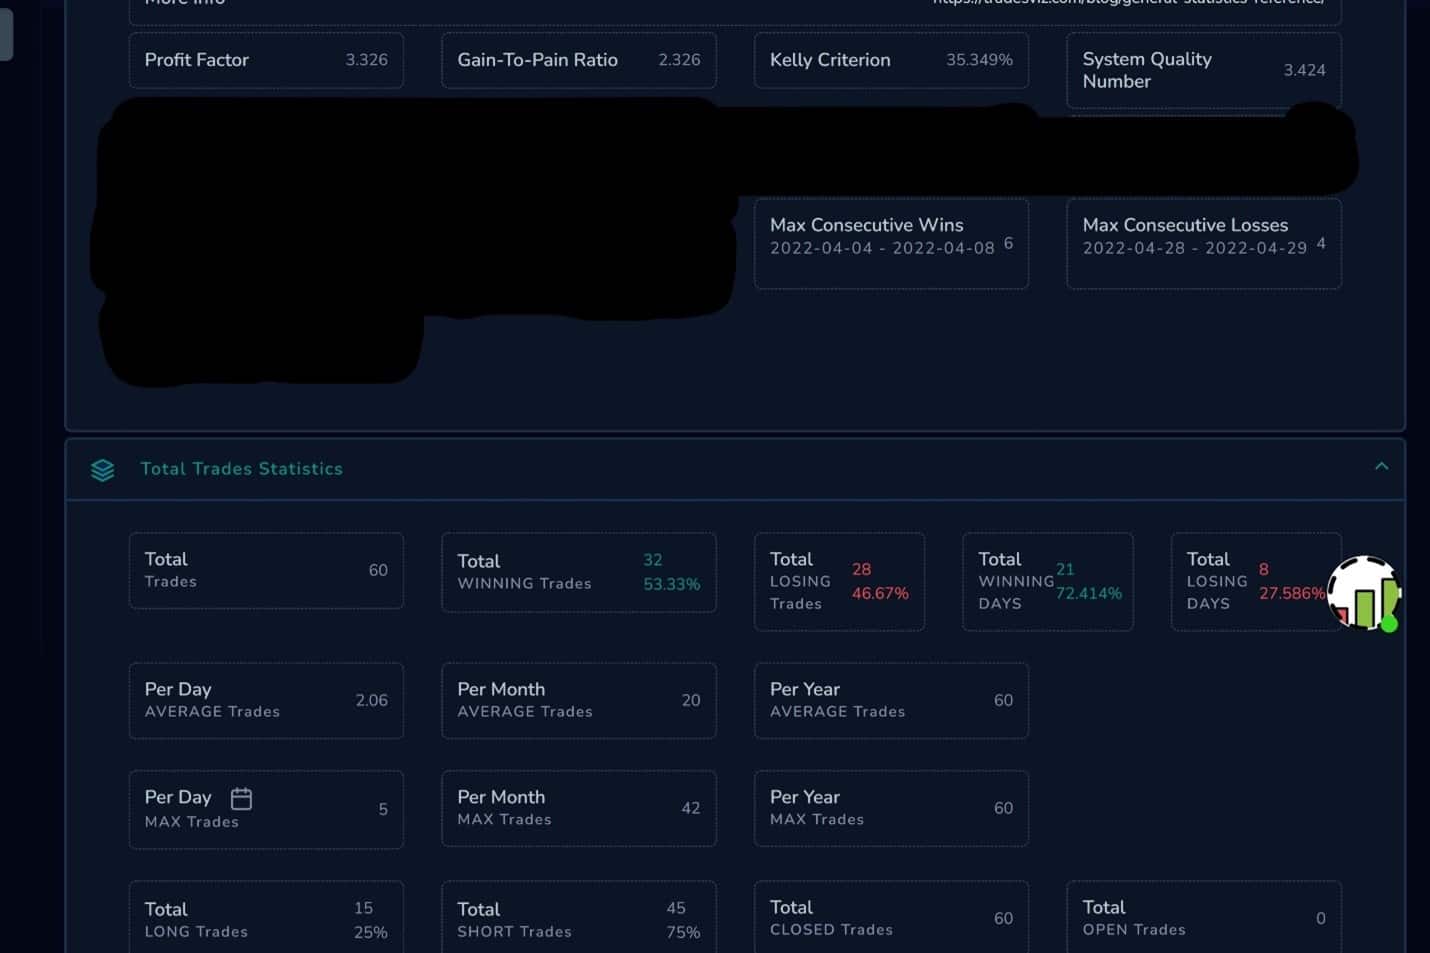
And his stats during this period.

Student's P&L 02

Do you seem him swinging for the fences? No, he’s controlling risk on each trade.

Do you see any major pullbacks, even though he was only 53% accurate and had 8 losing trading days over that 30 day trading period? No, he risked a fixed % per trade and never was in danger of exceeding his max risk.

You’ll also notice he was short (or selling) on 75% of his trades instead of “buying the dip”.

This is consistent trading with someone who trades the price action and order flow as it appears on his charts.

I’m guessing the majority of traders who have been buying the dip in 2022 have been losing money, while those selling are making money.

Trade with the dominant order flows.

NOTE: if you want to learn how to read the price action and order flows in the market, check out my Trading Masterclass whereby I teach you how to read the price action and order flow on any time frame, without indicators!

Tip #5: Understand How Option Flows Influence Price Action

Ok I just got done talking about order flows, but there’s another aspect to these order flows. The options market has become huge. It’s now surpassing share volume on most stocks and indices on a regular basis.

That means option flows are often directing the price action of your favorite stocks.

Hence, if you want to know why the stocks are moving the way you do, you have to understand how option flows move the price action each day.

Option dealers and market makers are hedging positions every day. And in bear markets, dealers (due to their hedging activity) will have to sell shares as the market falls.

This reduces liquidity, which further exacerbates the sell-off. Hence, its just another reason why bear markets are faster than bull markets.

It’s too much to go over all the ways option dealers and market makers hedge in all situations, but I did do a presentation at the Fintwit conference in Las Vegas recently whereby I cover some of the ways option dealers and market makers hedge, along with how this affects the markets.

After you watch the full presentation, it should start to make sense why the markets move the way they do.

It should also become obvious on why you need to learn about option order flows and how they influence the price action daily.

By doing so, you’ll be trading more in line with the dominant order flow in the market, and find stronger support and resistance levels to trade from.

If you’d like to learn how option flows move the price action and learn from me live, check out the Benzinga option school whereby I teach classes Monday through Friday on how option flows move the market and how to find the best setups.

How to Trade Profitably in a Bear Market 03

Source: Jamie Street

In Closing

I often forget my first year of trading had a bull and bear market, so I never felt uncomfortable trading bear markets. In fact, most bear markets became some of my most profitable moments as I learned to take advantage of the volatility and change in price action.

However, if you haven’t been trading that long, and have only really known a bull market like we had the last decade, I can understand how this would be uncomfortable.

The first thing to do is relax so you can get your mind straight and trade the market as is. This means:

  1. Understanding how bear markets move faster than bull ones
  2. Thus, bear markets are more volatile
  3. Because of this extra volatility, you need to have wider stops and control risk
  4. You need to trade with the dominant flows and exorcise the ‘buy the dip’ mentality
  5. While learning how option flows impact the market and learn to trade with them

Now if you’d like to trade live with me, join my classes daily (Mon-Fri) and get feedback on your trades, check out the Benzinga option school where you get access to all that, along with my weekly newsletter, trade ideas and morning market commentary.

There’s a lot more I’d like to cover in this article, such as what specific strategies to use, how to find the best entries and exits, along with how to manage trades, but this article would easily become another 10,000 words, so it is my hope the 5 tips above give you a different perspective on bear markets, and how you (like my students) can profit from a bear market if you learn the right skills.

I hope to be working with you soon and helping you become my next profitable trader.

We have been getting a lot of questions from newer traders to forex on what is price action trading, and how one can utilize a forex price action strategy.  What we are going to cover is the traditional definition of price action, how we approach it differently than others, and how one can trade price action in the forex market.

What is Price Action Trading?

In the most traditional and technical sense, price action is simply price’s movement over time. This could be on any time compression from the 1min up to the weekly chart.  Any price fluctuation for any instrument is a form of price action. Forex price action trading is the science and art of trading these price fluctuations over time with little or no indicators. By learning to read price action and price’s movement over time, one can;

  • see where the institutional players are heavily involved
  • where they are driving the market
  • where are key support and resistance areas
  • where to find precise entry and exits
  • what is a key breakout
  • how to catch reversals
  • tops and bottoms
  • get into trends
  • what are impulsive vs. corrective moves
  • what kind of market environment you are in

and more.

This is why learning to read price action can be a critical component of one’s trading.

However, based on one’s approach to it, there are key differences in how one can trade it.

Various Ways to Approach Price Action

For the most part, all of the vanilla forex price action trading techniques you find out there are based upon patterns. Some of these patterns can be flags, triangles, double tops and bottoms, pinbars, inside bars, etc.  But if you are trading these patterns just because they are a pattern, then you are really failing to understand what price action is.

The proximate driver of price action is order flow which is the total summation of all buy and sell orders that are executed in the market.  It does not matter whether the market is moving because of a fundamental or technical reason.  Order flow is the most consistent force which causes the price action to change.

Because we do not have direct access to order flow, we have to learn how to read its sibling which is price action.  Price action has the fingerprints of order flow all over it. Since the most common driver of market movements come from order flow, then we have to learn how to read price action. This is how we approach it.

We trade forex price action strategies and patterns, but we do so with the key understanding that all price action is the result of order flow. And since order flow is what moves the markets, then we have to learn how to read order flow through price action. This how you can take your trading to the next level.

Trading Price Action

Price action trading in the forex market is a learnable skill that anyone can do.  With the proper training, mentor and study, one can successfully utilize a price action strategy.  In the forex market, as it is such a highly liquid market, trading becomes a lot easier because as you have more liquidity, you have a more technically pure market. There are various ways to trade price action in the forex market and we will share one method while explaining the order flow behind it.  We will compare this to trading the pattern by itself and show you how it fails.

Trading Just the Pattern By Itself

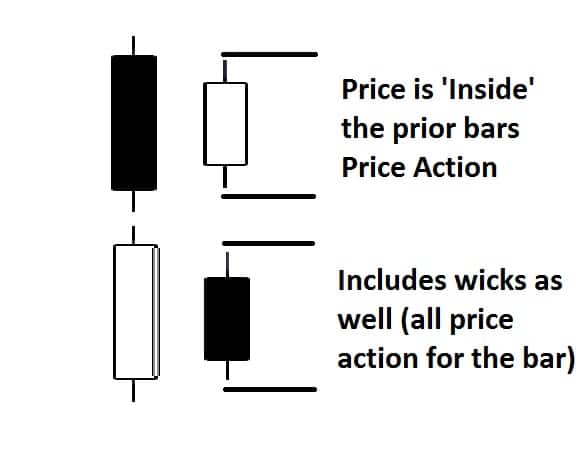
An inside bar pattern is a common price action pattern whereby all of the price action (body and wicks) of a candle are inside the range of the previous candle.  Here is a picture below showing an inside bar pattern:

Inside Bar Example

Now inside bars can be traded as both reversal and trend continuation techniques.  If one was just trading the pattern itself without understanding the order flow behind it, one could be seriously misled into trading a lesser inside bar simply because it was a pattern.  Just because a pattern or formation shows up does not mean we want to trade it.  We will give you an example.

Not All Inside Bars Are Created Equal

Lets say it is 12hrs before a major announcement, or a Friday, or a holiday of sorts. During such events, order flow diminishes as the institutional players leave the market until the risk events are over.  In these times, many inside bars can form since there is nobody in control of the market and no heavy liquidity or order flows.  If you were just trading inside bars because an inside bar showed up, you could be trading during a non-optimal time because the market will not take a direction till after the risk event. So this is one example of how trading a pattern because it shows up could be harmful to your trading.

This is why it is critical to understand the order flow behind the market and why the price action is forming the way it is.  This way you can determine who is in control (the buyers or sellers). You can determine if it is a powerful breakout or a false one. You can determine if the trend will likely continue or not. All of these are critical to trading price action and understanding how the order flow is creating such variables.

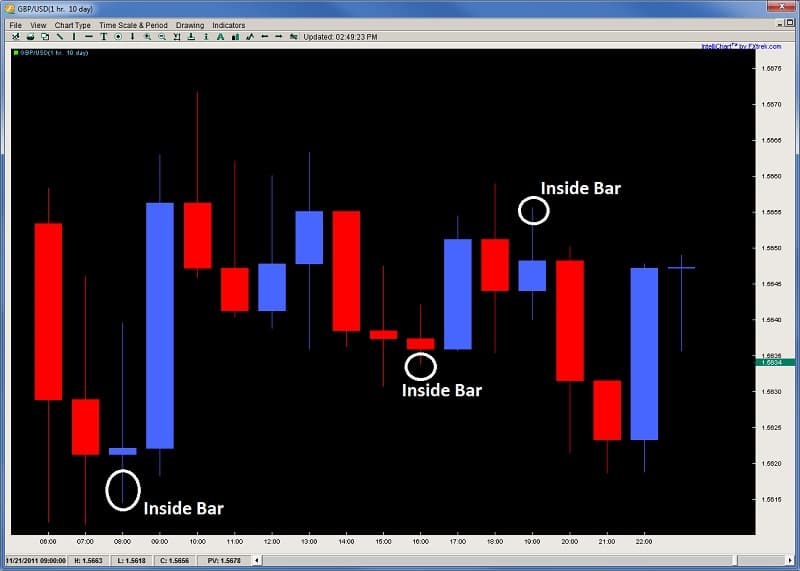
Below is a chart example of how not all inside bars are created equal and why you need to avoid some of them. Take a look at the forex price action trading chart below:

Chart showing how not all Inside Bars are Created Equal

In this price action trading chart, you are seeing the price action from 9am EST up to 1am EST (a total of 18hrs). Take a look at all the inside bars above. Here you have a total of 3 inside bars, yet they produced no special reaction. Price was stuck in a virtual 50pip range for over an 18hr period.

If you were just trading inside bars because it was a price action pattern, you would have had many false breakouts and likely many losing trades.  Now lets take a look at another example of how an inside bar can be used for a successful trade by reading the order flow behind it.

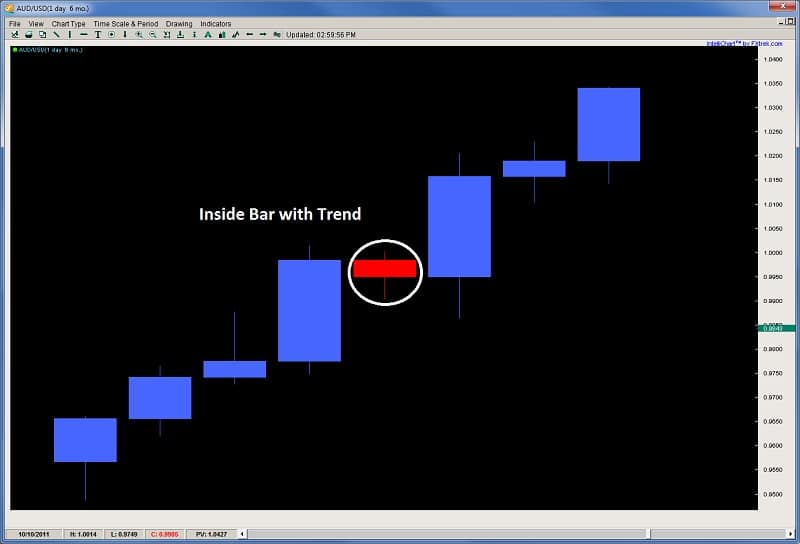
Taking a look at the chart below, we can see an inside bar forms after a very powerful with trend move. There could be several reasons for this but lets read the order flow behind it.


Chart showing Inside Bar forms after Very Powerful With Trend Move

  1. Price has been climbing for 4 days in a row suggesting the buyers are clearly in control.
  2. The last candle was a very strong candle and the largest in this move suggesting strong participation
  3. The inside bar comes right at the parity level suggesting the market is respecting it
  4. However, the selling in the inside bar is quite weak communicating the sellers have little sway
  5. Thus, the buyers are likely to continue the trend after this weak push back

So empowered with all this information on learning how to read the order flow behind the move and inside bar, we can make a much more informed decision on trading this inside bar.  We can trade this as a with-trend continuation move knowing the buyers are heavily in control.  And as we can see, the market climbed for over 300pips over the next three candles.

In Summary

Forex price action trading in its most technical form is price’s movement over time.  This is for any instrument on any time frame from tick charts up to monthly charts.  All price action is the result of order flow which is the total summation of all buying and selling.  All the price movements we see on the chart are derivatives of order flow.  In other words, order flow is the cause of all price movement and its sibling is price action. Since we do not have access to aggregate order flow in the forex market, learning to read price action and the order flow behind it is key.

In trading the forex market, we can trade price action patterns by themselves, but we can easily see how dis-empowering this is. Patterns by themselves are meaningless unless we can read the price action and order flow behind it. When we can read the order flow, we can determine where the institutional players are buying and selling, the speed of buying and selling, where are key support and resistance areas, when the market will continue the trend, when it will reverse and when key breakouts are happening. All of these are critical to the forex price action trading strategy. Our goal must be to learn how to read price action and the order flow behind it.

For those of you wanting to learn how to read price action and the order flow behind it, take a look at our Trading Masterclass course, where you will learn rule-based price action systems to trade the market.

Want to Increase Your Profitability? Try this powerful approach

If you want to find high probability trades, and skip those with a low probability of working out, you’ll need to develop a core skill. Does this sound interesting? Then keep on reading. What is this skill you ask?

I am talking about trading with price action context.

Good Trading Decisions Are Based Upon Context

First, let’s define the word ‘context’. Context = understanding and approaching a situation based upon the ‘context’ (or environmental variables) around it.

In price action, the ‘context’ is a way of describing the overall environment, and using that to help you trade with the underlying order flow. We have 3 filters to understand the price action context in our Trading Masterclass Course. For the purposes of this article, we’ll talk about impulsive and corrective moves.

Impulsive and Corrective Moves

Now I’ve already done many videos and articles on impulsive and corrective moves. For a more in-depth study, you can watch this video on impulsive and corrective price action, or this article on impulsive and corrective moves. But to sum them up briefly:

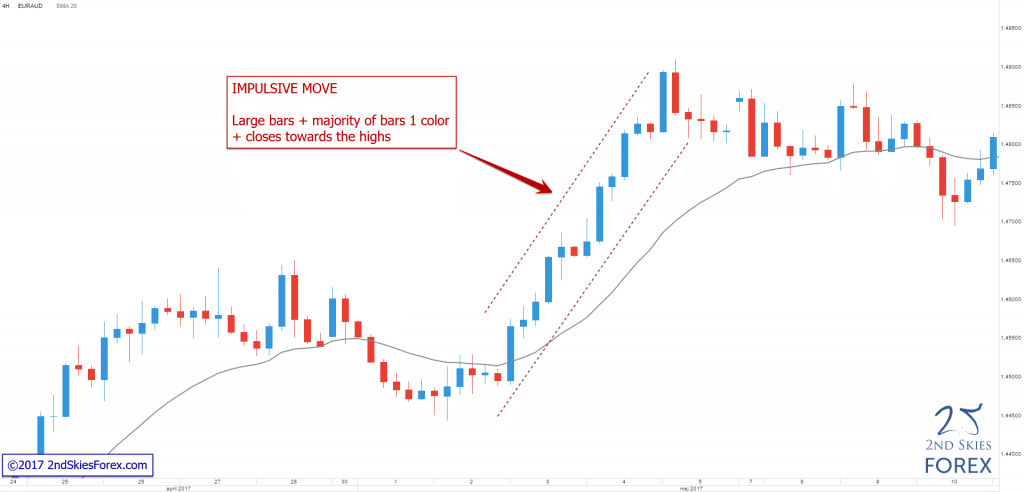
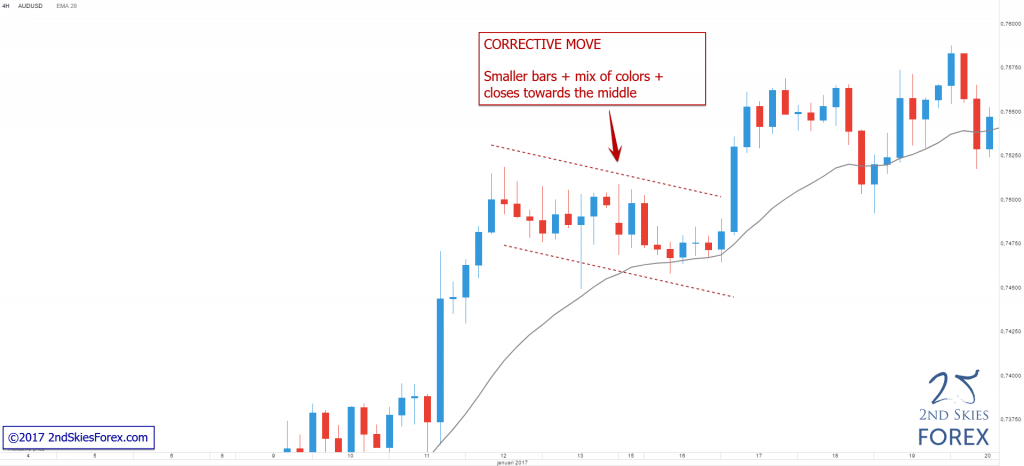
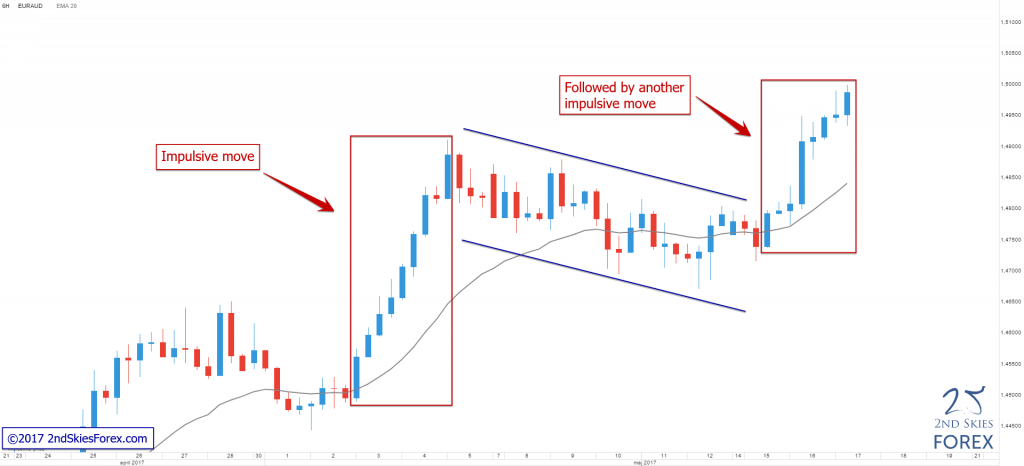
Impulsive moves = large bars + majority of bars 1 color + closes towards the highs/lows

Corrective moves = smaller bars + mix of colors + closes towards the middle

An example of an impulsive move is below:

Impulsive move 2ndskiesforex

And an example of a corrective move is below:

Corrective move 2ndskiesforex

As a whole, impulsive and corrective moves communicate a lot about the price action context, such as the underlying order flow behind it.

During impulsive moves, the order flow is relatively ‘imbalanced’, meaning it’s dominant towards one side (buying/selling) which causes strong directional moves.

During corrective moves, the order flow is relatively ‘balanced’, meaning there is no strong winner between the buyers/sellers, hence the market goes mostly sideways.

Using Impulsive and Corrective Moves to Discover the Price Action Context

Now that we understand the basics of impulsive and corrective moves, we can use them to discover the price action context of the market.

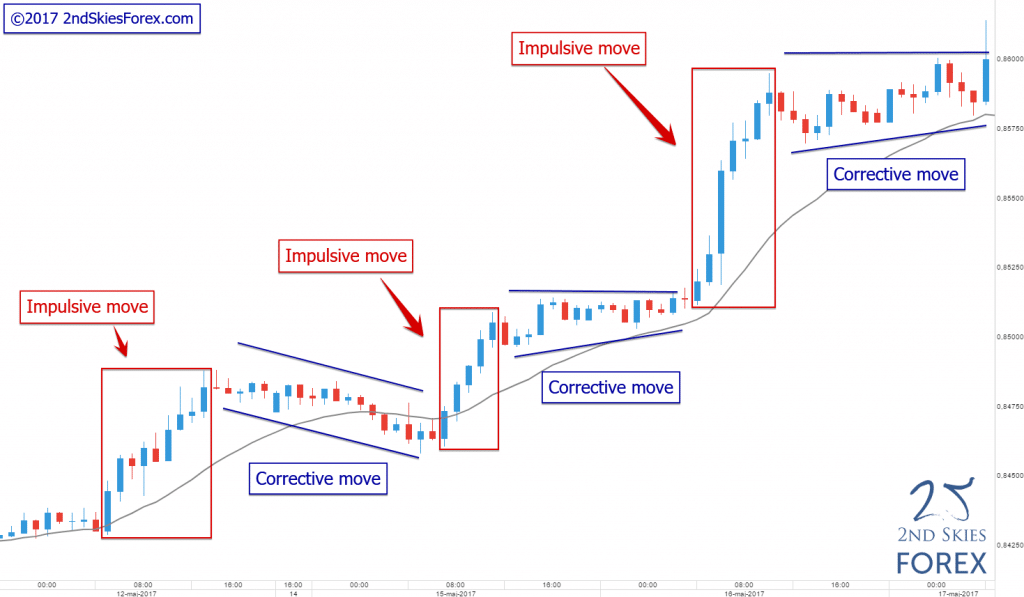
As a general rule, an impulsive move (the majority of the time) is followed by a corrective move. If the impulsive move is with trend, then the next move after the corrective move will more often be an impulsive move in the same direction.

Two good examples of this are below:

Example 1: Impulsive and Corrective Moves

Impulsive & Corrective moves 2ndskiesforex

Example 2: Impulsive and Corrective Moves

Impulsive & Corrective moves 2ndskiesforex

Now what do impulsive and corrective moves teach us about price action context?

They give us an underlying sense of what the dominant order flow is. If you see a potential trend in place, along with a good series of impulsive and corrective moves, then you can feel confident the overall price action context is bullish, and thus you should be looking to buy more often than sell.

Now instead of waiting for a pin bar, fakey or some other 1-2 bar confirmation price action signal, look at the impulsive and corrective moves for trade opportunities as they will often offer you many.

You don’t need a 1-2 bar candlestick pattern to know if the market is bullish – just determine the overall ‘context’, and trade with the impulsive and corrective structure as much as possible.

NOTE: If you want to learn how to find high probability trade setups using impulsive and corrective moves, check out our Trading Masterclass course.

The bottom line is – many of those 1-2 bar candlestick patterns (pin bars, fakey’s, inside bars, etc) don’t form that often. Yet if there is a strong trend in place, why are you waiting for a pattern that may never materialize, when the overall order flow is already bullish?

Get into that trend and make some money. Just make sure the price action context is in your favor. A great way to determine this is to make sure you can read the impulsive and corrective moves.

The most favorable situation is when you are trading in the direction of the impulsive moves (not against them) because you’re trading with the dominant order flow in the market. It also means you can make money faster because impulsive moves travel farther and faster than corrective moves.

Hopefully you can now see how price action context, particularly spotting the impulsive and corrective moves, can give help you find better trade setups.

Want To Learn More About Price Action Context?

While impulsive and corrective moves are a crucial part to determining price action context, they are not the whole. We have two other key factors to determining price action context and what the dominant order flow is in the market.

To learn more about these two, check out our Trading Masterclass Course where we teach you higher, lower and multiple time frame context with clear rules to understanding them. In fact, our entire 1st section of lessons is dedicated specifically towards understanding price action context.

To get access to these lessons within minutes, click here. Inside the course, you’ll also learn how to read other critical (or more advanced) price action structures and find more trade setups.

Keep in mind, trading with price action context is a skill that works on any instrument, time frame or environment. If you’re learning a price action strategy or approach that only works on specific time frames, then it’s a limited strategy that doesn’t really understand price action or PA context.

Until then – I look forward to your comments and feedback.

Not everyone is able to sit at the computer for hours a day and trade.  In fact, many of you have full time jobs, family lives that keep you busy, yet you still want to be able to participate and trade in the market.

A lot of times, these are the emails I get from people, whereby they have the lives above, and only have a couple hours to trade after work.  You don’t want to actively manage positions throughout the day because of work and are looking for a structured way to trade.

If this resonates with you and your situation, I recommend trading the higher time frames such as the H4 or daily charts.

Why?

Generally, the lower the time frame, the more detailed analysis you have to do, more variables you have to incorporate + the lower time frames require more attention due to price moving a lot faster.

More details + more variables = more time needed to make trade decisions on top of the need to monitor the charts more frequently.  Thus not a favorable scenario if time is a very limited commodity for you.

The faster price movement also requires you to make many important decisions in a fraction of the time that you have at your disposal when trading on a higher time frame like the 4 hour or daily chart which significantly increases the cognitive load on a trader.

What is cognitive load you ask? Cognitive load refers to the total amount of mental effort being used in the working memory, similar to the working memory of a computer and refers to how much information an individual can consume/process in a given period.

A greater cognitive load means that you’ll exhaust your energy at a much faster rate which in turn can have an effect on your decision making.

Aspiring traders often are attracted to trading the lower time frames because they offer more ‘action’. But since they are not experienced enough, they are often unable to cope with the increased cognitive load, which renders them paralyzed at times or leads to very bad trading decisions.

Thus, trading the higher time frames is better suited for beginners and those with limited time available because

a) the skills of beginning traders aren’t fully automated yet and
b) the higher time frames require less time/attention.

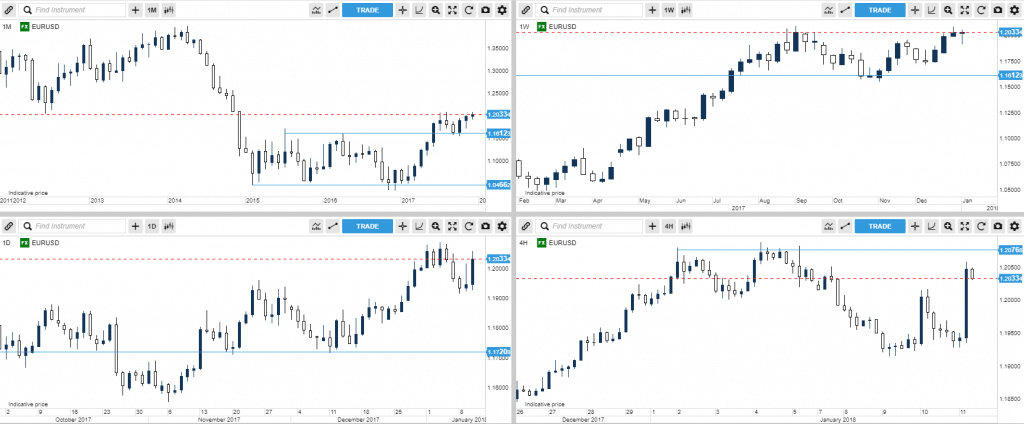
To clarify, here is what I consider the higher time frames:

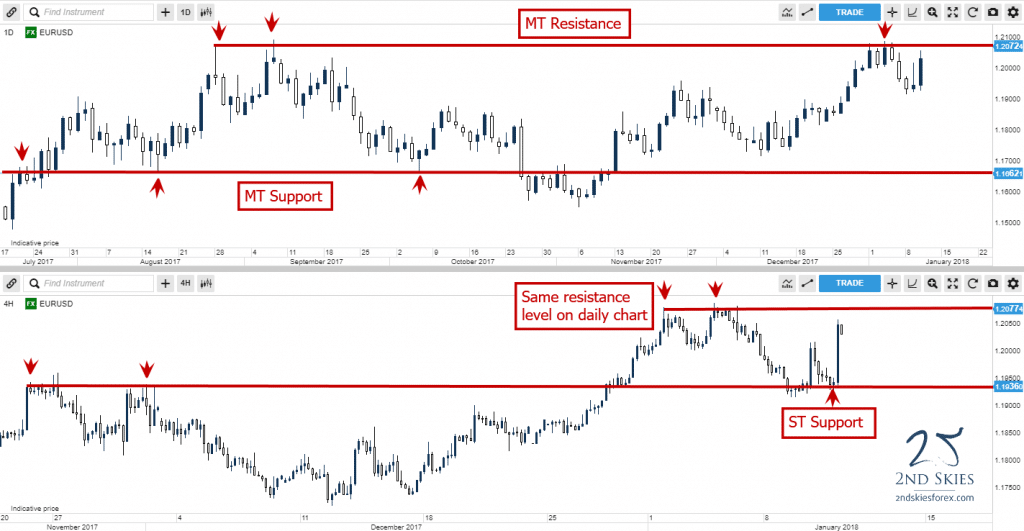
Monthly/Weekly/Daily/4hr on EURUSD

4 Hour & Daily Forex Strategies 01

The overall guide on how to relate to this is:

  1. Look at the monthly time frame chart if you are looking at several years+ worth of price action, and want to hold trades for about a year or more (often called ‘position trading‘).
  2. Look at the weekly time frame chart if you are looking at just a few years’ worth of price action, and want to hold trades for several months at a time, perhaps close to a year
  3. Look at the daily time frame chart if you are looking to do ‘swing trading’, and want to hold your trades for a couple days, up to a few months (perhaps quarter)
  4. Look at the 4hr time frame chart if you are looking to do swing trading, and want to hold your trades for a couple days up to a few weeks (perhaps a month)

NOTE: These are general ‘guidelines‘. They are not perfect rules.

Now, how do you trade price action on the higher time frames?

If your primary time frame for trading is the 4hr charts for example, then most likely you’re doing ‘swing trading‘. In essence, you’re trying to capture larger ‘swings’ in the market.

Many traders (perhaps like yourself) want to trade the higher time frames and are wondering what daily forex strategies you can use.

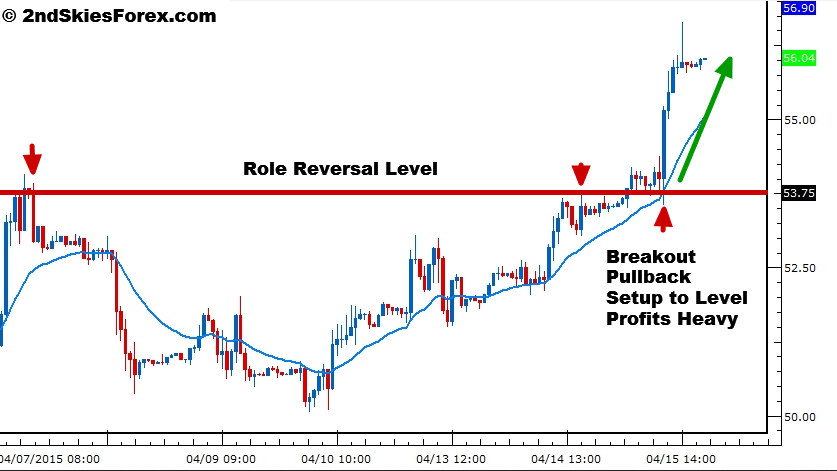
There are many strategies we teach in our trading course, but one I’d recommend is a role reversal setup (or breakout pullback setup).

4 Hour & Daily Forex Strategies 02

This strategy is best used when you are trading with trend.

Below are 3 major components for a breakout pullback setup:

  1. find the overall price action context and trend on the daily time frame
  2. find a key support level (for bear trends) and resistance level (bull trends) that has been touched two times before (at a minimum)
  3. wait for the market to breakout and pullback to the level

If you’ve done those 3 things, you’ve likely found a good role reversal – breakout pullback setup.

There is more to this strategy, (what type of trend you are in, which are key support and resistance levels, what is the best price action context to trade breakout pullback setups, etc.), but you have the basics.

NOTE: If you want to learn more about this strategy and how to trade it, check out my price action course where I teach you exactly how I use this strategy with my own money.

Without a doubt, you can use the breakout pullback setup on the 4hr chart (or any time frame for that matter).

Here are a few additional tips you can use when swing trading the 4hr charts:

  • Have the daily chart as your ‘higher‘ time frame context. When in doubt, try to trade with this the most.
  • Don’t expect the market to go straight to your target.
    NOTE:It may require a few pullbacks before it gets there. Eventually with enough skills in reading the price action context, you’ll learn when those pullbacks are part of the trend, or leading to a major reversal.
  • Mark your support and resistance levels on the daily & 4hr charts.

Below is an example of how to apply support and resistance:

4 Hour & Daily Forex Strategies 03

In Conclusion

For those of you who have very busy lives, with a full-time job, family, and general commitments that you are unable to sit and trade for hours, there is a way for you to trade and participate in the markets, while not having to stay up all night.

For this, I recommend trading using the higher time frames, allowing you to be engaged in the market and able to make money without having to sit and monitor charts all day long.

I hope this helps for all of you who fit into this category and that you found this article informative and useful.

Please make sure to leave a comment below and your thoughts on it

Kind Regards,
Chris Capre

If you want to learn how to read candlestick charts, find high probability candlestick patterns, and learn to read the price action + order flow, then make sure to watch this video.

In this video on candlestick chart trading, I cover some of the most important patterns you can learn to read in the charts and price action.

I further explain in detail two of my core candlestick chart patterns for trading forex, stocks, commodities, global indices and CFD’s.

⏰TIMESTAMPS⏰

0:27 – all trading decisions will come down to this

1:00 – the most proximate driver of price action is order flow

1:57 – why I don’t trade candlestick patterns and instead trade this

2:36 – my most important model for trading candlesticks and price action

3:40 – what is an impulsive move?

8:36 – what is a corrective move?

13:16 – live trade in the AUDJPY

17:48 – live trade Swiss Index (SIX)

Read more

What’s Inside?

  • How to find key support and resistance levels in any market
  • How can I trade support and resistance zones, either using end of day price action or intraday strategies?
  • Why is it hard to find good support and resistance levels to trade?

If there is a subject which repeats itself amongst traders who are struggling with price action, understanding and trading key support and resistance levels would be near the top of the list.

Common questions struggling traders ask are:

  • How do I know if a support or resistance level will hold?
  • If I have a full time job, and am trading end of day (or daily/4hr time frames), how do I choose the best support and resistance levels?
  • How can I find the best support and resistance levels for trading?

Have you asked any (or all) of the above questions when learning trading online? Felt confused about understanding key support and resistance levels? If so, then pay attention to this article as we’re going to put many pieces of this puzzle together regarding key support and resistance levels, along with how to trade them.

support and resistance trading

Key Point #1: How Professional Traders Relate to Support and Resistance Levels

Anyone who has seen how professional traders trade know they often place their orders ahead of time and less often do market orders. A general theme that shows up is about 70+% of all institutional orders are placed at prices ahead of time, while <30% are market orders.

Now every institution and trader has their own approach. Some use price action, some use the ichimoku cloud, some use fibonacci levels, some use indicators, etc. Regardless, none of that matters.

What does matter is all of them are paying attention to key support and resistance zones. These ‘zones‘ are where they most often place their orders. Now it’s important to understand that each trader and institution has their own ‘holding time‘, meaning how long they like to hold their positions.

Traders who have shorter holding periods will often require a smaller stop. Hence they will want to get as close to the support/resistance level as possible to create the smallest stop available while maximizing their upside. Traders with longer holding times won’t require as much precision and will likely have a larger stop loss to avoid getting kicked out of minor swings to capture the underlying trend.

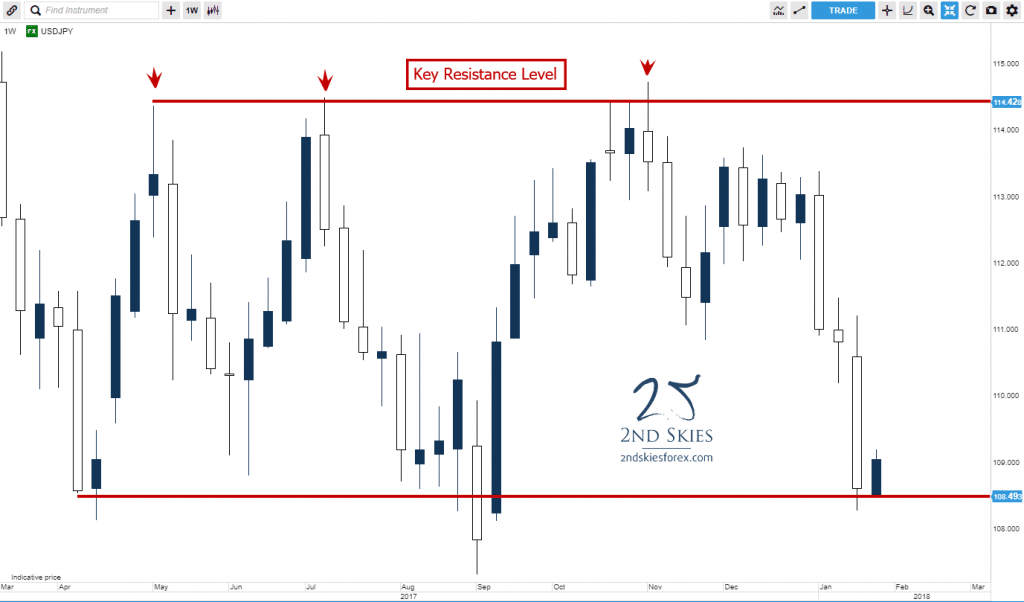
Now to give you a visual of how this works, lets look at the chart below on the USDJPY weekly chart.

usdjpy key resistance level zone 2ndskiesforex

As you can see from the chart above, I’ve drawn a line on top near 114.42 which I denote as ‘resistance‘.

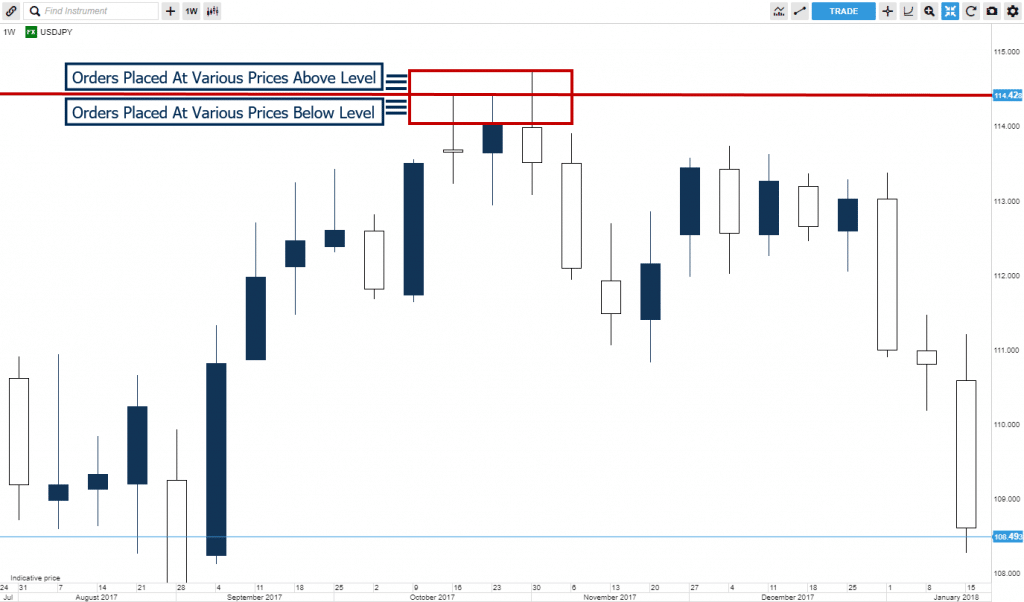
Now here is how professional traders will attack this using the next chart below.

usdjpy order flow key support and resistance levels 2ndskiesforex

If a professional trader is bearish on the USDJPY (or thinks it’s in a range), they’ll sell the pair at or near 114.42. However, as I stated above, they’ll have different holding times and stop loss sizes. So what the order flow will look like is you’ll see various orders placed below the 114.42 level, while some will be above.

In this case, because two of the 3 wicks (in the chart above) which hit the resistance level stopped on a dime, you can assume there were a fair amount of orders just below the level. What you’ll also notice is the 3rd wick pierced through the 114.42 level, either due to a) bulls trying to push through resistance and see if they can produce a breakout trade setup, or b) traders finding liquidity just above it.

If you were able to somehow see the combined global order book for these 3 candles, most likely you’d see something like below:

Sell 10m 114.00
(with various orders selling between here and 114.42)
Sell 10m 114.42
(with various orders selling between here and 114.72)
Sell 20m 114.72
(with only a few orders above, perhaps up to 115).

While this is an overly simplified description of the order flow around this key resistance level, it serves an important point. Which is, it’s important to understand professional traders will place their orders at or around key levels. The variance in how they place their orders above/below these levels creates a ‘zone‘ of orders, which defend a level, and thus create ‘resistance‘.

If the sell orders are enough to hold any bullish pressure, the pair will sell off. If not, a breakout will likely occur, or a complex corrective structure will form.

Now the key take-home point here is: professional traders who are spotting the same level/price will most likely place their orders at/above/or below said price. This is what creates the ‘zone‘ effect, so try to avoid thinking key support and resistance levels as clear/perfect lines in the sand.

Key Point #2: The Larger The Support or Resistance Zone, The Greater the Variance in Orders Behind That Zone

In the prior USDJPY chart, the resistance zone was pretty small (about 30 pips from top to bottom). This makes it pretty easy to get some precision when selling at a key resistance zone.

But what happens when the support or resistance zone is much wider, say 100 pips or more? How do I trade that? Great question which I’ll answer below.

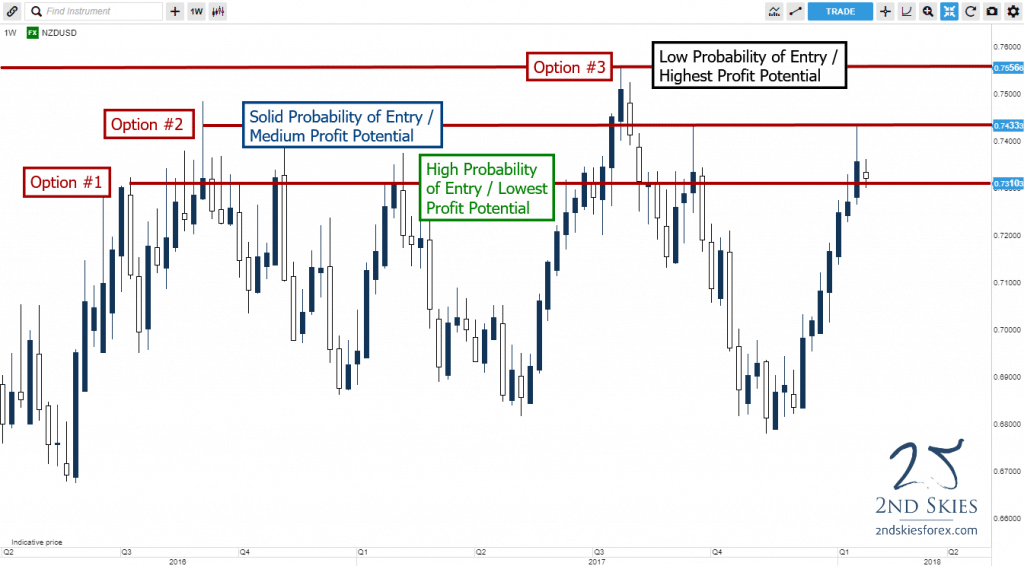
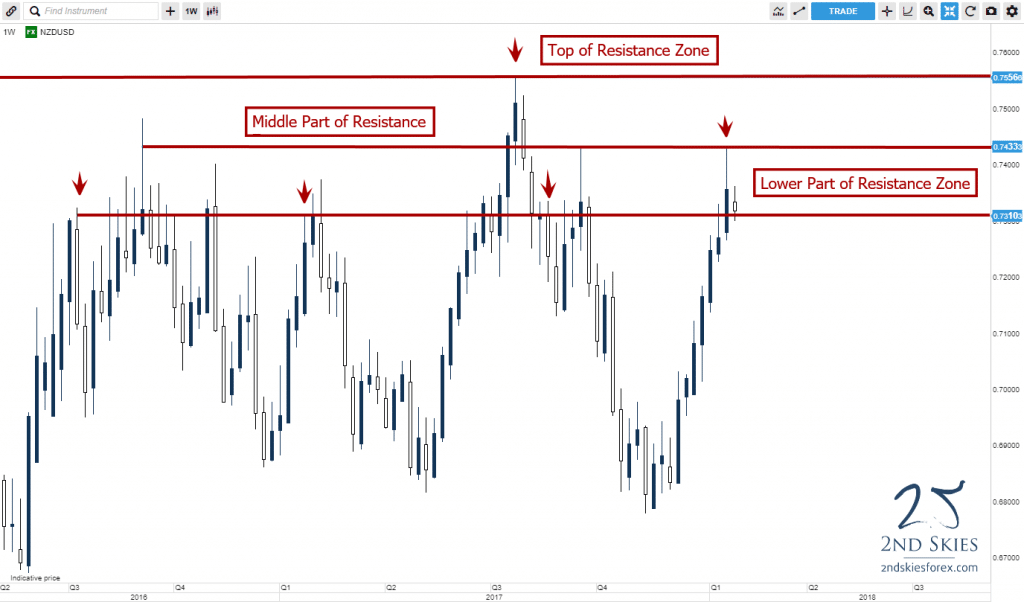
Meet the NZDUSD weekly chart, which currently has a wide resistance zone between .7312 and .7556, over 240 pips!

nzdusd resistance zone 2ndskiesforex

When you have such wide resistance zones, it means there is less ‘agreement‘ in the order flow between the bears in the market.

There are bears which feel .7310 is a decent resistance (as evidenced by the fact only 13 candles have closed above this since late Q2 2016). There are bears which feel strongly about .7433 being resistance as the pair has had only 2 weekly closes above this price since Q2 2016. And then there are bears which felt the extreme values for this pair should not exceed .7556. This is clearly shown since the kiwi could not produce one weekly close above this price.

So there is a lot of ‘disagreement’ specifically where resistance is, but there is agreement that this ‘zone‘ is resistance. Now anytime you encounter a zone (wide or small), you are faced with the same 3 trading choices when it comes to shorting it:

Support & Resistance Zone Trading Option #1: If you want the highest probability of getting in the trade, you’ll want to target the bottom of this resistance zone (flip this for support zones…e.g. top of the zone). By getting in a part of the resistance zone frequently touched, you’re increasing the probability you’ll get into the trade. The downside = a wider stop loss, which also reduces your potential profit.

Support & Resistance Zone Trading Option #2: If you want a solid probability of getting in the trade, while not wanting such a huge stop loss, you’ll want to get in somewhere inside the zone (ideally closer to the middle). This will slightly decrease the probability your trade will activate, but will increase your profit potential since you’ll have a smaller stop loss and thus greater target.

Support & Resistance Zone Trading Option #3: If you want the highest profit potential, then you’ll want to get in at the highest point in the zone (.7433 or above). The upside here is you can have the smallest stop loss possible, and thus the greatest profit potential. The downside is your trade is less likely to get activated (i.e. .7433 was only hit 4x since Q2 17′, while .7310 was hit almost 25x).

To clarify, I have a chart below for you using the same Kiwi pair to demonstrate this.

trading key support and resistance levels 2ndskiesforex

So that is the ‘framework‘ for how to think about support and resistance zones and how you should trade them. You’ll need to decide how you want to trade that zone based upon probability and profit potential. Neither choice is better or worse per se stylistically. You’ll have to find which of the 3 is most natural to you.

Key Point #3: Trading Support and Resistance Zones Means Trading ‘Probabilities’

I think one of the biggest confusions about trading price action using support and resistance levels is understanding probabilities, and relating to trading (or taking your trades) based on probabilities. This ‘confusion‘ has been perpetuated by a common ‘narrative‘ that you should wait for ‘confirmation price action signals‘.

confusion about confirmation price action signals

Supposedly you do this to ‘confirm‘ the level will hold, and thus be more ‘probable‘. The fact of the matter is, most professional traders have already decided what level and price they want to enter, well before any said pin bar, fakey or ‘confirmation price action signal‘ has formed.

The underlying order flow is generally clear to most professionals before these 1-2 bar candlestick patterns have even formed, so they know which direction is more ‘probable‘, along with their trade location.

And considering nobody to date, after decades, has been able to establish with a verified live trading account, or with statistics that trading pin bars off key levels gives you a greater probability the trade will work out (+ profit), this narrative is quite dubious and making traders more confused about trading key support and resistance levels. But I digress…

When you boil it down, there are two key points to understand here:

#1: Either the level will hold or not

#2: The order flow (and probabilities) are most likely in place whether a key support or resistance level will hold (or not)

“What the above means is you will never ‘know’ if the level will hold or not. You only have probabilities to work with. Hence you have to approach it ‘probabilistically’ (which negates looking for ‘confirmation’)”

The best way to determine either of the above is by learning how to read price action context and the order flow behind it. The context will create a ‘structure‘ which is reflective of the underlying order flow. 1-2 candlesticks likely isn’t going to change that, nor are they more important than an entire structure. Hence, when you can learn to read price action context and structures, you’ll be able to see which level is more likely (and probable) to hold (or not).

By doing this, you’ll be getting better trade locations than you would with any pin bar or confirmation price action signal. I demonstrate this clearly in my latest live trade video for +480 pips and +5R profit. Try to find a better entry using a pin bar (you won’t).

Hence by learning to trade without confirmation price action signals, and to understand the context in terms of probabilities, you’ll avoid missing perfectly good trades.

And if you look at my USDJPY or NZDUSD charts, you’ll see there were very few confirmation price action signals here, which = lost trades and profits.

USDJPY Weekly Chart

usdjpy key resistance level zone 2ndskiesforex

NZDUSD Weekly Chart

nzdusd resistance zone 2ndskiesforex

My guess is if you were to identify many key support and resistance levels over years and years of price action that produced great trading opportunities, you’ll see many times there were little or no pin bars, or any kind of confirmation price action signals, thus a lot of lost profits missing these high quality trades.

In Summary

So I’ve covered a lot of ground here regarding key support and resistance levels. The key points and methods I talked about above apply to any instrument, any time frame, or environment.

It’s important to note there is a lot more to understand when trading or finding key support and resistance levels. Such as how ‘clean‘ a level is, when a level is more likely to hold (or fail), what are the best levels to trade, how to find key levels using daily chart strategies, trading intraday, and more.

This is a big subject that cannot be unpacked fully (or well) in a single article. And it’s a skill you’ll need to build over time through practice, analysis and feedback from a professional trader and mentor.

Now if you want to learn more about forex trading key support and resistance levels, and improve your ability to find the best ones to trade, then check out my online price action course where we have over 5 hours of video lessons on this, along with quizzes, analysis and feedback from me and my senior students on how to find and trade the best levels.

Now Your Turn

Did you find this support and resistance level article useful and learn something new? If so, then make sure to leave your comments below, along with share/like/tweet it with others.

I’ll look forward to hearing from you.

What’s Inside?

  • What is Dynamic Support and Resistance?
  • How I can find Dynamic Support and Resistance in the forex market?
  • What is the Ichimoku Cloud?

In my last article, I talked about how forex traders can find the best key support and resistance levels. This is a critical component to understanding price action trading. But what is less talked about, yet critical for your trading is understanding and finding Dynamic Support and Resistance.

In this article, I’m going to help you understand what is the difference between ‘static‘ and ‘dynamic‘ support and resistance. From here I’m going to talk about why you need to understand dynamic support and resistance, along with give you two methods for identifying and trading dynamic support and resistance.

static and dynamic support and resistance

What is the difference between static and dynamic support and resistance?

When we talked about key support and resistance levels in our last article, you should have noticed a pattern. You should have noticed all those levels were ‘horizontal‘. While many key support and resistance levels are horizontal, many of them are ‘evolving‘, which means they are ‘dynamic‘. Dynamic support and resistance levels, or areas, where the market can pull back into and find support w/o needing to be at a horizontal support or resistance level.

This happens because:

1) The market is evolving, and sometimes buying/selling interest changes in a way that isn’t at pre-designed levels

2) Momentum in trends is dynamic, along with the order flow

Momentum can often be the underlying energy behind trends or movements (kind of like running downhill).

There are other reasons, but the key point is that you get the underlying idea, and can integrate this ‘conceptual knowledge‘ into your trading. We’ll get to this later in the article.

But to summarize:

a) Static support or resistance levels aren’t moving, and are horizontal in nature

b) Dynamic support or resistance levels are moving, and are not horizontal in nature

Now that we know what dynamic support and resistance is, we can move onto the next section.

How I can find dynamic support and resistance in the forex market (or any market for that matter)?

There are many methods to find dynamic s/r, but we’ll talk about two that I prefer to use.

Dynamic Support and Resistance Strategy #1: The 20 EMA

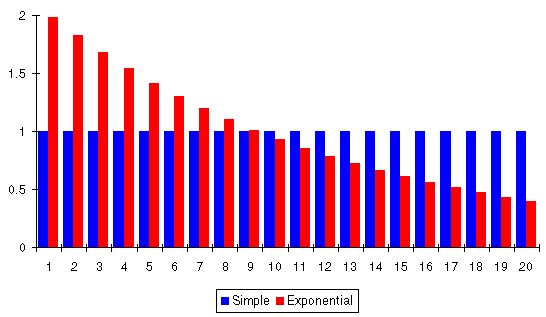
The 20 EMA is one of my favorite choices for discovering dynamic support and resistance as it does a really good job of being ‘balanced‘. What do I mean by being ‘balanced’? So the 20 EMA (exponential moving average) tracks the last closing prices of the candles for the last 20 periods. It gives more weight to the most recent closes (hence why it’s exponential), with less as you go through the series of 20 candles.

Below is a good graphic of how it differs from a ‘simple’ moving average which weighs the data the same regardless of time.

exponential moving average vs simple 2ndskiesforex

EMA’s (exponential moving averages) are balanced (IMO) because it does a great job of detecting the more recent momentum and changes in the price action, while at the same time taking into account some of the longer term movements in the price action, so well placed in between those two forces (hence ‘balanced’).

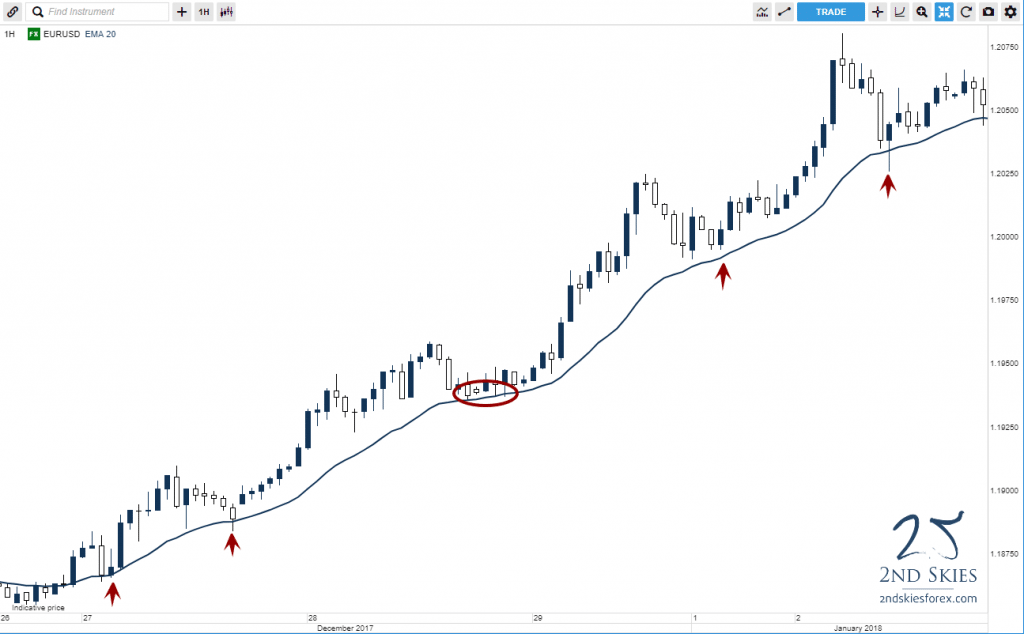
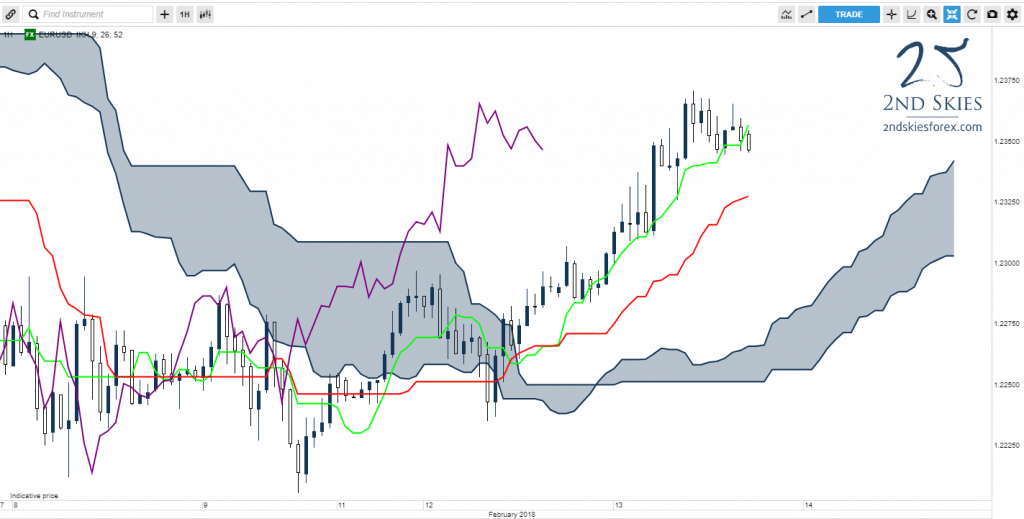
Below is a 1hr chart on the EURUSD showing the 20 EMA and how the price action related to it.

dynamic support and resistance forex market 2ndskiesforex

Notice how the price action touched the 20 EMA several times (navy line) which could have offered you great trade setups to get into the market with trend?

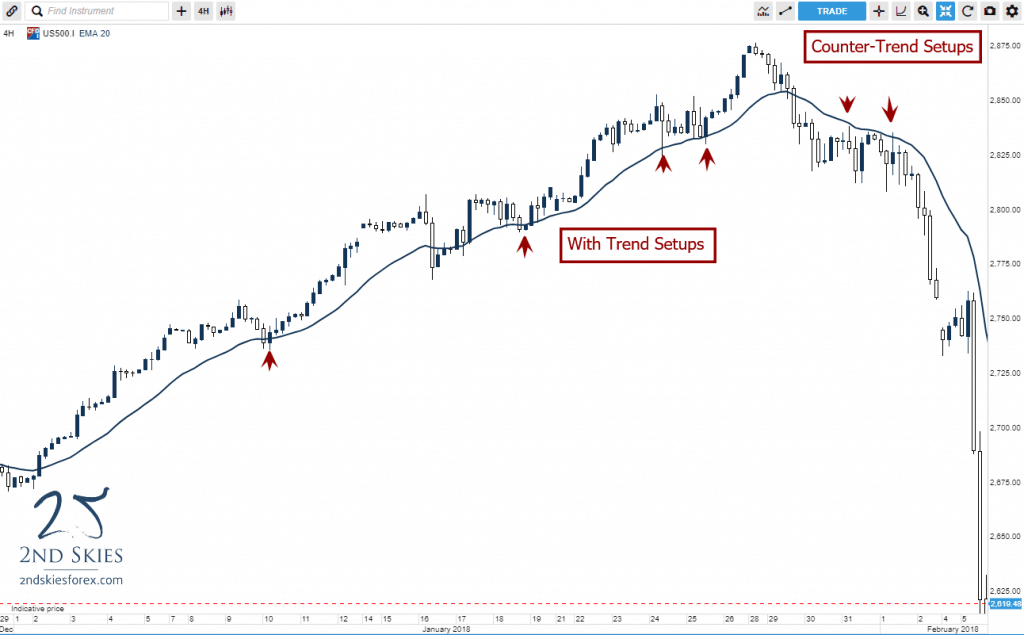
Another example is below on the S&P 500 on the 4hr chart.

s&p 500 dynamic support and resistance 2ndskiesforex

In this chart of the S&P 500, you can see how the 20 EMA offered some great trade setups both with trend, and counter-trend as the market reversed.

It’s important to note the 20 EMA can act as a solid method for finding dynamic support and resistance on any time frame.

Dynamic Support and Resistance Method #2: The Ichimoku Cloud

In the first 3 years of my trading, I spent the majority of my time learning, studying and trading two strategies:

#1 price action

#2 the ichimoku cloud

If you want to learn about how I trade price action, click here to watch

However for now I’d like to talk about the ichimoku cloud (called ‘ichimoku kinko hyo’) roughly translates from japanese to ‘one glance balanced chart‘. It was created by Goichi Hosada many decades ago. It is one of the most commonly used methods for analysis and trading strategies in Japan, and there are many great ichimoku traders who were considered some of the best analysts of their time (i.e. Hidenobu Sasaki).

ichimoku cloud 2ndskiesforex

To briefly sum up the ichimoku cloud, the goal of this approch is to communicate in one shot (or ‘glance’) the following:

1) what is the trend in the market

2) what is the underlying momentum (or lack thereof)

3) what are future key support and resistance levels

You read that last part right (“future”). One of the primary goals of the ichimoku cloud is to give you an idea where future support and resistance levels will be (and how much there is).

I’m not going to do a whole lesson on the ichimoku cloud. If you want to learn more about the ichimoku cloud and how it’s constructed, click here.

But for our purposes, just understand that the ichimoku cloud measures a) momentum {a form of dynamic support or resistance}, and b) future support and resistance levels.

Below is a chart to show you how this works.

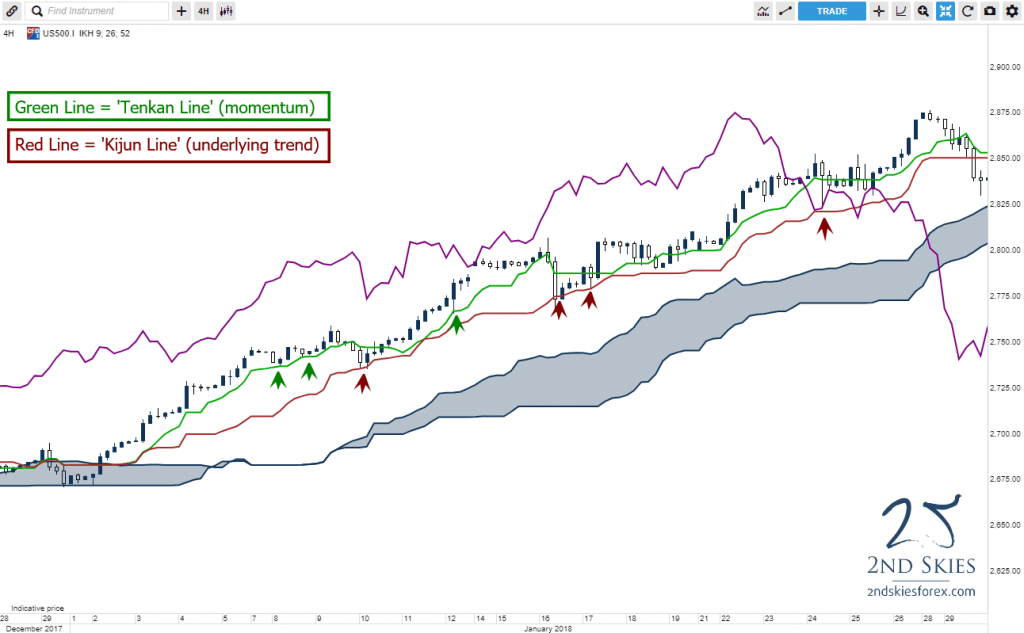
ichimoku dynamic support and resistance 2ndskiesforex

In the above S&P 500 ichimoku cloud chart on the 4hr time frame. There are several ways the ichimoku kinko hyo can act as ‘dynamic’ support or resistance. But for our purposes, in this uptrend, notice how the Tenkan Line (green line) did a good job acting as support on minor pullbacks.

The tenkan line does this well because it’s meant to track the underlying momentum in the price action. If the trend is strong, and has good momentum, the tenkan can often act as support or resistance. If momentum is weak, you’ll see this in the tenkan line by price crossing it more frequently, and not respecting it. This should tell you momentum is ‘weak’ or ‘weakening’ (depending upon the ichimoku context).

You’ll also notice the kijun line (red line) which is supposed to track the underlying trend in the price action. Notice how as price pulled back deeper in the uptrend, it stopped at the kijun several times, offering potential trade setups to get in this with trend.

There are many ways ichimoku is great for helping you find ‘dynamic’ support or resistance, but these are two good methods for now.

NOTE: If you want to learn more about the ichimoku cloud, click here for several free videos on learning more about the ichimoku cloud.

In Summary

While we spent a good amount of time recently talking about horizontal key support and resistance levels, today we’ve showed you how there is a different form of support and resistance which expresses itself as ‘dynamic‘.

We’ve also given you methods for finding dynamic support and resistance, along with showing you how the ichimoku cloud can provide an alternative (and useful) trading method.

Now one thing I forgot to ask is, have you ever looked at a chart and had a hard time finding key support and resistance levels?

Usually when I look at the price action on a chart, and I find it’s pulling back to areas where there doesn’t appear to be any support or resistance, I often try to see if the market is respecting ‘dynamic’ levels vs horizontal ones. Often times when I do this, the chart becomes more clear as this change in perspective gives me new trading opportunities I was missing before.

If you’d like to learn more about the ichimoku cloud, don’t forget to check out my ichimoku trading course. And if you want to learn more about forex dynamic support and resistance, take a look at my price action course.

Now Your Turn

Have you had this experience of not being able to find key dynamic or static support and resistance levels, or why the market pulled back to where it did? What did you learn about forex dynamic support and resistance levels from this article?

Make sure to leave your comments below, along with ask any questions you have on the subject. And don’t forget to tweet/like this article on your favorite social media so others can benefit from it.

Until then, I’ll look forward to hearing from you.

What’s Inside Today’s Trading Article?

  • Let’s talk about breakout strategies
  • What are some consistent breakout patterns?
  • When trading breakout patterns, how can I avoid false breaks?

Ever heard the statements “most breakouts fail” or “you should avoid trading breakouts“?

Let me just put the kibosh on that by sharing with you Exhibit A.

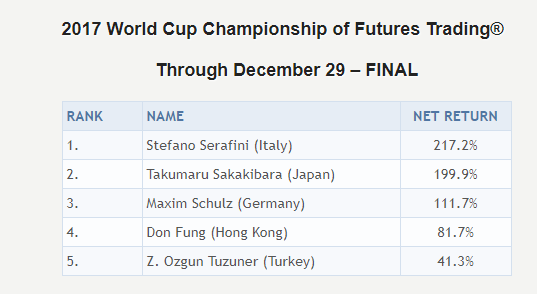
Behold…Exhibit A – winner of the 2017 World Cup Futures Championship, Stefano Serafini, who won with an impressive +217% return (see below).

stefano serafini breakout trader 2ndskiesforex

What was Stefano Serafini’s main trading strategy to generate such an impressive return? Trading intra-day breakouts!

So do me a favor, the next time you see some fake trading guru telling you “most breakouts fail” or “you should avoid trading breakouts“, please share the link to this post.

For today’s article, I’m going to share with you two breakout strategies to help increase your accuracy & profitability in trading breakouts. I’m also going to share how you can use this to avoid any false breaks and getting stopped out.

Let’s jump in.

Breakout Strategies

While there are many types of breakout strategies you can classify breakout trades into two broad categories:

  1. The momentum breakout setup
  2. The breakout pullback setup

For today’s breakout trade article, we’re going to focus on the second breakout strategy (breakout pullback setup) as it’s much easier for traders to learn and execute because it requires less skill.

NOTE: If you want to learn how to trade momentum breakout setups, then check out my Trading Masterclass course where I teach you how to trade this for maximum profit.

The Breakout Pullback Setup

Before you can even make a breakout pullback setup, you’ll need to identify some of the consistent breakout patterns that manifest in the price action.

By learning these, you’ll be able to identify A+ setups which will increase your accuracy and profitability in trading them.

There are many things you can do to identify an A+ breakout pullback setup, but there are 2 things I’ll give you to work with for now.

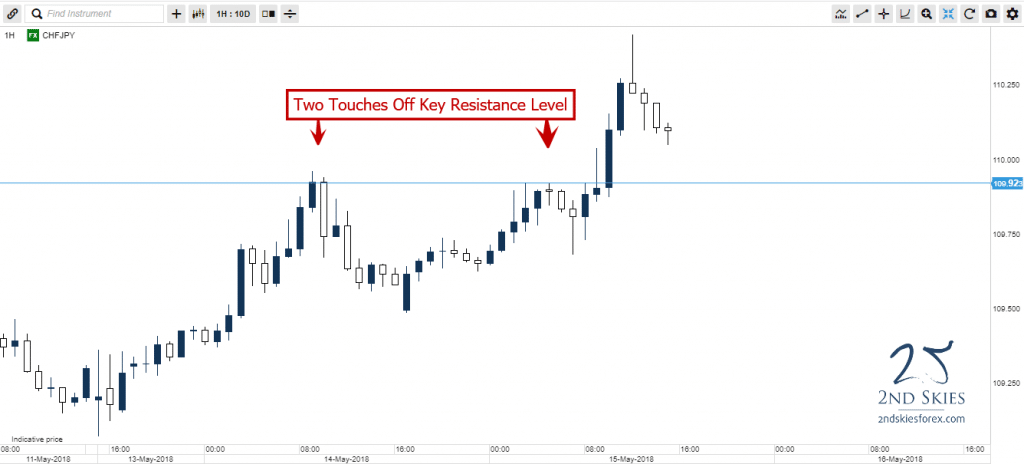
Breakout Pattern #1 – Finding a key support or resistance level with a minimum of two touches

Why two touches?

While the market may hit a key support or resistance level once, which indicates at least some potential order flow and institutional players wanting to hold that level, two touches indicates a greater probability and amount of order flow behind that level.

trading forex breakouts 2 touches 2ndskiesforex

The more buyers/sellers you have at that level, the greater the chance the breakout trade will succeed.

Why?

One reason is those same players who, when they get stopped out after their support or resistance level is broken, them getting stopped out clears out some of the order flow against that breakout, thus making it easier for the breakout to continue.

On top of this, smart money players after they’ve been taken out (and spot a good breakout) will often flip sides after they get stopped out, thus providing further momentum to your breakout trade.

Hence it’s important to identify a level that has a minimum of two touches (the more, then better) to increase your probability of a breakout setup forming.

Breakout Pattern #2 – A reduction in the reactions (or pullbacks from that support/resistance level)

Why does a reduction in the pullback from a key support or resistance level help your breakout trades?

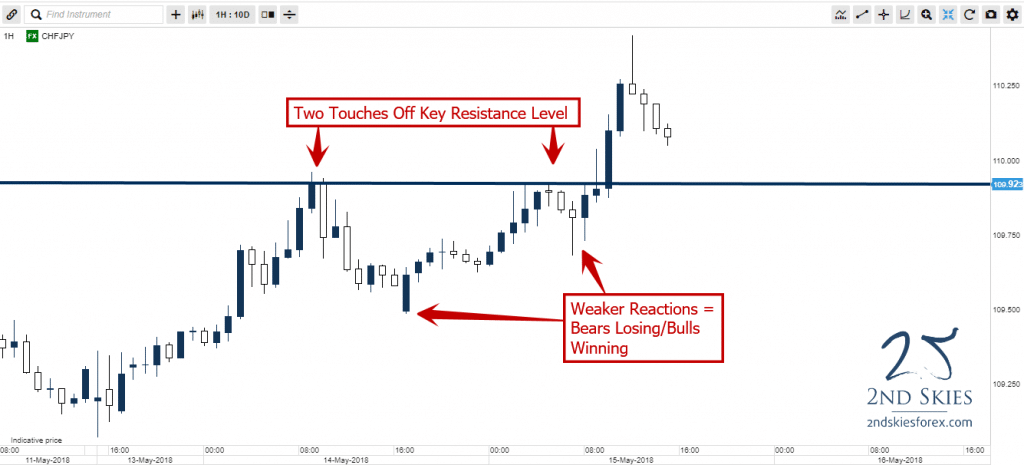
Let’s say the market is in a bull trend and it’s encountering a resistance level where there are likely bears with offers up at that level. If the bulls hit the resistance level the first time, and the market pulls back say 50 pips, then when the 2nd time the price action hits that resistance level, the market only pulls back say 25 pips, this indicates a weaker reaction by the bears at the level.

A weaker pullback from the bears = less order flow and strength on their side. As their side continues to weaken, this a) gives the bulls more confidence a breakout is becoming more likely, and b) communicates their side is losing the battle.

Looking at our prior chart, notice how the reactions/pullbacks to the resistance level were weaker the 2nd time around?

trading forex breakouts two touches 2ndskiesforex

Those weaker reactions were communicating how the bears were less able to push back while the bulls kept their foot on the gas, producing an eventual breakout.

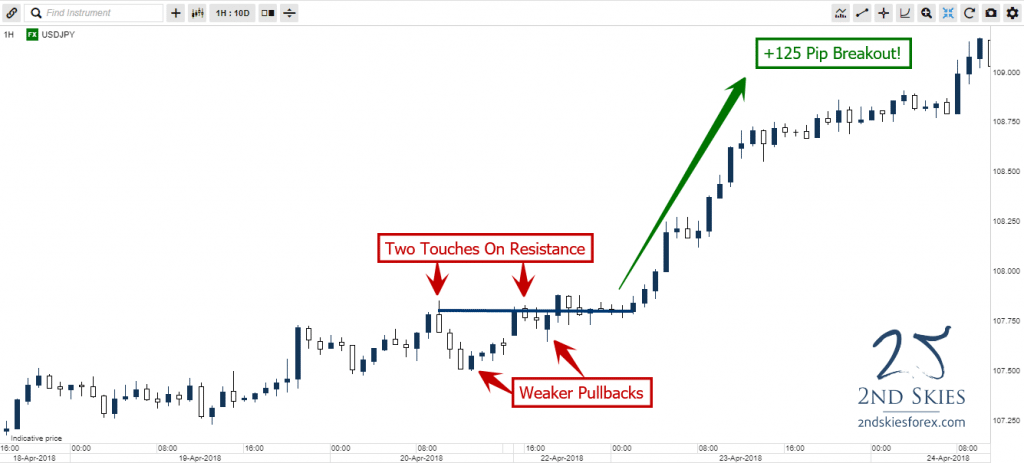
Below is another good example of the two touches + weaker reactions to the resistance level on the USDJPY, producing a +125 pip breakout.

forex breakout setups 2ndskiesforex

Hence, make sure to look for weaker reactions each time off a key support or resistance level to identify a high probability breakout.

Key Tip: One additional pattern you can apply in the price action is to look for breakout setups that are forming with trend vs counter trend.

Now that I’ve shown you two underlying components of a breakout strategy, let’s talk about how you can get in on a breakout pullback setup.

The Breakout Pullback Setup

Assuming you’ve found a situation whereby you have the minimum two touches off a key support or resistance level, along with weaker reactions to the level each time, let’s talk about how you can get into a breakout pullback setup and how I trade it.

Once the market and price action has closed above your key support or resistance level, I’ll place a limit order on that particular support or resistance level to trade in the direction of the breakout.

NOTE: I am not waiting for a confirmation price action signal to form on that level. If you’ve read the price action context correctly, and found a legitimate breakout, any confirmation price action signal will only give you a weaker entry, and thus reduce your profitability.

If you learn to read the price action correctly, you won’t need any confirmation price action signal to get in the market, because the underlying order flow from the big players will already be there.

When I’m trading a breakout pullback setup, once I’ve qualified the breakout, I’m placing my order to get long/short on a pullback to the level.

If the order flow at that level is legit, there will be larger players willing to get long/short at that level without the need for any pin bar, inside bar or ridiculous tailed bar.

Case in point, watch this video on me doing a live breakout pullback trade on the NZDUSD for +100 pips of profit with only a 29 pip stop loss.

Notice how there were two touches on the support level near 6625, along with each bounce getting weaker. Once the market broke through the level, I placed my order to get short.

After pulling back to my level, and barely going negative, the pair took off for over +100 pips of profit.

Had you waited for any confirmation price action pin bar signal, you would have a) gotten a worse entry, and b) had less profit potential.

You can see another example of a live trade using a pyramiding trading strategy where I get in on the breakout pullback setup to the level on both trades, stacking onto the same with trend move for extra profit.

After watching the two videos, hopefully these examples give you a good idea of how to trade the breakout pullback setup.

How to Avoid False Breaks?

There is a lot that can be said about avoiding false breaks when trading the breakout pullback setup, and there are many breakout patterns that often fail.

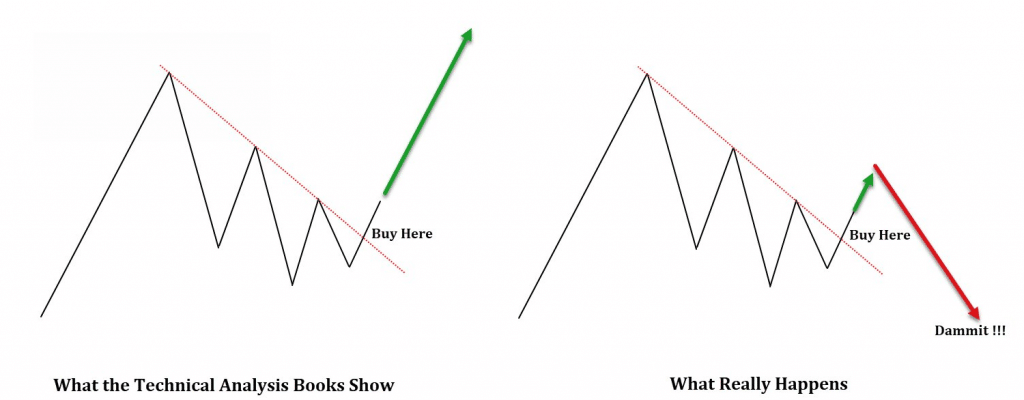
false breakout patterns

To keep it simple, the best thing you can do is:

a) learn to read price action context, and

b) trade with trend as much as possible

By learning to read price action context, you’ll have a better grasp at finding key support and resistance levels where there is a lot of order flow around that level. You’ll also be better able to spot with trend environments, which are much more favorable for breakout trade setups. This is because there is a greater amount of order flow in your favor to support your trade.

In Summary

To recap, trading forex breakout patterns can be a highly profitable trading strategy when you learn to identify A+ breakout setups. There are two classifications of breakouts, which are a) the momentum breakout setup, and b) the breakout pullback setup.

There are also key breakout patterns you can spot in the price action which will help you find higher probability breakout trades.

In the beginning, try to trade breakout pullback setups as they require less skills, and will help you build your confidence in trading breakouts over time.

Lastly, when trading the breakout pullback setup, make sure NOT to wait for confirmation price action signals as they’ll give you a worse entry (trade location) and reduce your profitability.

Now Your Turn

What did you learn from this article that helped you with trading breakouts in the forex market (or any market for that matter)?

Did you find this useful and give you some increased confidence to trade breakouts?

Are you currently trading breakouts and struggling?

Please make sure to leave your feedback and comments to help us create better trading articles and content for you.

Until then, may good trading setups and karma be with you.

Kind Regards,
Chris Capre

What’s inside today’s trading article?

  • How to find the strongest support and resistance levels
  • What variables should I be looking for when picking my key support and resistance levels
  • How do I know how strong a major support and resistance level is?

Being able to find high probability key support and resistance levels is an important skill you’ll need to build to become a profitable trader. There is no way around this. If you’re wanting to trade price action, you’ll have to learn how to identify and trade key support and resistance levels.
One of the more common questions I get from struggling traders is “how do I find the strongest support and resistance levels?”

In this week’s trading article, we’ll answer this question, along with what variables you need to look for in finding key support and resistance levels, and how to identify the overall strength of that level.

Let’s jump in…

The Mindset Around Key Support & Resistance Levels

First off, it’s important to understand you need a particular mindset and understanding about support and resistance levels. What I’m particularly referring to here is that you have to view S/R levels ‘probabilistically‘. You cannot think of them as black or white, good or bad, going to hold, or not going to hold.

Trading doesn’t work like that, nor does price action, nor does S/R levels. You have to trade and think in probabilities. There is no way around this!

Just want to get this out of the way.

Also, it’s important to think of S/R levels more as ‘zones‘ and not fixed lines in the sand. This means you realize there isn’t one price where the support or resistance is broken. So you cannot think of it like “if the EURUSD breaks 1.1350, I’m bullish, but if it’s at 1.1349, I can’t be bullish“.

Order flow doesn’t work like this, nor are all large institutional players and hedge funds parking their buy/sell orders at the same price. They will often ‘cluster‘ their orders around specific prices. And it is this small cluster (or range of prices) which constitutes the ‘zone‘.

So avoid the trap of relating to support and resistance as a single price or line in the sand. Think of them as ‘zones‘ of important order flow.

How To Find The Strongest Support And Resistance Levels (in all financial markets)

The strongest support or resistance levels will more often than not be with trend. What this means is, if we are in a bull trend, pullback levels to support will more often than not be ‘stronger‘ than resistance levels above. This is because the underlying order flow in a bull trend is more dominantly on the buy side. Holding multiple tests of a with trend level usually is a good indicator of it’s level of strength.

Until the trend changes, hedge funds and large institutional players will be looking to buy more than sell, so the order flow on those pullback levels will often be ‘stronger‘ than resistance levels, which will often fold faster.

Below are a couple examples.

strong-support-levels-in-forex-holding-multiple-tests-2ndskiesforex

In this chart on the USDMXN (daily chart), notice how the resistance levels only survive a few touches before breaking, while the key support levels survive multiple touches before creating a new leg higher? This should tell you where the dominant order flow is (on the bull side) and that until you see this structure and order flow changing, you want to be trading with trend as much as possible.

NOTE: If you want to see a good example of me trading with the trend using key support and resistance levels, click on that link to watch a video of me profiting +300 pips trading S/R levels.

Another example of how a with trend support level held multiple touches is in the USDJPY (daily chart).

strongest-support-levels-in-forex-2ndskiesforex

Notice how the support levels held multiple touches in the middle. The ability to withstand multiple touches tells you the more dominant order flow is on the bull side as they’re able to handle multiple tests while holding the line.

Also notice how the last support level (~105.38) was just barely touched before producing a super strong bull move? Quick reactions that take out prior swing highs often denote impulsiveness and a strong amount of order flow present to hold the level for 1-2 candles before rocketing higher 1500 pips. So make sure to note these variables as demonstrating strength in a particular level:

  1. holding the line after multiple touches
  2. strong/short reactions from a key S/R level
  3. with trend levels will often be stronger than counter-trend levels

Now that you have a few variables to look for, make sure you build your skills in identifying these variables till they become sub-conscious.

What Other Variables Should I Be Looking For When Picking My Key Support And Resistance Levels?

Besides looking for with trend levels, another good variable to look for are corrective structures with multiple touches on both sides of the market.

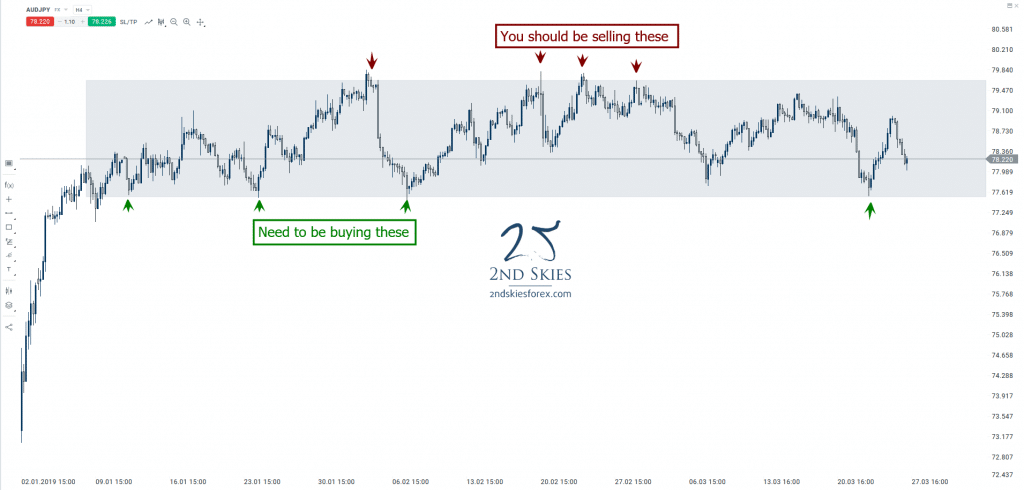
A really good example of this lately has been the AUDJPY which we’ve talked about in our market commentary recently.

corrective-structures-offering-good-support-and-resistance-levels-audjpy-2ndskiesforex

Looking at the 4hr chart, you can see in the box how the price action has had multiple touches on the top and bottom of this corrective structure. What this communicates from an order flow perspective is that both sides of the market are in a state of balance, so neither side is dominant and ready to take over yet.

When you have corrective structures like this, it’s important to be trading both sides of the market until the structure breaks. This will give you a lot of trading opportunities with small stop losses (i.e. above/below the structure) while targeting the other side of the corrective structure.

In most cases, this structure would have offered several +3-4R trade setups. It is something we talked about with our members ahead of time, so congratulations to those students who profited from these trades.

NOTE: You can watch a live trade video of me profiting +160 pips trading off a key support level here.

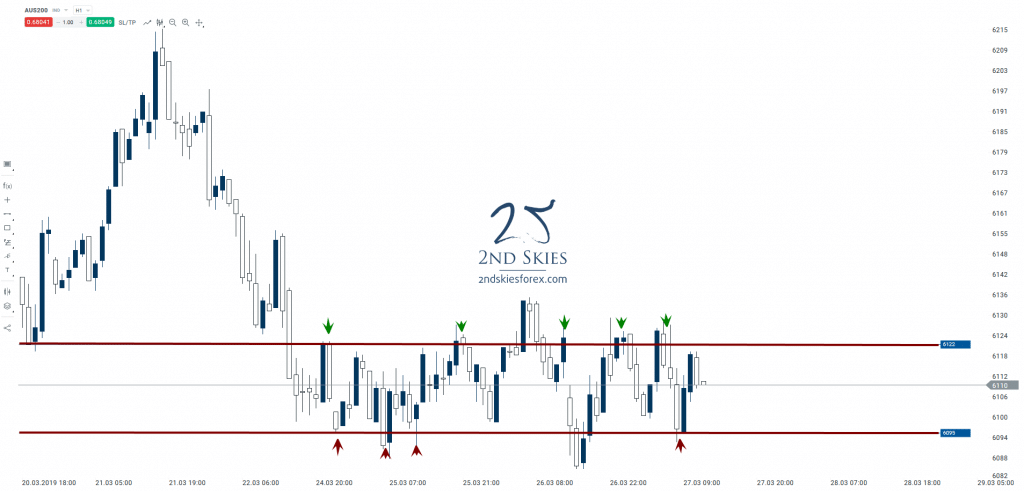
Moving forward, you can see another example of these corrective structures on the ASX 200 1hr chart.

day-trading-setups-asx-200-2ndskiesforex

Although the levels are not as ‘clean‘ as the AUDJPY chart, the overall corrective structure is there and with a little more buffer, has offered multiple day trading setups for about +2R.

Hence learn to identify corrective structures with multiple touches on both sides of the market and look to trade both sides until the structure is broken.

In Summary

There are many tools and variables you’ll need to identify in the price action which can help you find strong support and resistance levels. Keep in mind, this is a skill that takes time to learn, so don’t expect to read an article and be a pro. You’ll have to build your skills in this over time. If you do this right, you’ll find yourself identifying and trading stronger support and resistance levels.

In our Trading Masterclass course we cover many other variables you’ll need to learn to find the best support and resistance levels. On top of the many lessons we have on S/R levels, we also have market commentary and trade ideas for our members 4x per week where we are identifying the most important support and resistance levels, so you can continually improve your skills.

To learn more about becoming a member and getting access to these lessons + market commentary, click here.

Until then, I hope you enjoyed this article on finding the strongest support/resistance levels, and make sure to leave a comment below.

Additional Articles/Videos To Study:
1) Live Forex Trading +480 Pips on EURUSD
2) Confirmation Around Key Support & Resistance Levels
3) Live Price Action Trade – Pullback To Support Level For +7R

What’s Inside?

  • Can I trade set and forget with a full time job?
  • What are some set and forget trading strategies you can use?
  • What skills do you need to trade set and forget in the forex market?

In my last article, I showed how you can do forex day trading.

This week I’ll be covering how you can do set and forget trading in forex, stocks, commodities, and global indices.

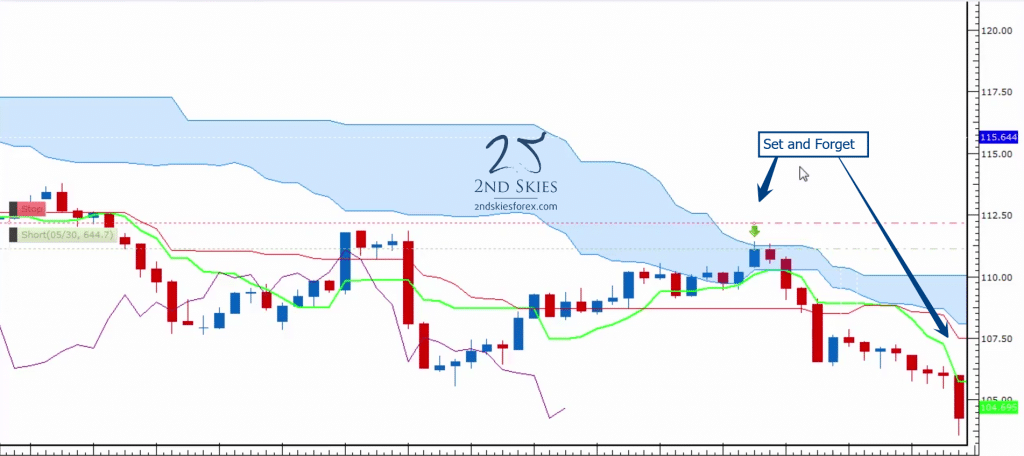
The basic definition I’m working with when I’m talking about ‘set and forget trading‘ is whereby you open a position with a pre-defined stop loss, take profit and entry location, and once the trade is activated, you let it go with no trade management.

This means you let the trade run until it hits your take profit, or your stop loss. Hence the name ‘set and forget‘.

set-and-forget-trading-ichimoku-2ndskiesforex

This can be done on any time frame, meaning you can do set and forget trading on the weekly time frame, the daily or 4hr charts, or even the intraday charts such as the 1hr and below.

Yes, you can even day trade using set and forget, meaning you take a trade for the day and close it when it hits your SL, TP or the daily session is done.

The key point is once your trade is active, you do not manage the trade.

Now let’s get into some of the key points and topics you’ll need to know around set and forget trading.

Can You Trade Set And Forget With A Full Time Job?

Short answer? Yes, and something you should (most likely) use if you have a full time job and only 1-2 hours per day to trade the forex markets (or any markets for that matter).

set-and-forget-trading-with-full-time-job

The opposite to set and forget trading is to actively manage your trades. I wouldn’t recommend this if you lack any of the following:

  1. Really solid price action skills to be able to read the price action context in real time, and thus be able to manage your trade to get the optimal profit out of it.
  2. Have a baseline profitable track record showing you can manage your trades
  3. Have the time to consistently watch your positions
  4. Have pre-defined conditions/rules/patterns to help you exit your positions early

Hence, if you lack any of the following above, then you should be trading set and forget.

Additionally, if you’re just starting out in the markets, I’d also recommend trading set and forget to build a baseline showing you can find trades, entries, and have well placed stop losses and take profit levels.

Now that we’ve established who should be trading set and forget, let’s get into my suggested rules, tips and strategies.

Trading Set and Forget Tip: Have A Pre-Trade Routine

Trading takes a very particular mindset and mental activity to do it profitably. Very rarely will your work mindset perfectly lead you into the right trading mindset.

Because of this, I recommend having a pre-trade routine, whereby before you even start trading, that you sit down at your computer and clear your mind, making sure you’re relaxed, clear and focused before you make any trading decisions.

All you need is about 5-10 minutes of mental preparation to get yourself into a clear state for trading.

NOTE: If you want a simple 5-10 minute practice to get ready for trading, read my article on meditation for trading.

Once you are mentally settled and ready to trade, then you’ll want to load up your trading platform and begin your pre-trade analysis.

For your pre-trade analysis, you’ll also want a routine that is structured and fixed. What I mean by this is:

  1. You trade ideally at the same times per day
  2. You only look at a fixed set of instruments every day that are a part of your trading plan
  3. You start with a top down analysis, meaning you start with the higher time frames, and work your way down (if you’re doing multiple time frame analysis)
  4. You begin by analyzing either the price action context first, or the Ichimoku context if you’re an Ichimoku trader

Once you have the above completed, it’s time to select which trades meet your criteria, and then enter your entry location/price, your stop loss and take profit levels.

NOTE: You should always trade with a minimum of 1:1 risk to reward ratio (or better). If you want to learn more about why you need this minimum risk to reward ratio, click here.

As to choosing your risk to reward ratio, I don’t recommend it always be a fixed number, but it should always satisfy the minimum 1:1.

Targets should always be set based upon the price action context (or Ichimoku context). If you have a particular trading strategy that suggests a specific target, then fine, fire away. But you should always be targeting a take profit location you can hit with a profitable trading edge over time.

I don’t recommend any fixed targets until you have a sufficient baseline and data to clearly back up what your most optimal target is because you could be getting out too early just based on a fixed target.

If you are new to trading, then I’d suggest somewhere between 1.25R and 2R. ‘R‘ simply refers to your risk, so if you’re risking 100 pips, 1.25R would be 1.25 x 100 pips, so 125 pips.

As to position sizing, I’d recommend no more than 1% per trade, and if you’re a beginner, then better to be extra cautious and use .5% risk per trade as you’ll likely make more mistakes in the beginning, and thus will need an extra buffer to compensate.

NOTE: We always recommend risking a fixed % of your equity per trade. To learn more about why we recommend this, click here.

Trading Set & Forget Tip: What Instruments to Trade

The most important rules of thumb for choosing what instruments to trade are the following 3 points:

  1. Don’t trade more instruments that you can easily manage/follow/analyze
  2. Whatever instruments you choose, stick with them for a minimum of 3 months to build a proper baseline
  3. Ideally stay within the same asset class till you have stability and profitability with that asset class

If you’re looking to trade the forex market set and forget, I’d recommend a minimum of 4-5 forex pairs, with 2-3 of them being major pairs, ideally one minor pair and one exotic pair.
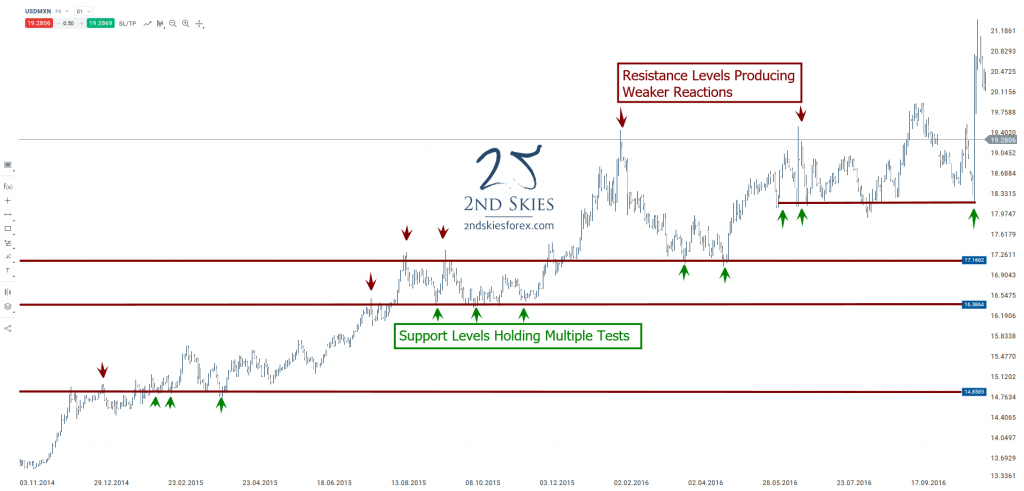
Also make sure to trade only forex pairs which are most correlated with your region and time of day.
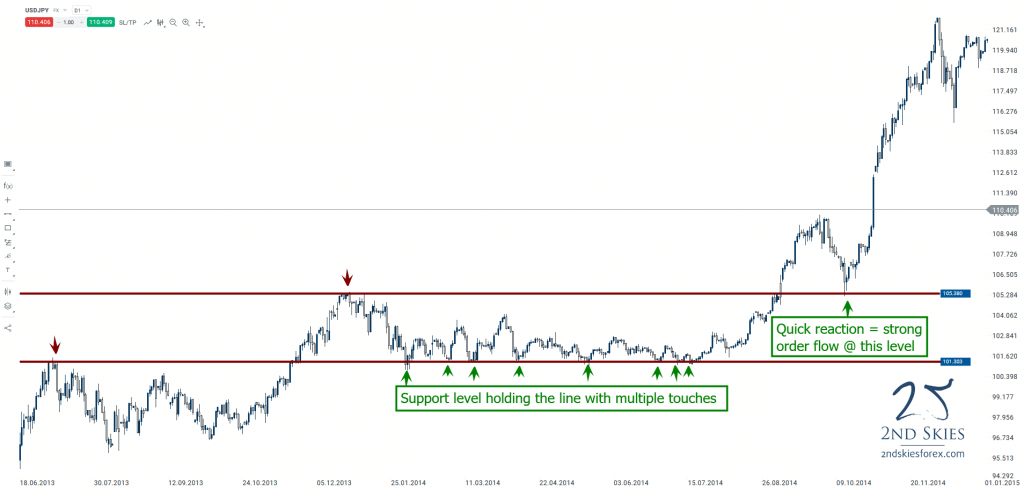
So USD and European currencies if you are in the UK/Europe/North America.

For Asia/Australia/New Zealand, I’d suggest at least 2 currencies from your region (JPY, AUD, NZD, CNY, SGD, KRW) and minimally one USD pair.

If you’re looking to trade stocks set and forget, I’d recommend one or two indices from your region, and at least 2-4 consistently volatile stocks from your region. You can also look for an ETF or two as well.

If you’re looking to trade commodities set and forget, I’d recommend at least one energy/natural resource product, such as WTI/Nat Gas, one to two precious metals, such as gold/silver, one to two industrial metals, such as copper or aluminium, and one to two agricultural products (corn, wheat, sugar, etc).

Now that you have your pre-trade routine, position sizing and instruments all set, the next thing you’ll need to setup will be the time frames you trade with.

Trading Set And Forget Tip: Time Frames To Work With

For day trading set and forget (meaning you open/close your trade within one day or one trading session), I’d recommend using the 4hr or 1hr time frames for your higher time frame context, then trading on either the 15 min chart, 5 min chart or 3 min chart.

For swing trading set and forget (meaning you hold your positions for days to weeks, perhaps a couple months), I’d recommend using the daily time frame for establishing your higher time frame context, then either making your trading decisions on the daily chart, 4hr chart or 1hr chart.

As to which time frame to make your trading decisions on, a general rule of thumb is to:

a) choose the time frame which looks the cleanest for your trade setup, and

b) which is most relative to your target size and holding time.

In terms of which time frame is best based upon your target and holding time, first you need to establish what your target is.

A simple rule of thumb is to setup an ATR indicator (set to 5) on the daily chart to see what the average daily range is for your instrument.

If your target is outside the current ATR, then you’ll likely need multiple days to hit your target and should be working with a higher time frame. If your target is within your daily ATR, then you’ll want to be using a lower time frame chart.

eurusd-atr indicator 2ndskiesforex

Set And Forget Trading Strategies

Whether you’re looking to set and forget trade forex, stocks, commodities or global indices, one consistently strong setup and trading strategy is the breakout pullback setup.

This is a straightforward strategy where you’re looking to trade with trend, and are waiting for the market to break above/below a key support or resistance level (break resistance for bull trend, and break support for a bear trend).

breakout-pullback-setup-2ndskiesforex

Once the market breaks its key level, you’ll then wait for a pullback to the prior support or resistance level to trade in the direction of the trend.

I have a video on how I traded the breakout pullback setup for +110 points on the UK FTSE with my own money which you can watch here.

I also have another video on the breakout pullback setup for +100 pips on the NZDUSD within a matter of hours. You can watch that video here.

The breakout pullback setup is such a classic and useful strategy that when you trade it with the right price action context can be a very profitable setup so it’s definitely one you’ll want to practice and master.

In Summary

By now you should also be well aware of how to trade set and forget, starting with your pre-trade routine, what instruments to trade and how many, what % of your equity you should risk per trade, what time frames to trade, and what strategies to trade set and forget.

If you’d like to learn more advanced methods to trade set and forget, along with see more examples of me trading live with my own money, then make sure to check out my Trading Masterclass course, where you’ll get access to our members trade setup forum, market commentary 4x per week and ongoing training.

With that being said, please make sure to leave your feedback on what you learned about set and forget trading from this article.

I’ll look forward to hearing from you, and wish you nothing but success in the markets while seeing real progress towards your trading goals.