In this new forex trading video series, I’ll be doing monthly forex ichimoku analysis, starting with establishing the ichimoku context, from the 3 pillars to the 5 lines, gauging the imbalance, momentum, structure, along with key support and resistance levels, all using the ichimoku cloud to find ichimoku trade setups.
Read more
What’s Inside?
- Let’s talk about the Weekly, Daily, 4hr & 1hr chart entries
- What daily time frame forex strategies do you recommend?
- How can I utilize price action trading systems on the 4hr chart?
Tell me if this is true and has happened to you before:
You look at the weekly time frame, or perhaps the daily time frame, and the price action context looks bullish. However, when you look at the 4hr and 1hr chart, the context looks bearish. Now you’re not sure if you should go long at your trade location, or be worried about that seriously bearish trend on the 1hr chart.

Has this (or something like it) happened to you? Ever been confused trying to understand the price action trading trends on the daily, 4hr and 1hr charts?
If so, you’re not alone as many traders like yourself have challenges in learning this skill. The good thing is, you can learn how to trade price action on any time frame with the right training and skills.
In today’s price action forex strategy article, I’m going to share with you 3 tips on how to do price action trading on the daily, 4hr and 1hr charts (or any time frame).
If you want to trade like a professional trader, you’ll have to understand price action context across multiple time frames. Learning these three price action trading system tips will help you build a ‘framework‘ for how to trade price action on multiple time frames.
Price Action Tip #1:
How Do I Know Which Time Frame To Read the Trend?
One of the most important and fundamental ways to look at time frames is to understand them by the following photo below:

What do you see in these 3 shots?
Starting on the left, we have the wide lens (18mm) which shows this shore/side of the lake, trees on both sides, and a couple peaks near the top left.
In the middle, we have a 55m wide lens which only shows the short on the other side of the lake. It also shows a 3rd peak which is more easily seen to the upper right.
On the right side, we don’t see any lake, only one major peak, with a well defined white strip of snow and lattice structure on the mountain.
3 lenses, same piece of land.
Now let me ask you this question: Which one is ‘right’? Which one is the ‘most accurate‘? The answer is neither, or better yet, ‘whichever is most important to your needs‘.
And that is how you need to think of price action on the weekly, daily, 4hr, 1hr or any time frame for that matter. Each time frame is it’s own ‘lens‘ (perspective) about the price action and order flow. Hence each time frame has it’s own trend. The key is to pay attention to the time frames most relevant to how you’ll trade.
Do you have a full time job and can only trade a few hours after work? Unless you have some solid experience in trading or reading price action, I’d recommend the higher time frames.
For our discussion, here is what I consider the ‘higher time frames‘:
Monthly/Weekly/Daily/4hr on EURUSD
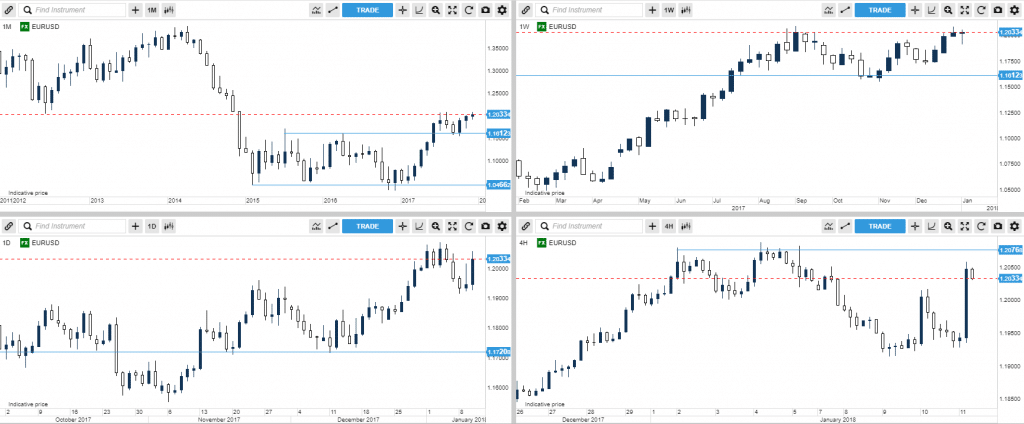
The overall guide on how to relate to this is:
1) Look at the monthly time frame chart if you are looking at several years+ worth of price action, and want to hold trades for about a year or more (often called ‘position trading‘).
2) Look at the weekly time frame chart if you are looking at just a few years worth of price action, and want to hold trades for several months at a time, perhaps close to a year
3) Look at the daily time frame chart if you are looking to do ‘swing trading’, and want to hold your trades for a couple days, up to a few months (perhaps quarter)
4) Look at the 4hr time frame chart if you are looking to do swing trading, and want to hold your trades for a couple days up to a few weeks (perhaps a month)
NOTE: These are general ‘guidelines‘. They are not perfect rules.
A few months of price action on one chart may have more meaning/information/key levels/etc than another forex pair for the same amount of time. You cannot bottle price action context and time into perfect rules. Hence use these as ‘guides‘, not fixed rules.
If you are someone who has the capacity + interest to trade price action intraday (which we support), then I’d recommend the 1hr down to the 5 minute charts. A lot of professional traders day trade.

I have in my trading course several videos showing me trading price action live with my own money on the 1hr, 5 minute, 3 minute, and 1 minute charts. Hence remember this:
Price Action as a ‘skill‘ can be used on any instrument, time frame or environment.
If what you’re learning only works on specific time frames, then it’s not a real skill of price action trading. Just like good footwork in basketball works in high school, college or pro, from offense to defense, it works in all aspects of the game because it’s a ‘core skill’. The same goes for trading price action.
So the first key skill to understanding multiple time frame context is: The trend is based upon time frame.
Price Action Tip #2:
What Daily Time Frame Forex Strategies Do You Recommend?
Many traders (perhaps like yourself) want to trade the daily time frame and are wondering what forex strategies you can use. There are many strategies we teach in our trading course, but one I’d recommend is a role reversal setup (or breakout pullback setup).
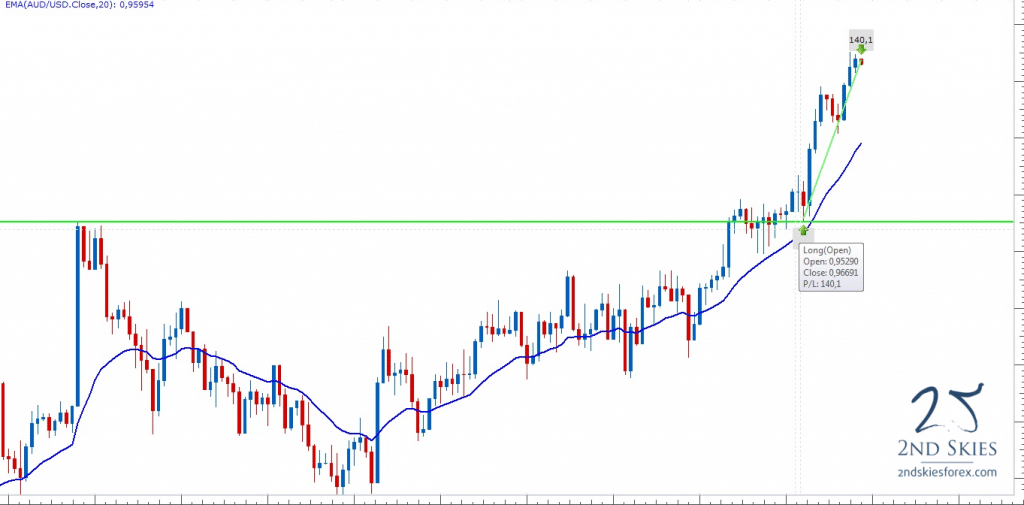
This daily time frame strategy is best used when you are trading with trend. Below are 3 major components for a breakout pullback setup:
1) find the overall price action context and trend on the daily time frame
2) find a key support level (for bear trends) and resistance level (bull trends) that has been touched two times before (at a minimum)
3) wait for the market to breakout and pullback to the level
If you’ve done those 3 things, you’ve likely found a good role reversal – breakout pullback setup.
There is more to this strategy, (what type of trend you are in, which are key support and resistance levels, what is the best price action context to trade breakout pullback setups, etc.), but you have the basics.
NOTE: If you want to learn more about this strategy and how to trade it, check out my Trading Masterclass course where I teach you exactly how I use this strategy with my own money.
Now you’ll want to practice this daily time frame forex strategy and learn how to spot these profitable trade setups. So start with a trading simulator, then demo, then live.
Price Action Tip #3:
How Do I Trade Price Action On The 4hr charts?
If you’re primary time frame for trading is the 4hr charts, then most likely you’re doing ‘swing trading‘. In essence, you’re trying to capture larger ‘swings’ in the market.
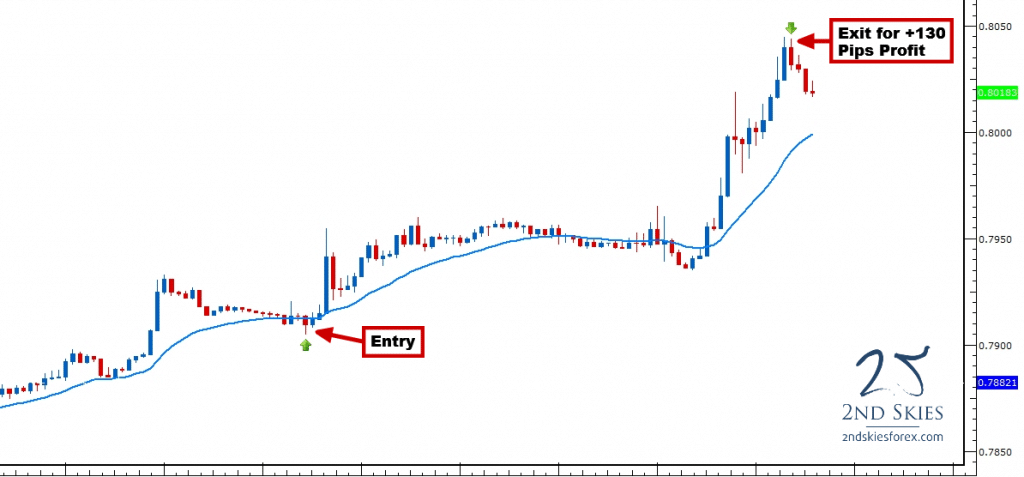
Without a doubt, you can use the breakout pullback setup on the 4hr chart (or any time frame for that matter). Here are a few tips you can use when swing trading the 4hr charts:
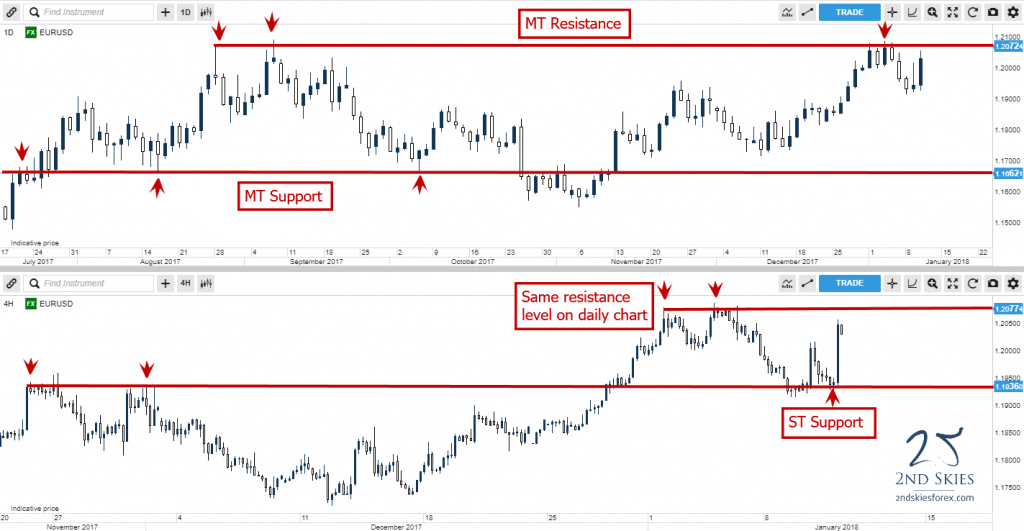
1) Have the daily chart as your ‘higher‘ time frame context. When in doubt, try to trade with this the most.
2) Don’t expect the market to go straight to your target.
NOTE: It may require a few pullbacks before it gets there. Eventually with enough skills in reading the price action context, you’ll learn when those pullbacks are part of the trend, or leading to a major reversal.
3) Mark your support and resistance levels on the daily & 4hr charts.
I’ve provided an example below:
In Summary
You’ve now learned 3 price action trading system tips for trading the weekly, daily, 4hr, 1hr or any time frame chart. They are:
1) The trend is based upon the time frame
2) You can trade the breakout pullback setup as a daily time frame strategy
3) Trade price action on the 4hr chart in conjunction with the daily time frame chart
When you start to approach trading price action context with the strategies and guides I’ve outlined above, you’ll build a framework of skills for trading price action on a more advanced level.
Now Your Turn
What did you learn about trading on multiple time frames from my article above? Do you have more answers or questions, and if questions, what are they? Share your thoughts and comments below.
What’s Inside?
-Tell me about your instruments
-When not to trade breakouts
-Let’s look at where you take profit
In the world of forex trading, if you’re not making money now (over a decent period of time), most likely you have to make some changes. To make money with forex, you will probably have to change the way you think, the way you trade, and the way you perform.
In today’s article, I’m going to share with you 3 things that will make you more money trading. If you want to improve your trading performance and make money on forex, consider making these 3 changes to your trading now.
#1: What Kind of Instruments Do You Play?
As of today, I’ve seen over 10000+ myfxbook accounts. Now I have an important question for you.
Out of all the students who’ve given me a myfxbook account for their first time, how many of them were trading only instruments they profited with?
Any guesses?
If you said ‘zero‘, you were correct.
Think about that for a moment…the first time you use myfxbook and start tracking your trading stats, the chances you’ll profit on every instrument you trade is likely zero!
In other words, you’re trading forex pairs and instruments you are not profiting from, and most likely won’t.
Below is a screenshot of a live myfxbook account for one of my students ‘Ahmed‘ (who’s well in profit).
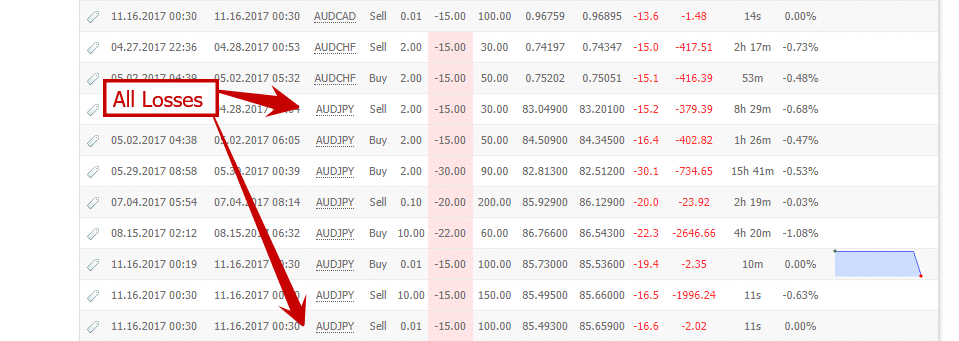
Notice anything? He’s lost every trade on the AUDJPY.
Now as long as you have a decent amount of trades for an instrument, if that instrument you’re trading has all losses, you should remove it from your trading plan and not trade it again for at least one year.
By taking off the instruments you have the most losses with (from my experience), can add between +3-10% of profit towards your bottom line per year.
That can be the difference between losing money and making money trading. It can also be the difference between making decent money, making great money with forex.
Hence look at your trading instruments by clicking on the ‘symbol‘ tab under your myfxbook trades and isolate the ones you lost the most money on.
Make sure to a) record the number of trades per pair, b) total accuracy %, and c) total profit/loss {in %} for each forex pair. Those 3 metrics alone will likely tell you which pairs and instruments you need to stop trading.
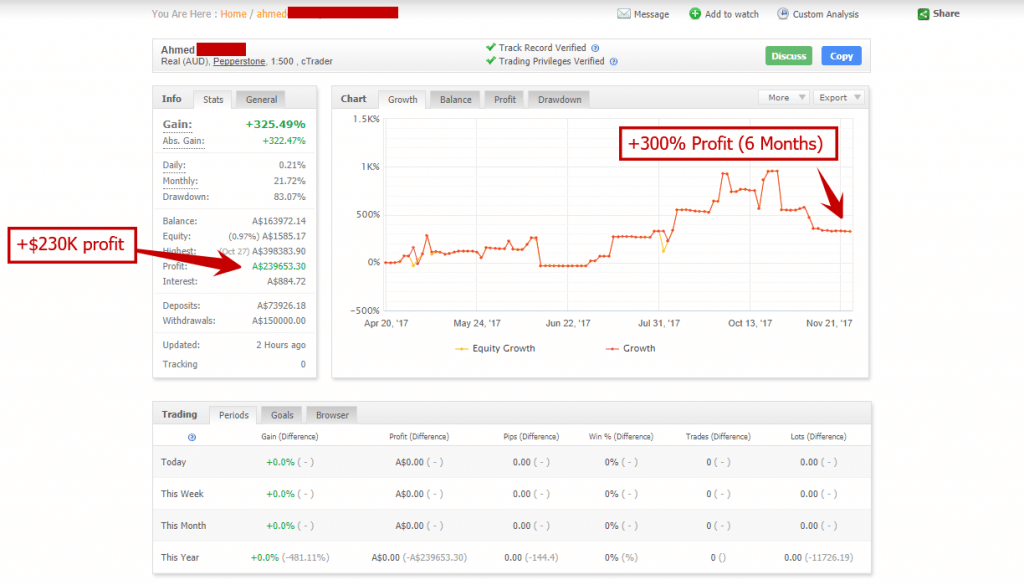
Oh and Ahmed whose trading stats you’ve been looking at?
He made a +300% profit in the last 6 mos (see below).
NOTE: Do you want to learn how to make money trading price action? Find out more by seeing our price action course.
#2: When Not To Trade Breakouts
I have many different trading strategies, but I definitely trade breakouts. And I’ve shown I make money in forex trading.
I have a unique approach towards trading breakouts which you can learn about here.
But there is a key time to trade breakouts, and places on your chart you should not trade breakouts. Today I’m going to talk about two places you should not trade breakouts from.
1. Don’t trade breakouts in the middle of a corrective structure (range)
If you think about the order flow behind a corrective structure (see image below), you can see there is a balance between the buyers and sellers.
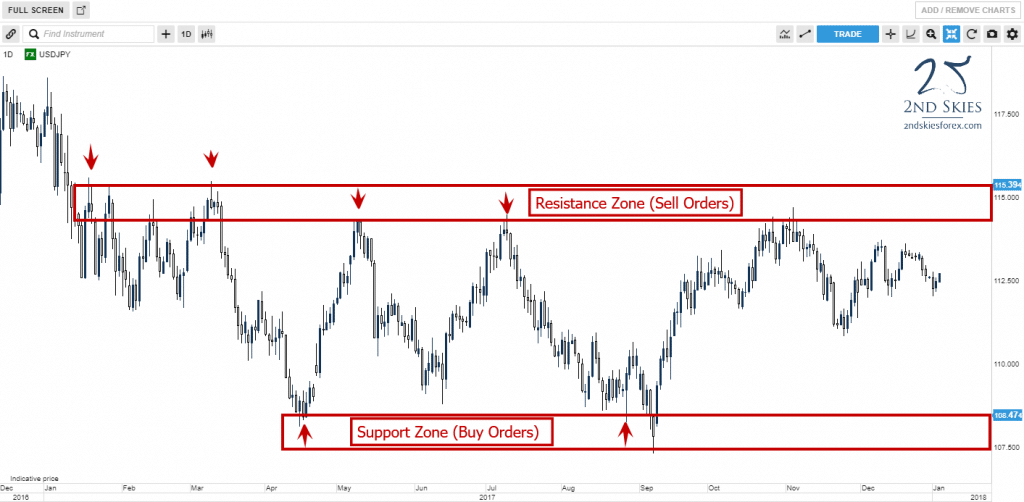
There is a ‘balance‘ because both sides relatively agree on where the price (or value) of a forex pair (or instrument) should be.
The bulls say the floor of the corrective structure is where they see the most value, and bears see this at the top. That is why the range persists, because both sides are participating at clear levels and zones.
This means their no directional winner in the order flow (bulls/bears). And this is what we mean when we say a corrective structure is ‘balanced‘.
In the middle of any range or corrective structure, there is the least profitability available for trading a particular direction (i.e. trading breakouts) because there is an approximate 50% chance the market will go up or down in the middle of any range.
So avoid the middle of the corrective structure and range for trading breakouts.
2. Don’t trade breakouts just before a major support or resistance level
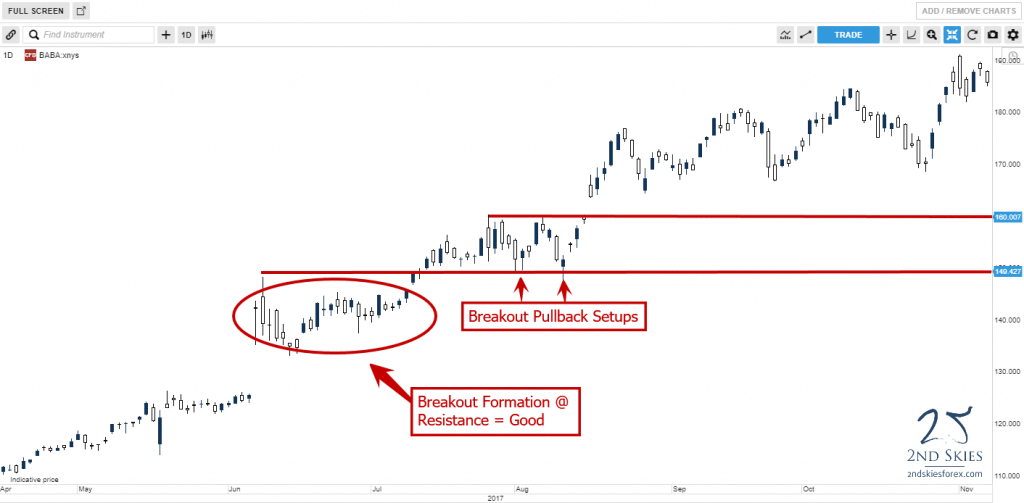
Looking at the chart below, you see the top line is a major resistance level, and just below it is a breakout formation.
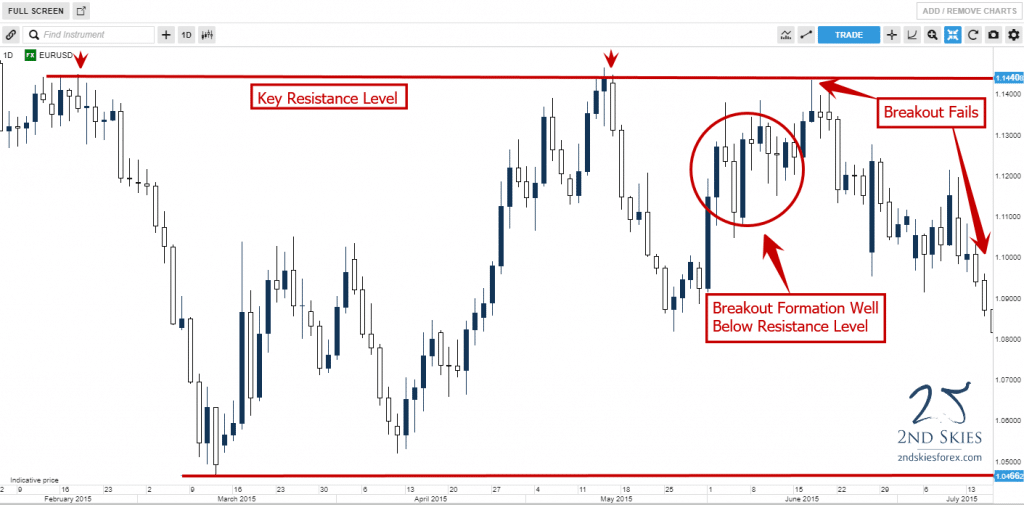
These often form to create the illusion the market will keep going higher through the major resistance level. It can also form by bulls encountering the first layer of a resistance zone which is why the market kept pausing just below the level.
Whichever the reason (or both), I do not recommend trading breakouts just below/above a key level.
Better to wait till the price action is just below/above the actual support or resistance level. If you have less experience with this, we recommend taking a breakout pullback setup (see below).
#3: Let’s look at where you take profit
There are many components to your trades you’ll need to study, analyze and refine. One of those is where you take profit, or your TP.
Now I’d like you to do a little experiment with your own trading account (demo or live):
I’d like you to look at every trade you made money on. Now look at the data in myfxbook, and see how many of those that a) closed at your TP, b) closed manually before your TP.
Record how many trades you made of each (close manually/hit TP), and see which one made more money.
If it’s ‘a‘, then you likely have a solid grasp of finding good targets you can hit consistently. So no need to close them early.
This is what is called set and forget trading.
If it’s ‘b‘, that means you have a good grasp of when your profitable trades are going to turn around, and should continue manually closing your trades.
One last final metric is to look only at the ones you closed manually before they hit their TP, and see if they would have hit your TP anyways before hitting your stop loss (SL).
If that is true, then you’re missing a lot of profit (losing money) by not holding them to their full take profit and should stop manually closing your trades.

In Summary
We covered 3 main points in this article. They were:
1) Analyze your performance for each forex pair and trading instrument
2) When not to trade breakouts
3) Examine your take profit targets
Now that you know why you need these 3 things to make money trading, it’s time to do the work and find leaks in your game, while increasing how much money you make per trade.
Do you want to learn several more ways to increase your profits and how much money you make per trade?
Then check out my Price Action Course where you get life-time membership, access to the members trade setup forum, market commentary and a free skype session with me, so quite a lot.
To learn more about making money with forex, click here.
Now make sure to tell me what you thought about this article and if these 3 things will help you make money trading.
In today’s article I’m going to talk about an important subject in forex trading psychology called ‘the comfort zone‘.
Before we get into this important trading and mindset lesson, I’d like to talk about a close relative of mine named ‘Vesh‘.
Vesh recently had his 2nd hemorrhagic stroke in 5 years.
Most people who have two hemorrhagic strokes aren’t very functional. Vesh is definitely an exception.
He was a database programmer for decades, and ironically, after the stroke, can still do database programming.

However there are many things he cannot do as a result of his two strokes.
Such as numbers…he’s not that good with numbers any more, and often gets them confused. If he’s talking about something from 100 years ago, he might say ‘Back over 20,000 years ago in England, the British…“
To compensate for his brain being damaged, he eats the same thing every day. It’s what he’s most ‘comfortable’ with and makes it easier for him. Man is it easy grocery shopping for him every two weeks 🙂
How does this relate to the comfort zone and trading successfully?
How your brain and body is wired right now is what you feel most ‘comfortable‘ doing. My friend Ross runs 5 days a week, 2 miles a day, so he feels quite ‘comfortable‘ running 2 miles a day 5x per week.

However if one day, I came up to him and said, “Today you’re going to run 20 miles, and you’ll do this 3x this week,” Ross is not going to feel very ‘comfortable‘. In fact, he’s going to feel profoundly uncomfortable attempting such a feat.
Just like Ross, whatever is outside of your brain, body and psychology to do comfortably right now is called being ‘outside’ your ‘comfort zone‘.
This is where an article by Noah Kagan comes in. Noah is a highly successful entrepreneur who recently wrote an article called ‘How to Step Outside Your Comfort Zone in 2018′.
It’s a well written article with some simple steps to accomplish this, which I definitely recommend reading.
However he makes one major error in how he defines growth in relationship to your comfort zone.
He says, “growth happens outside of your comfort zone.“
While technically true, it’s also ‘false‘ at the same time. Wait, how can something be both true and false at the same time? Let me explain.
Growth in your brain, mindset and body will happen when you go outside your normal programming, or what you’re currently wired to do easily now.
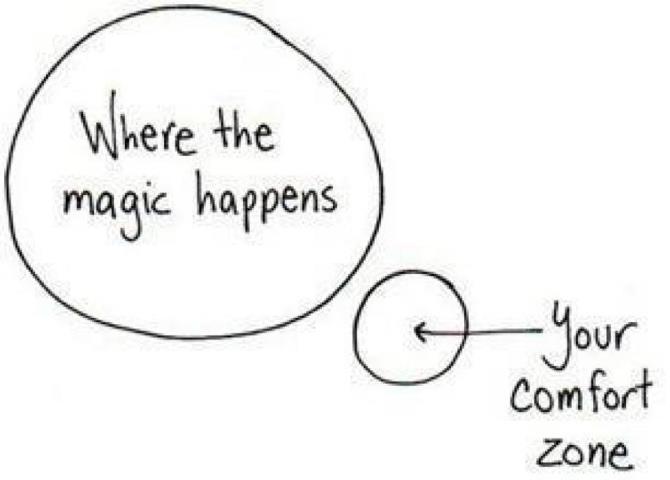
The same goes for you and your trading, and this is why it’s important to go ‘outside‘ your comfort zone, so Noah is correct in saying ‘growth happens outside your comfort zone‘.
However, Noah fails to make an important distinction here regarding your comfort zone.
There is a range you can go beyond this where there is ‘growth’. This range or ‘zone’ has also been discussed by those who talk about ‘being in the zone’ or ‘peak performance’ (image below).
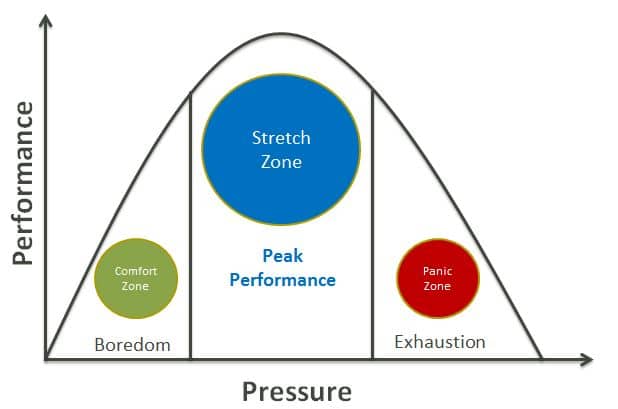
However, if you go too far outside this zone or range, you won’t grow at all. In fact, you will almost certainly fail.
Hence there is a range you can go outside of your comfort zone and still have growth. This is what I call the ‘challenge zone‘ or ‘learning zone‘.
Asking Ross to do 2.5 miles per day is ‘challenging’ himself.
But asking Ross to run 20 miles today, and he won’t grow. He’ll struggle, experience pain, and most likely will fail.
The same goes for you and your trading (especially if you’re struggling).
Where you are right now in your trading process, there are definitely some strategies, methods or tasks you are just not ready for right now.
For example, if you don’t know how to read the basic pillars of price action context in the forex market, you’re definitely not ready to trade a price action strategy. If you don’t even have a trading plan that you can easily execute day in day out, you’re not ready to trade $10 million dollars.
Hence while Noah was correct in stating that ‘growth happens outside your comfort zone‘, so does failure by going too far outside your comfort zone. Venturing too far outside your comfort zone is what I call the ‘panic zone‘ or ‘failure zone‘ (see below).
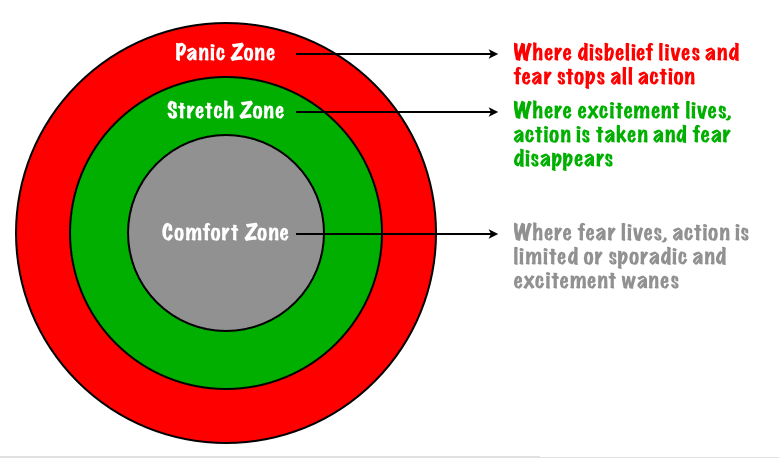
You have to make this important distinction (and know the difference) if you want to succeed in trading forex.
I think this is where most struggling traders in their trading process fail. I see many traders taking on methods, skills or strategies they simply aren’t ready for yet.
While I think it’s a good idea to ‘challenge‘ yourself and go outside your comfort zone, going too far will almost always lead to failure.
It’s important to learn what are the various steps, skills and mindset you’ll need to learn along the way so you don’t go too far outside your comfort zone, and set yourself up for inevitable failure.
Thinking you can start making money trading price action without having a trading plan, without proper risk management, or without forex training isn’t a path to success. It’s setting yourself up for certain failure.
This is one of the most common mistakes I see struggling traders and students make.
I get it…you seriously want to succeed in trading forex, you want to work from home, and make more money than you could in any ‘job‘. And you see that I make money trading and am a professional trader.
I get it…who doesn’t want to do that? That’s why you’re here, to learn how to trade the forex markets.
But there is a difference between the challenge zone (growing), and failing consistently (failure zone).
If you are constantly losing money trading, and consistently making the same mistakes, most likely you’re going too far beyond your current skill set.
You’re likely in the ‘failure zone‘, which 99+% of the time will lead to you losing money trade after trade, month after month, feeling like you’re not going anywhere.

If you have this feeling, that is actually a good thing, because it’s your self-image and unconscious mind telling you “Hey, you’re too far outside your comfort zone.“
If that is your regular experience, then it’s time to get a forex mentor, one with a proven track record of successful forex trading.

Hence if you want to stop making the same mistakes day in-day out, month and after month, losing money consistently, then check out my trading course or my mindset course, both of which give you insights into the psychology of successful traders as well as a step by step process on how to trade successfully.
Did I describe your process and trading experience? Does any of this sound like you? If so, I want to hear your comments and feedback below.
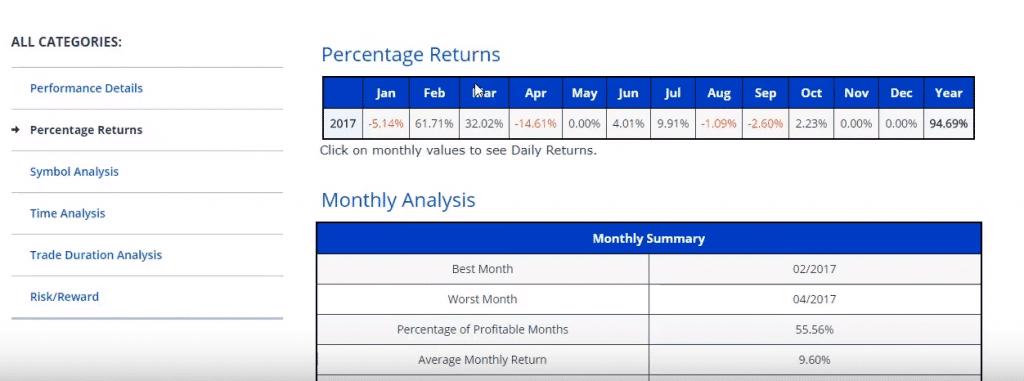
Chris Capre shares his verified forex trading results for 2017. If you want to see a professional forex trader’s results, make sure to watch the video where I share with you how much profit I made (%) for the year, risk management, % trading accuracy, profitable months, and more.
NOTE: Check out Chris Capre’s Verified Forex Trading Results for 2017
As 2017 comes to a close (an interesting one thus far), I wanted to share my top 12 currency trade ideas for 2018. In sharing these forex trading Ideas, I’ll be talking about the price action context, key levels, trend bias, and where I think these forex pairs, stocks, CFD’s, commodities, and or global markets will hit next year.
FYI: They are not in any order of value or strength. Just what I’m seeing as the top currency trade ideas for 2018.
1) Bitcoin
As I’ve talked about in my video on crypto-currency trading, I think most people are overlooking key aspects of Bitcoin. In my view, it’s disruptive on a global scale, and will likely be adopted more in 2018 than it was in 2017.
I personally bought bitcoin around $3,000, Ethereum around 200, and Litecoin near 42. I even tweeted about this ahead of time.
Where are they now?
Bitcoin +320%
Ethereum +210%
Litecoin +200%
You’re welcome…
Now while I think all of them are due for a pullback (which they average about 1x every quarter between 25-40%), I’m looking at buying more bitcoin for a long term play. Let’s get into the price action context and where I see it going.
Bitcoin Price Action Analysis
Looking at the chart below, you can see where the crypto currency started, and where it is now. In my view, price action like this looks almost parabolic, and getting ‘frothy’. Do I think the price action is exhaustion? I’m not 100% there yet, but we’re getting close IMO.
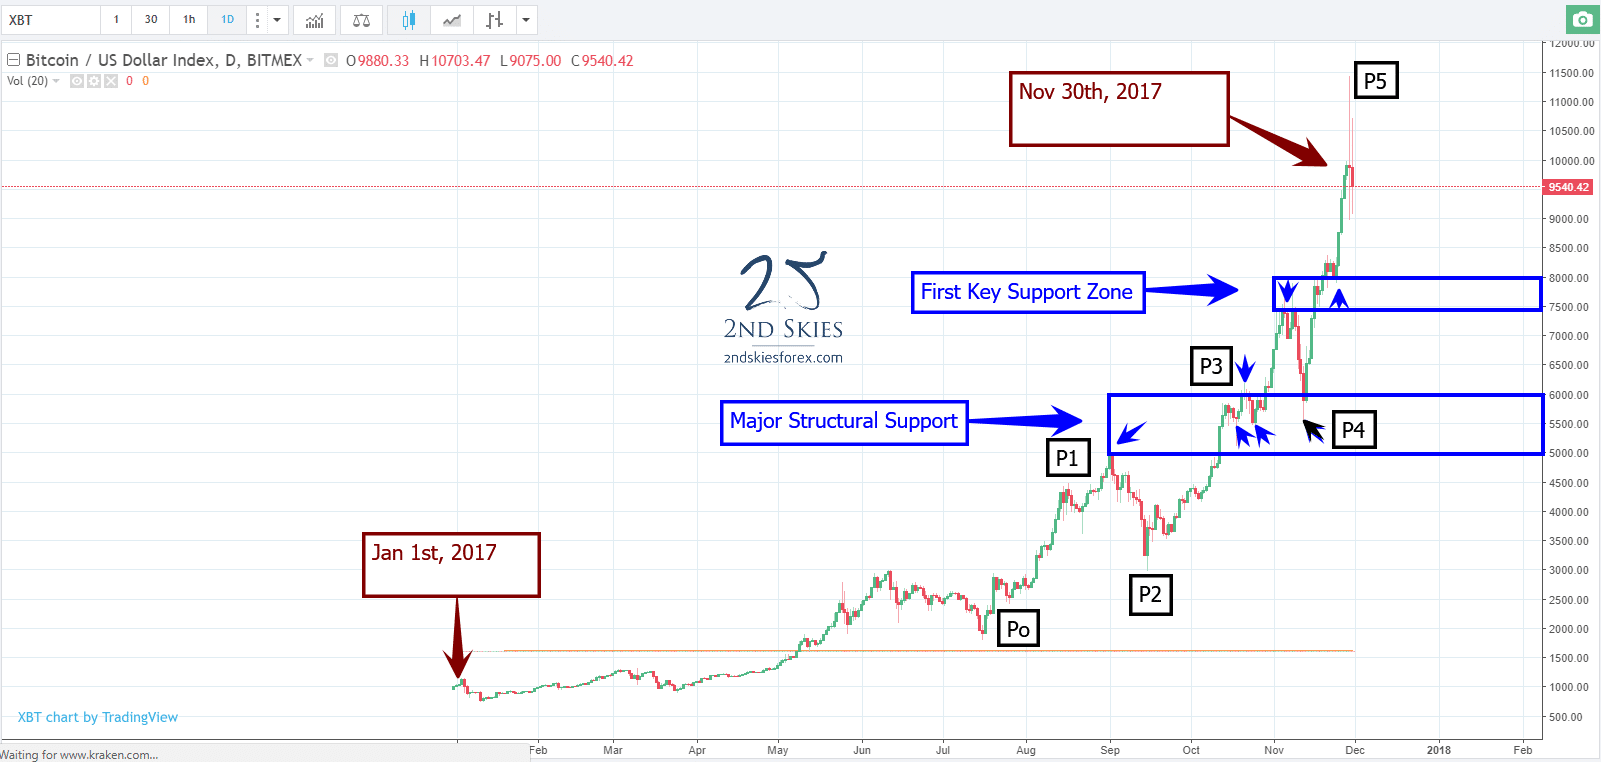
In parabolic, or exhaustion price action moves, each successive leg climbs faster, higher or both and will have a steeper angle on each impulsive leg up. This has to do with an acceleration of order flow as more players from institutional to retail move in.
If you look at the moves from P0 to P1 (1800-4900), that is $3100 from July 16th – Sep 1 (46 days). The next leg P2-P3 went from $3000 – $7600 (+$3600) in about 50 days. The last run went from $5500 – $11400 (or +$5900) in just 17 days. So all 3 impulsive legs up getting bigger in price moves each time. That is looking ‘frothy’ to me.
Hence I’m looking to buy on a pullback either at the first key support zone, or the major structural support. Also, a 40% pullback in price would bitcoin just under $7000, while a 30% pullback towards $8000.
Where do I think bitcoin is going next year? Assuming it doesn’t have a major crash (like it has 3x in the past of 50+% or more), IMO bitcoin will hit $20K before the end of 2018. If we get that major crash, it could be years before it makes new highs.
To Summarize:
ST Price action context: neutral to slightly bearish with current volatility
MT Price action context: bullish
LT Price action context: bullish
2) USDCAD
Jumping straight into the price action context for the CAD, the most important thing in my mind is the false break that happened late in Q3.
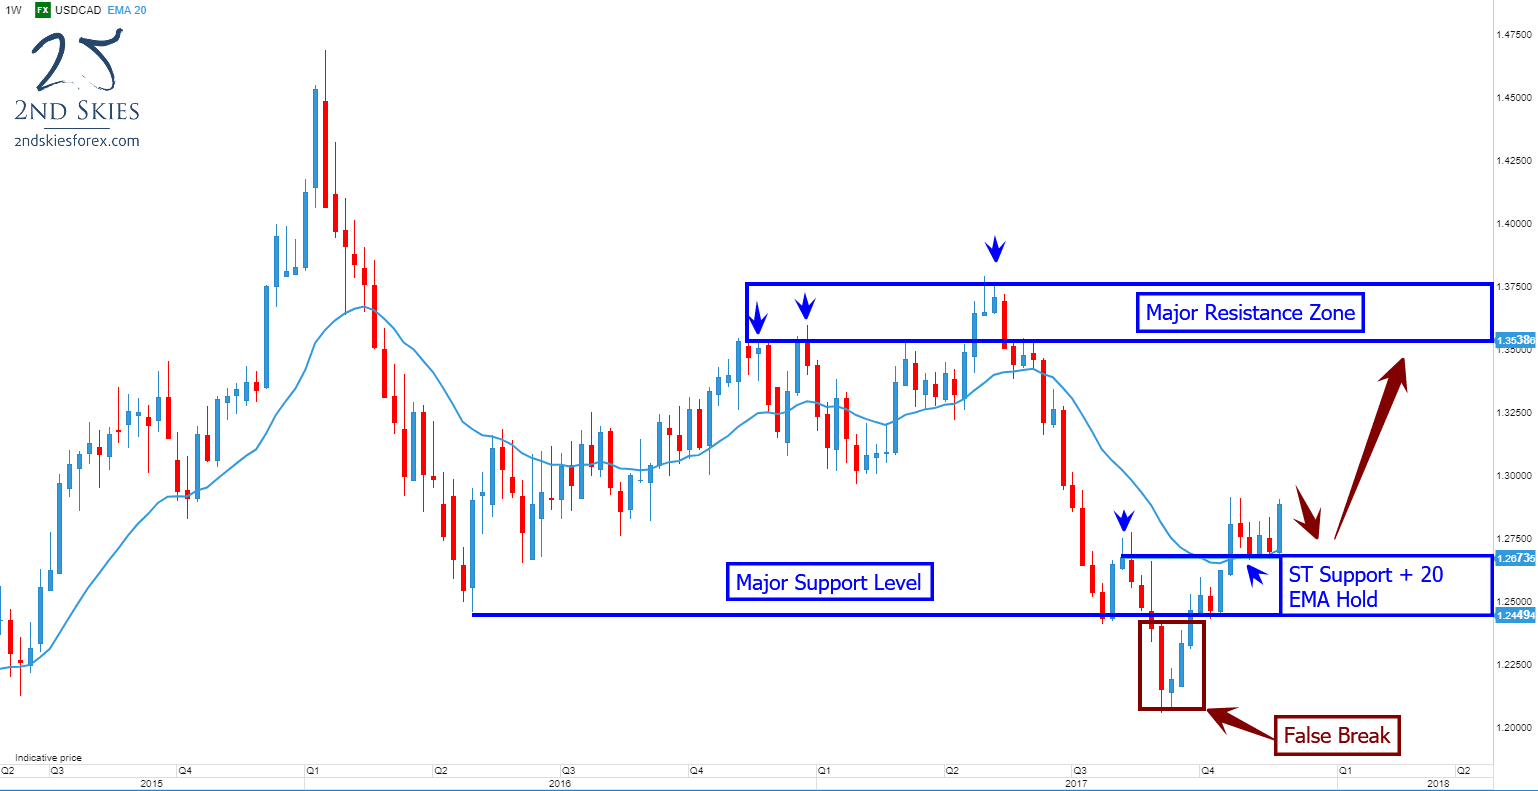
After breaking a multi-year support level around 1.2449, instead of finding new sellers and continued interest from current shorts, the pair broker sharply back above the key level, forming a false break setup.
After spending 3 weeks holding the key level, the pair has surged and is now holding for over a month above the weekly 20 EMA. All of these signs point to IMO more bullish prices for the pair.
1.2673 and 1.2449 become ST support in the current context while the next key resistance zone for bulls is between 1.35 and 1.3750.
To Summarize:
ST Price action context: bullish
MT Price action context: bullish
LT Price action context: neutral
Alibaba (BABA)
One of the most successful companies to come out of China recently, Alibaba (owned by Jack Ma) has had an amazing 2017. Starting at about $90, the stock is set to end November around $175, or a ~95% gain on the year.
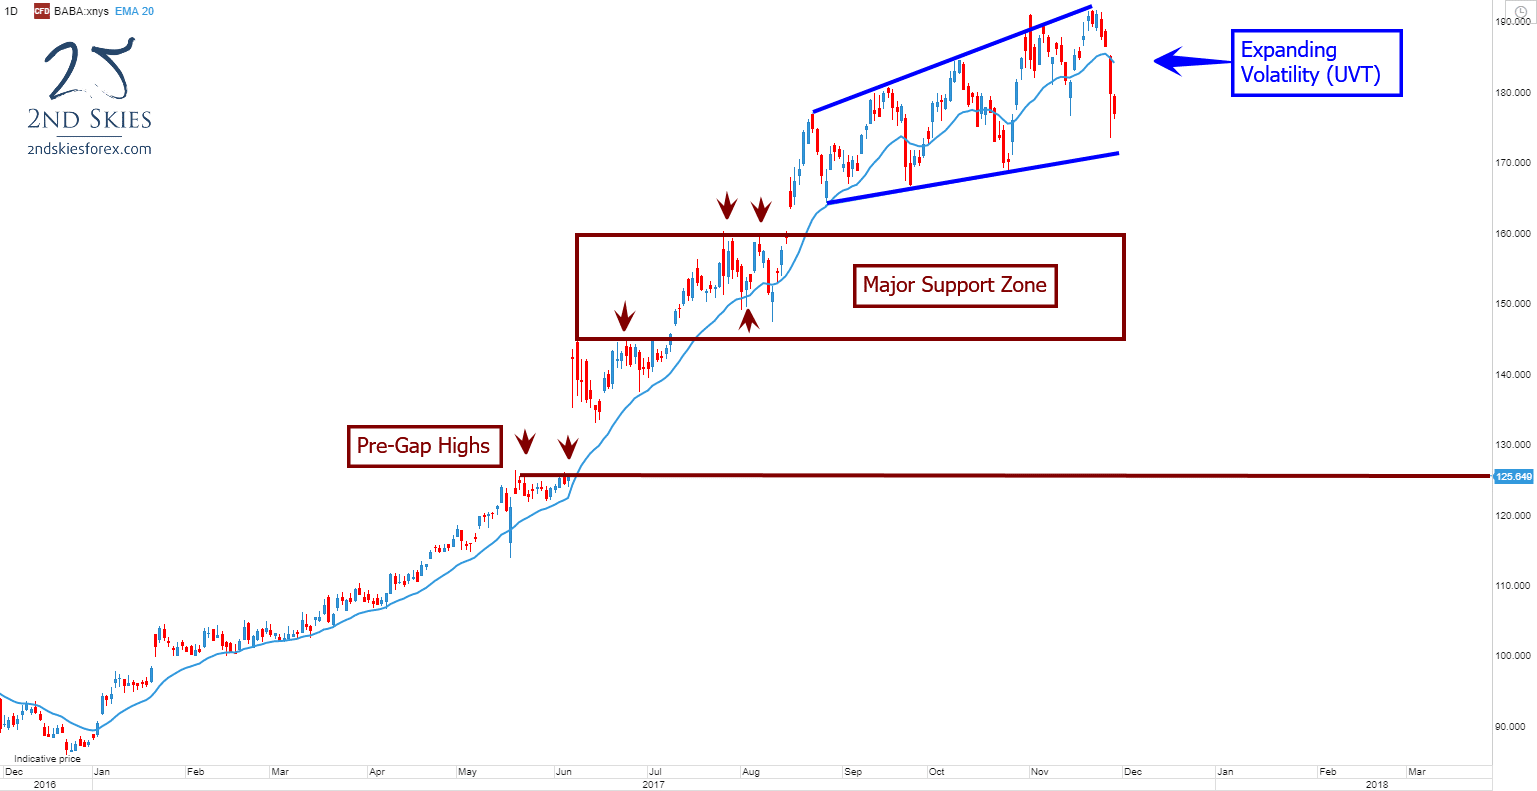
When I look at the current trend and price action, I see a clear bull trend with expanding volatility. Course members will recognize the UVT and what that means in terms of the order flow behind the market.
The expanding volatility (or UVT) doesn’t signify a trend change, so I’m remaining bullish on the stock for 2018.
The first major support zone comes in just under $160 and goes to about $145 where you can see a PBO setup.
The next support IMO is the pre-gap highs at $125.
Assuming we don’t get a major market crash (similar to 07-09), I’m expecting Alibaba to hit $300 next year, and a ‘most optimistic’ case with a $400 price target.
Simply put, this doesn’t look like the price action context or chart of a stock that is reversing or ending it’s bull trend.
To Summarize:
ST Price action context: neutral/volatile
MT Price action context: bullish
LT Price action context: bullish
Want to see my other top trades for 2018?
Then check out my Advanced Price Action Course where my members got a full video breakdown of my other top trade ideas for 2018.
In that video, I discuss the price action context, key levels, trend bias, potential entry points and price targets.
Course members also get access to my member market commentary (2-3x per week), access to the private member trade setups forum, trader quizzes, private member webinars and a free skype follow up session with me, so quite a lot.
I hope you enjoyed these trade ideas and hope to see you in the members area soon.
Chris Capre talks about trading crypto currencies, bitcoin, ethereum, litecoin, etc, how he’s trading and investing in it, and how he recommends you relate to trading crypto currencies.
Read more
Here is a video showing a 2ndSkiesForex student making 15% profit in the last 3 months on a live trading account. This student was using our price action strategies for forex trading. He shows great risk management, discipline, control, consistency in his trading, and a steady increase in his equity curve. I think this is a good example of how you can trade price action on any time frame while holding a full time job. So whether you’re trading the daily chart, 4hr chart, or 1hr chart, even with a full time job, you can develop consistency in your trading.
Read more
How would you handle a $500,000 loss? Chris talks about a real-life experience and how he handled the situation.
Read more
Is it possible to consistently make $5,000 per week in forex trading? Watch the video…
Read more
