Chris Capre’s current live open price action & ichimoku trades: USDMXN, EURRUB, EURMXN, BIG, DIS, AC, ISD

New to Forex? Then check out my FREE Learn Forex Trading Course with videos, quizzes and downloadable resources

Top Trade Review: Check out our latest Forex Top Trade Review with Sascha (our Course Instructor) nailing it for +201 Pips!

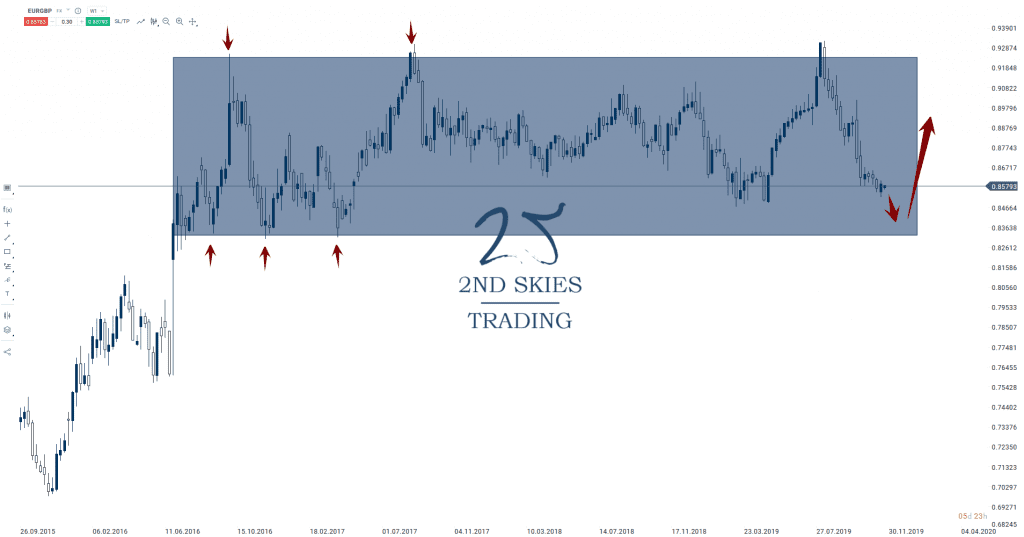
Forex Trade Idea: EURGBP – Potentially Breaking 2 Year Corrective Structure (weekly chart)

Price Action Context

Since the summer of 2016, the EURGBP forex pair has been trading inside a large corrective structure between 8300 and 9300.

While the pair bounced off the structural support level around 8300, the pair didn’t manage any material upside gains, climbing no higher than the mid-85 handle.

I’m suspecting a break of this key support level soon, which would open up the pair to some technical selling and a potential move towards 8080.
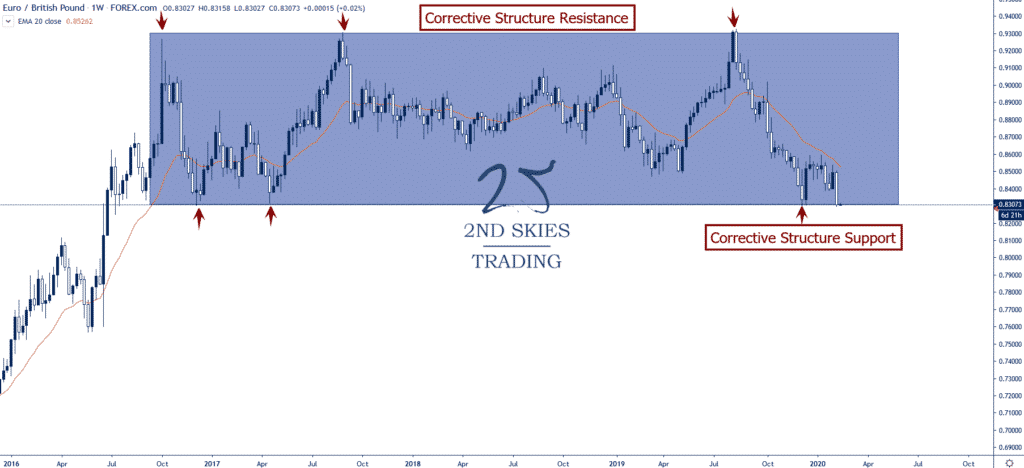
eurgbp corrective structure 2ndskiesforex

Trending Analysis

MT neutral while inside the large corrective structure, ST bearish.

Key Support & Resistance Levels

R: 9042, 9300

S: 8300, 8080

Stay tuned with our members market commentary for updates.

******

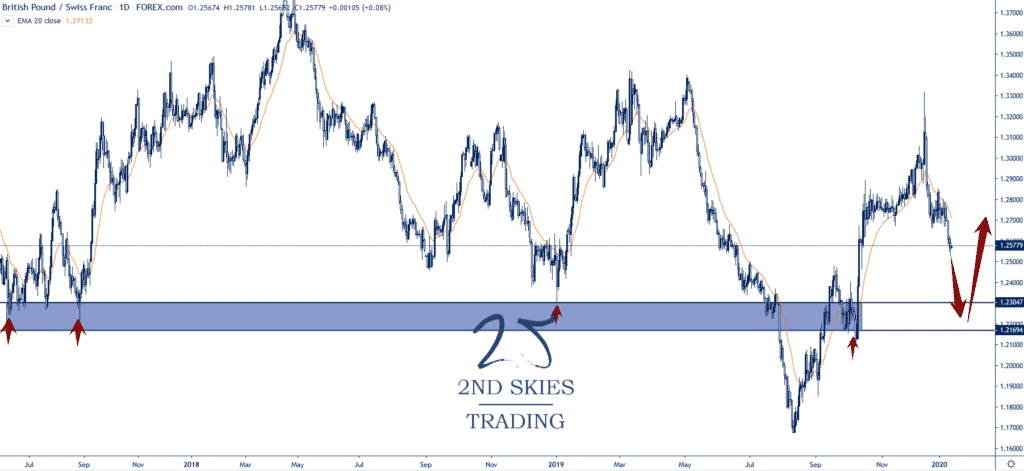
Commodity Trade Idea: Silver (XAGUSD) – CT Corrective Structure, Looking to Buy (daily chart)

Price Action Context

Holding above the role reversal level at 16.54, Silver (XAGUSD) has stayed mostly buoyant above the RRL and hitting a yearly high of 18.81 before falling back.

Looking at the chart below, the selling pressure is weak and inconsistent, forming a CT (counter trend) corrective structure.

With the bounce off of 16.54 being highly impulsive, and the pullback corrective, I’m suspecting the next leg is more likely to the upside, and am looking to buy.
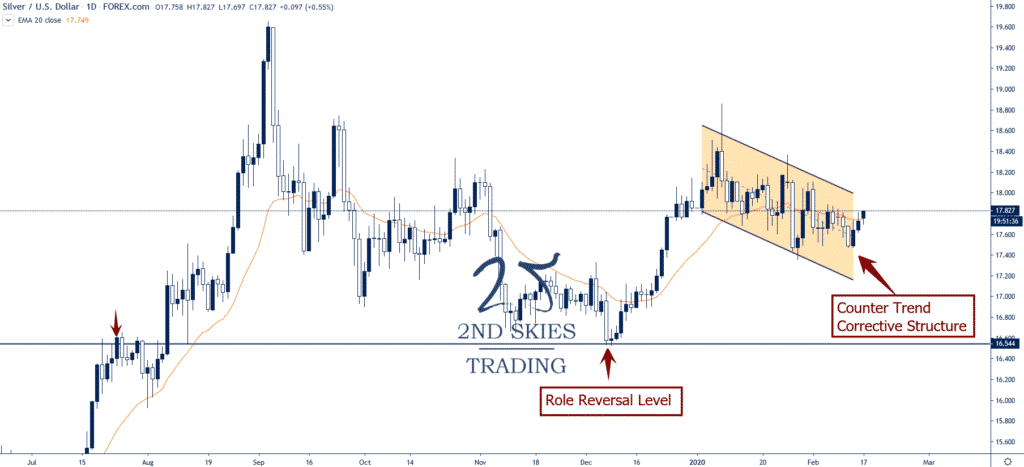
silver corrective structure 2ndskiesforex

Trending Analysis

ST bearish while inside the corrective structure, MT bullish while above 16.54 on a weekly closing basis.

Key Support & Resistance Levels

R: 18.66, 19.56

S: 17.36, 16.54

******

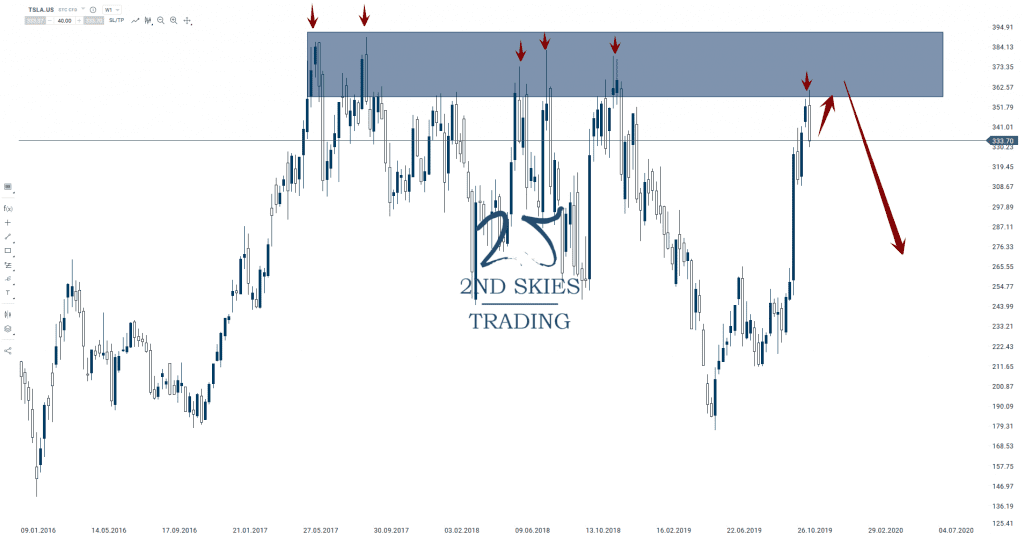
Stock Trade Idea: Tesla (TSLA) – Parabolic & Exhaustion Price Action, Potential Sell Setup (4hr chart)

Price Action Context

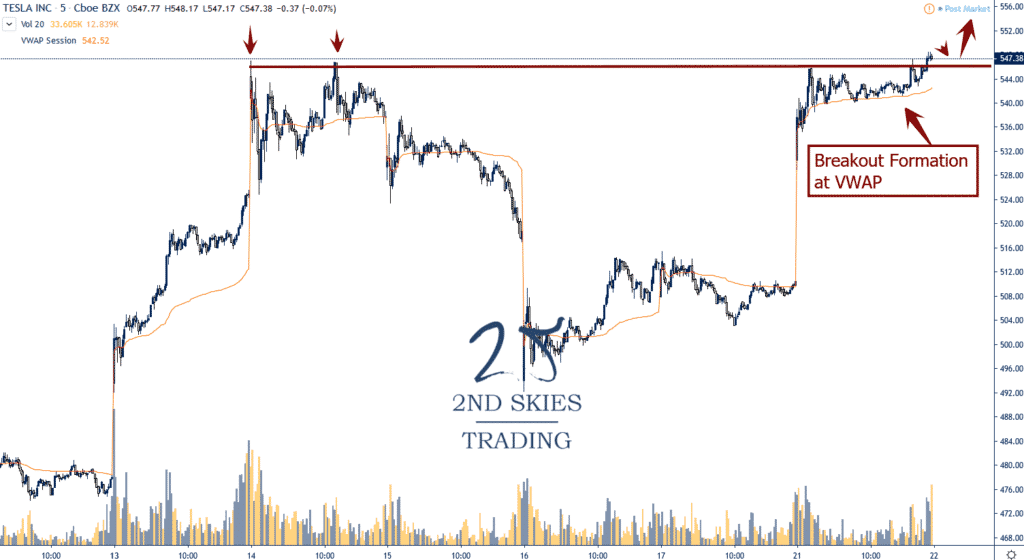
After creating one of the mother of all short squeezes, Tesla has gone parabolic, climbing from 424 to start the year, rip-roaring up to an all time high of 965 by the 4th of Feb.

When you look at the price action in the chart below, you can clearly see it went parabolic, however the price action is showing signs of exhaustion.

For bulls, the stock has been holding the daily 20 ema, but now that the 965 is a part of history, the 2nd time around, it should act as resistance, potentially offering a sell setup.
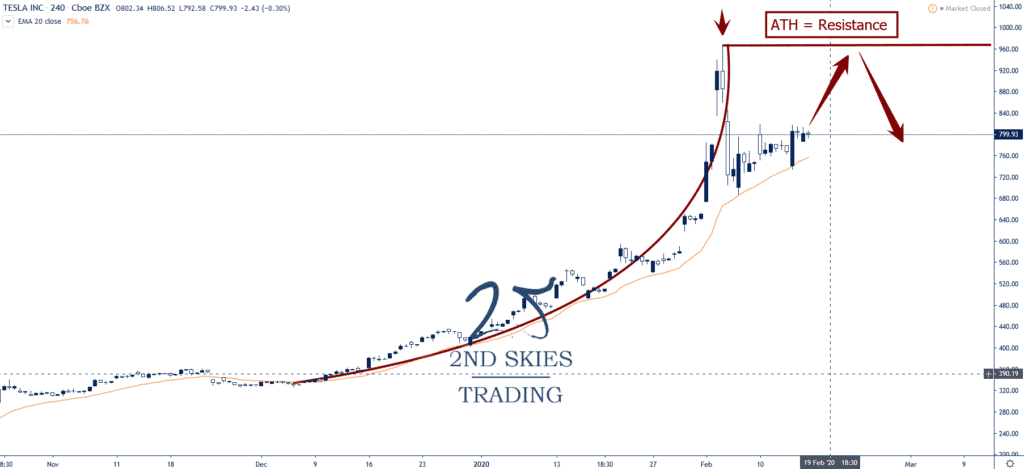
tesla stock trade idea 2ndskies

Trending Analysis

ST & MT bullish while above the daily 20 EMA and 683 on a weekly closing basis.

Key Support & Resistance Levels

R: 965, 1000

S: 683, 542

******

Chris Capre’s current live open price action & ichimoku trades: USDMXN, EURRUB, EURMXN, AUDNZD, BIG, DIS, AC, ISD

New to Forex? Then check out my FREE Learn Forex Trading Course with videos, quizzes and downloadable resources

Top Trade Review: Check out our latest Forex Top Trade Review of my student making +190 pips profit on the AUDJPY forex pair.

Forex Trade Idea: EURUSD – Large Corrective Structure, Looking to Buy (daily chart)

Price Action Context

Since November of last year, the EURUSD has been trading within a large corrective structure between 1.10-ish and 1.12.

We’re going to keep playing this corrective structure until we get a weekly close outside of it, and thus are looking to buy.

eurusd forex pair range structure 2ndskies

Trending Analysis

ST & MT neutral so watch structure for next directional bias.

Key Support & Resistance Levels

R: 1.0990, 1.09

S: 1.1175, 1.1245

Stay apprised with our member market commentary for updates

******

Index Trade Idea: Nikkei 225 – Trying to Hold Key Support Level (4hr chart)

Price Action Context

After a solid bull run to end last year peaking out at 24K, the Nikkei 225 has recently suffered a 1000+ point pullback, likely due to fears over the corona virus affecting the region.

Currently the index is parked inside a large corrective structure at the top of a bull run, which does point to the more probable direction being up, but we could be distributing some order flow up here.

nikkei 225 trying to hold key support 2ndskies

Trending Analysis

ST neutral while MT bullish. A weekly close below the structure and key support zone around 22800 negates the ST bull trend and shifts bias to bearish ST. A bounce from here puts the recent resistance level at 24K into focus.

Key Support & Resistance Levels

R: 24000, 25000

S: 22800, 22166

******

Commodity Trade Idea: Palladium (XPDUSD) – Holding at Daily 20 EMA Support (4hr chart)

Price Action Context

After the parabolic trend and exhaustion price action earlier, Palladium (XPDUSD) has found ST support at the daily 20 EMA (which comes in around 2250) and has since bounced about $100 and is attempting re-attack the recent parabolic highs.

palladium daily 20 ema support 2ndskies

Trending Analysis

ST bullish but MT neutral to bearish while the parabolic trend highs around 2520+ are still in place.

Key Support & Resistance Levels

R: 2350, 2520

S: 2250, 2149

Chris Capre’s current live open price action & ichimoku trades: USDMXN, EURRUB, EURMXN, BIG, SIG, DIS, ISD

New to Forex? Then check out my FREE Learn Forex Trading Course with videos, quizzes and downloadable resources

Top Trade Review: Watch this new Top Trade Review of my student making +177 points of profit on the Swiss 20 index

NOTE: To all our 2ndSkies Trading Community – Please be smart/safe/prepared with this corona virus going on.

Forex Trade Idea: USDCNH – Strong Buying On Market Open, Key Resistance Just Above (weekly chart)

Price Action Context

With news out of China and the corona-virus continuing to spread, risk off has been the theme as of late, and the CNH has been suffering as a result (being ground zero of the outbreak).

For the last 4 days, the USD has gained strongly against the CNH and until this outbreak is contained, we expect this to continue.

Currently the forex pair is parked just below key resistance near 6.98. If we get a daily close above this level, then expect the pair to challenge the 7.05 and 7.15 levels which are the 2019 highs.

Trending Analysis

ST bullish and MT bearish. Need daily closing above 6.98 to turn MT trend analysis to bullish.

Key Support & Resistance Levels

R: 6.98, 7.19

S: 6.86, 6.7

Stay apprised with our member market commentary for updates

******

Index Trade Idea: S&P 500 – Potential Bull Trend Channel Break (daily chart)

Price Action Context

In one of the strongest bull trends in history, the S&P 500 has become rather of a joke amongst traders lately with its inability to actually sell off.

However with the corona virus starting to become more of an issue, the US index sold off about 30pts from open to close on Friday, and has gapped down below the 20 ema to start the week.

Looking at the bull trend channel on the chart, traders will be watching for a break of the channel and daily close below the 20ema as the last 2 days of selling have taken away the prior 10+ days of price action.

s&p 500 bull trend channel 2ndskies

Trending Analysis

ST bearish with the current risk sentiment while MT bullish until the channel is broken.

Key Support & Resistance Levels

R: 3336, 3400

S: 3244, 3154

******

Stock Trade Idea: NVAX (Novavax) – Watching Gap + Spike Highs For Fading Opportunity (5 min chart)

Price Action Context

With the corona virus taking the top headlines globally as of late, biotech stocks have been going gang busters with vaccine makers getting huge spikes in volatility and value.

NVAX (Novavax) jumped by over 80% on the 21st last week and has been holding its gains since.

Current spike high at 10 is the target for bulls, so any break above could create some trapped bull traders should it slam back below this.

Meanwhile we got a corrective structure betwee 6.84 and 8.34 which has been dominating the price action since the 22nd.

Any break of this higher will target the 10 handle while breaking below would likely fill the air pocket to the gap bottom near 5.60

nvax stock trade idea 2ndskiesforex

Trending Analysis

ST & MT bullish while above gap bottom around 5.60 on a daily closing basis.

Key Support & Resistance Levels

R: 8.34, 10

S: 6.87, 5.81

Chris Capre’s current live open price action & ichimoku trades: USDMXN, EURRUB, EURMXN, BIG, SIG, DIS, ISD

New to Forex? Then check out my FREE Learn Forex Trading Course with videos, quizzes and downloadable resources

Top Trade Review: Watch this new Top Trade Review of my student making +177 points of profit on the Swiss 20 index

Commodity Trade Idea: XPDUSD (Palladium) – Potential Breakout Setup After Parabolic Price Action (1hr chart)

Price Action Context

As we recently covered in our weekly market commentary, palladium was forming a parabolic price action move and likely pulling back.

As you can see from the chart below, the precious metal dropped over $160 (over 6%) by early next week offering a great day trading setup.

For now, the PM has built up a higher low while maintaining the prior high, so a potential breakout setup is forming.

Watch for the pattern to continue. Any breakdown of the pattern suggests a corrective structure is in play.

palladium breakout setup 2ndskiesforex

Trending Analysis

MT bullish while 2360 is maintained on a daily closing basis. ST watching the price action to see if the breakout pattern plays out or breaks down.

Key Support & Resistance Levels

R: 2520, 2600

S: 2360, 2136

Stay tuned with our members market commentary for updates.

Chris Capre’s current live open price action & ichimoku trades: USDMXN, EURRUB, EURMXN, BIG, SIG, DIS, ISD

New to Forex? Then check out my FREE Learn Forex Trading Course with videos, quizzes and downloadable resources

Top Trade Review: Watch this new Top Trade Review of my student making +177 points of profit on the Swiss 20 index

Stock Trade Idea: TSLA – Forming A Bullish Breakout Pattern Against the All Time Highs (5 min chart)

Price Action Context

After going gangbusters to start the year, Tesla reached an all time high of 547 before selling off impulsively for two days.

Notice however the stock gapped up today right up to the all time highs and current resistance level of 547.

Since then, the stock did a gap-and-go pattern while forming a breakout pattern just above VWAP.

This to me is a bullish sign so if the market opens tomorrow and breaks the resistance, there could be some great day and swing trades to get long.

tesla stock breakout trade idea 2ndskiesforex

Trending Analysis

ST & MT bullish while above 493 on a weekly closing basis.

Key Support & Resistance Levels

R: 548, 575

S: 495, 448

Stay tuned to the members market commentary for updates.

Chris Capre’s current live open price action & ichimoku trades: USDMXN, EURRUB, EURMXN, BIG, SIG, DIS

New to Forex? Then check out my FREE Learn Forex Trading Course with videos, quizzes and downloadable resources

Top Trade Review: Watch this live trade review of my student banking +115 pips of PROFIT & +11R on the USDJPY

Forex Trade Idea: EURMXN – Impulsive Selling At Resistance, Staying Bearish (4hr chart)

Price Action Context

Continuing with the bear trend, the EURMXN had found some minor support around 20.96 which mostly mounted a small corrective pullback up to 21.25.

This was followed by more selling which broke below the prior support.

Notice how the corrective pullback really struggled at the 20.96 resistance level which led to impulsive selling price action.

This tells me the bears are still in control so I’m looking to add to my shorts by watching for a corrective pullback into resistance to trade with the trend.

Trending Analysis

Bearish ST and MT so am staying bearish until we get a weekly close above the 21.30 level on a weekly closing basis.

Key Support & Resistance Levels

R: 20.96, 21.25

S: 20.12, 19.03

Stay apprised with our members market commentary for updates.

******

Index Trade Idea: Stoxx 600 – Breakout In Play, Looking To Buy Pullback (daily chart)

Price Action Context

In our top trades for 2020, we talked about the Euro Stoxx 600 being bullish and looking to buy on a pullback into support around 412.

The index has done exactly that, launching higher and forming a breakout setup which has cleared the 2019 all time highs in 418 and is now holding well above it.

I’m expecting this price action to continue so am looking to get long on a pullback into support.

euro stoxx 600 price action 2ndskies

Trending Analysis

ST & MT bullish and looking to stay long till we get a weekly close below 408.

Key Support & Resistance Zones

R: 450, 500

S: 418, 410

******

Commodity Trade Idea: XPDUSD (Palladium) – Parabolic Price Action, Watching Resistance (1hr chart)

Price Action Context

As we commented about on our youtube channel, Palladium has gone parabolic to end last week, going from 2136 on the 15th skyrocketing up to 2520 by the 17th.

If you look at the curvature in the price action, it went parabolic, which suggests possible exhaustion.

The PM pulled back sharply to end last week almost closing below 2400.

palladium parabolic price action

Trending Analysis

MT bullish but ST we need to clear the parabolic highs above 2520 to keep the bull trend going. Otherwise this level will act as resistance.

Key Support & Resistance Levels

R: 2520, 2600

S: 2394, 2136

Chris Capre’s current live open price action & ichimoku trades: USDMXN, EURRUB, EURMXN, BIG, SIG

New to Forex? Then check out my FREE Learn Forex Trading Course with videos, quizzes and downloadable resources

Top Trade Review: Watch this live trade review of my student banking +115 pips of PROFIT & +11R on the USDJPY

Bond Trade Idea: GHY – Good Yield, Waiting for Pullback (daily chart)

Price Action Context

The GHY (PGIM High Yield Fund) has been incredibly bullish since the start of 2019 with very few pullbacks and a recent breakout setup.

Currently the fund is approaching a major resistance zone between 15.20 – 15.50.

I’m looking to get long on a pullback to the 14.75 area for a long term yield/value play.

Trending Analysis

ST & MT bullish, LT needs to clear mid 15’s.

Key Support & Resistance Levels

R: 15.20, 15.50

S: 14.75, 14.25

Stay tuned to the member market commentary for updates.

Chris Capre’s current live open price action & ichimoku trades: CORN, USDMXN, EURRUB, EURMXN, BIG

New to Forex? Then check out my FREE Learn Forex Trading Course with videos, quizzes and downloadable resources

Top Trade Review: Watch this live trade review of my student banking +115 pips of PROFIT & +11R on the USDJPY

Forex Trade Idea: GBPCHF – Watching Major Support Zone For Buy Setup (daily chart)

Price Action Context

Gaining heavily to end last year and heading into the UK election, the GBP pairs have sold off from the Dec 19′ highs and are starting to offer some potential value plays.

The GBPCHF forex pair is only a couple handles away from a major support zone between 1.2303 and 1.2169 which I’m expecting some longs to be parked and shorts to take some profits.

gbpchf forex trade idea 2ndskiesforex

Trending Analysis

ST bearish but MT neutral – bullish while above the support zone on a weekly closing basis.

Key Support & Resistance Levels

R: 1.28, 1.30

S: 1.2303, 1.2169

Stay tuned to our members market commentary for updates

Chris Capre’s current live open price action & ichimoku trades: GBPUSD, SUI20, CORN, USDMXN, CHRW

New to Forex? Then check out my FREE Learn Forex Trading Course with videos, quizzes and downloadable resources

How do you cut losses short and let winners run? Watch my latest video where I share the first method for doing this.

Forex Trade Idea: EURGBP – Approaching Structural Support (weekly chart)

Price Action Context

For the last 3 months, the EURGBP price action has been impulsive, selling off from the 93 handle down to mid 85’s.

The key is to take a step back and look at the larger time frames to see the overall structure the pair has been in for the last 3 years.

We are approaching a 3 year support zone that has not seen a weekly close below it since July 2016, hence there is likely some bulls looking to get long soon while some bears will potentially be taking profit on their shorts soon.

eurgbp forex pair trade setup 2ndskiesforex

Trending Analysis

ST bearish but LT neutral to bullish while inside this large corrective structure. Bulls should watch for trade setups near the upcoming support area.

Key Support & Resistance Levels

R: 9240, 9315

S: 8500, 8336

Stay tuned to the members market commentary for updates.

******

Stock Trade Idea: Tesla (TSLA) – Looking to Short Into Major Resistance (weekly chart)

Price Action Context

In our market commentary two weeks ago, we suggested shorting Tesla ($TSLA) into the major resistance zone and all time highs. That is exactly what has happened upon the first rejection of this resistance zone but we suspect there might be another chance to short.

tesla stock trade idea 2ndskies

Trending Analysis

ST bullish, MT Neutral while below this major resistance zone so look for potential trade setups to get short into this resistance area.

Key Support & Resistance Levels

R: 357,  385

S: 258, 185

******

Index Trade Setup: SUI20 Long Breakout Setup In Profit, Potential New Setups (4hr chart)

Price Action Context

Last week in our market commentary, we talked about getting long on the SUI20 index looking for a breakout pullback setup once it cleared 10337.

The index did just that and has climbed higher forming a new all time high in the process.

sui20 trade setup 2ndskies

Trending Analysis

ST and MT bullish while above 10192 on a weekly closing basis. Looking to add longs on a pullback towards 10300.

Key Support & Resistance Levels

R: 10410, 10500

S: 10323, 10192

******

Chris Capre’s current live open price action & ichimoku trades: AUDNZD, CORN, WTI, USDMXN, CHRW

New to Forex? Then check out my FREE Learn Forex Trading Course with videos, quizzes and downloadable resources

Ever thought about a funded trading program? In our latest video, we review many funded trading programs with many not making a passing grade. 

UBER – New Taxes + Bearish Impulsive Price Action = Wanting to Sell (4hr chart)

Price Action Context

Back in our mid-October stock market commentary, we recommended selling UBER on a pullback towards resistance. While the stock managed a solid pullback, it failed to make any significant gains and has sold off heavily in the last few days, making a new low for the stock.

With New Jersey finding the company liable for taxes unpaid, and California changing legislation which will increase their costs by up to 20%, we suspect not many investors will be buyers in the short and medium term, thus expecting downward pressure on the stock.

uber bearish impulsive technical analysis 2ndskiesforex

Trending Analysis

ST & MT bearish while below 36 on a weekly closing basis. Traders not already short can watch the ST corrective structure for potential trading opportunities.

Key Support & Resistance Levels

R: 33.75, 36

S: 25.80, 20

Stay tuned to the member market commentary for updates.