Chris Capre’s live open price action and ichimoku trades: EURUSD, GBPUSD, AUDJPY, EURCZK, CAC40, VIX

New to Forex? Then check out my FREE Learn Forex Trading Course with videos, quizzes and downloadable resources

What is our preferred web based trading platform? Check out our latest platform review on the xStation 5.

NZDJPY – Pulling Back Towards Key Resistance (Daily chart)

Price Action Context

On the 13th of May, NZDJPY cleared a LT key support zone followed by a 2-3 week correction before selling picked up again. After putting in a ST bottom + reversal around 70.70, price is now closing in on the broken LT support, now acting as resistance. If bears can defend this resistance zone successfully, a bearish continuation towards the major support around 69.80, dating back all the way to 2009, is likely IMO.

nzdjpy-forex-trade-signal-2ndskiesforex

Trending Analysis

Bearish LT bias and sellers can look for potential trading locations around the key resistance.

Key Support & Resistance Zones

R: 72.25 – 72.85
S: 68.25 – 69.80

Chris Capre’s live open price action and ichimoku trades: EURUSD, GBPUSD, AUDJPY, EURJPY, EURCZK, EU50

New to Forex? Then check out my FREE Learn Forex Trading Course with videos, quizzes and downloadable resources

What is our preferred web based trading platform? Check out our latest platform review on the xStation 5.

EURJPY – Strong Weekly Close Below LT Key Support, Now Resistance (Weekly chart)

Price Action Context

The potential strong weekly close below the LT key resistance zone we hinted about in our mid-week commentary manifested and we can consider this zone fully cleared at this point.

eurjpy-forex-trade-setup-2ndskies

Trending Analysis

LT bias is bearish and bears can look for potential shorting opportunities on pullbacks towards the weekly zone, alternatively look for potential RRL plays on the H4 charts where currently a MT CVT is in play.

Key Support & Resistance Zones

R: 122.50 – 124.00
S: 118.60 – 117.70

Stay up to date with our members daily trade ideas for ongoing commentary.

******

EURGBP – Counter-Trend False Break @ Top of SCS (1h chart)

Price Action Context

As already mentioned in our daily trade ideas on Thursday, EURGBP is trading within a SCS on top of a bull trend. Price is extended from its mean on the HTF, suggesting a ST exhaustion and towards the end of past week, bulls failed to push price further north, printing a counter-trend false break setup at the top of the SCS.

eurgbp-false-break-setup-2ndskiesforex

Trending Analysis

The false break at the top of the SCS opens up for a likely move back towards the support of the corrective structure which can offer potential buying opportunities to bulls. Should the SCS support fail to hold, a move down towards the LT support we’ve mentioned in earlier commentaries is likely IMO, which can offer further trading opportunities to bulls.

Key Support & Resistance Zones

R: 0.8835 – 0.8850
S: 0.8780 – 0.8800

******

Hang Seng 50 – Bearish CVT Still Alive (1h chart)

Price Action Context

The ST bearish CVT is still alive and has offered multiple potential RRL-plays since we we mentioned it in our market commentary on the 19th of May. Congratulations to those of you who were able to take advantage and profit from these ST trading opportunities. The trend seems to be slowing down slightly as the bearish impulsive moves are getting weaker, but as long as the price action does not break back impulsively above the last broken support, the trend is in play.

hang-seng-index-trading-signals-2ndskiesforex

Trending Analysis

HTF is non-volatile + MT & ST bias are bearish and bears can look for potential shorting opportunities on weak pullbacks towards the last broken ST support, now resistance.

Key Support & Resistance Zones

R: 27 090 – 27 200
S: 26 500 – 26 750

Chris Capre’s live open price action and ichimoku trades: EURUSD, GBPUSD, AUDJPY, EURJPY, EURCZK, EU50

New to Forex? Then check out my FREE Learn Forex Trading Course with videos, quizzes and downloadable resources

Forex Trading Q&A: How We Teach Price Action Skills & Why You Need Patience {New Video}

EURJPY – Breaking Below LT Key Support Zone (Weekly chart)

Price Action Context

With almost no signs of bullish order flow over the last few weeks, price has slowly been chewing its way through the LT key support zone we’ve mentioned in earlier commentaries, and this week we’re seeing the first solid attempt by bears to fully clear this support zone.

eurjpy-forex-trade-setup-2ndskies

Trending Analysis

A strong weekly close below this support zone would open up for a potential bearish continuation towards 1.1860, whilst a bullish impulsive move back above the support zone would render this a false break and put 1.27 back into focus.

Key Support & Resistance Zones

R: 122.50 – 124.00
S: 118.60 – 117.70

Chris Capre’s live open price action and ichimoku trades: EURUSD, GBPUSD, AUDJPY, EURJPY, EURCZK, EU50

New to Forex? Then check out my FREE Learn Forex Trading Course with videos, quizzes and downloadable resources

Forex Trading Q&A: How We Teach Price Action Skills & Why You Need Patience {New Video}

EURGBP – ST Corrective Structure After Bullish Run (1hr chart)

Price Action Context

After an impressive bullish run with the GBP falling heavy impacted by Brexit uncertainties and PM May resigning, the EURGBP cross forex pair has gained heavily adding over 225 pips since the last two weeks.

eurgbp-forex-pair-trade-setup-2ndskiesforex

Trending Analysis

ST we remain bullish while the ST corrective structure is in play and are looking to trade with trend.

Support & Resistance Levels

R: 8850, 8915

S: 8780, 8700

Chris Capre’s live open price action and ichimoku trades: EURUSD, GBPUSD, AUDJPY, EU50, SUI 20, INR.FR

New to Forex: Then check out my FREE Learn Forex Trading Course with videos, quizzes and downloadable resources

Looking to learn more about day trading: Read my latest article Forex Day Trading Strategies, Rules & Tactics

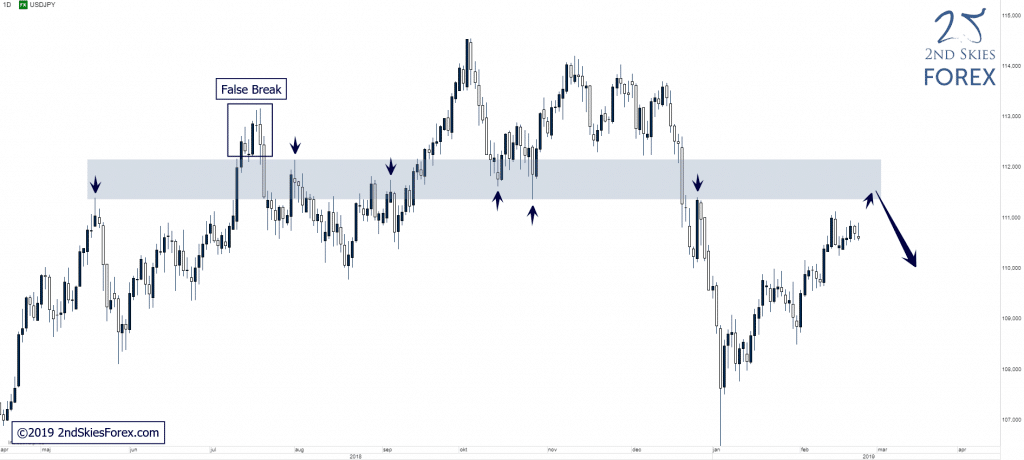
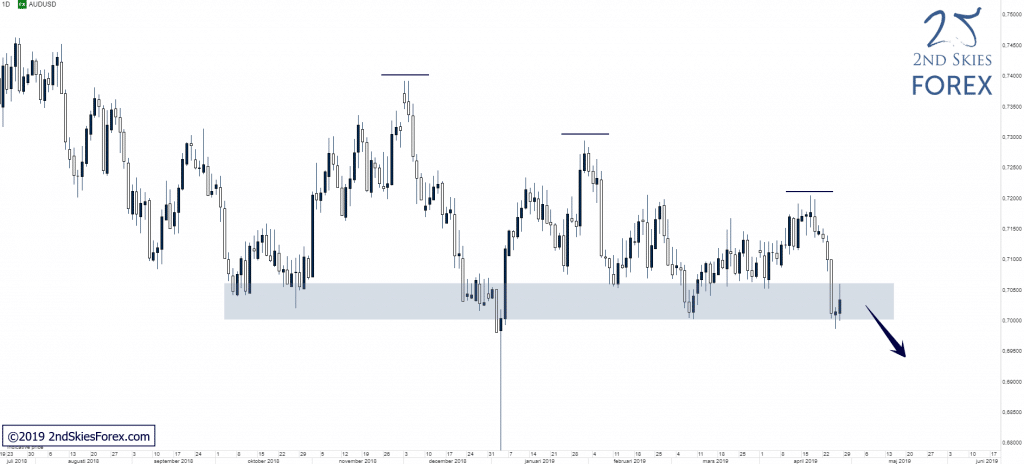
AUDUSD – Bears Trying To Clear Key Support (Daily chart)

Price Action Context

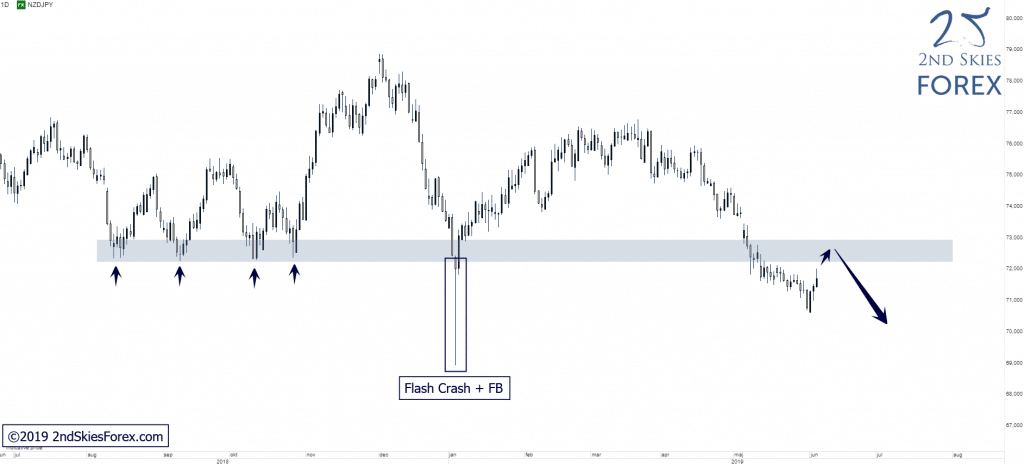
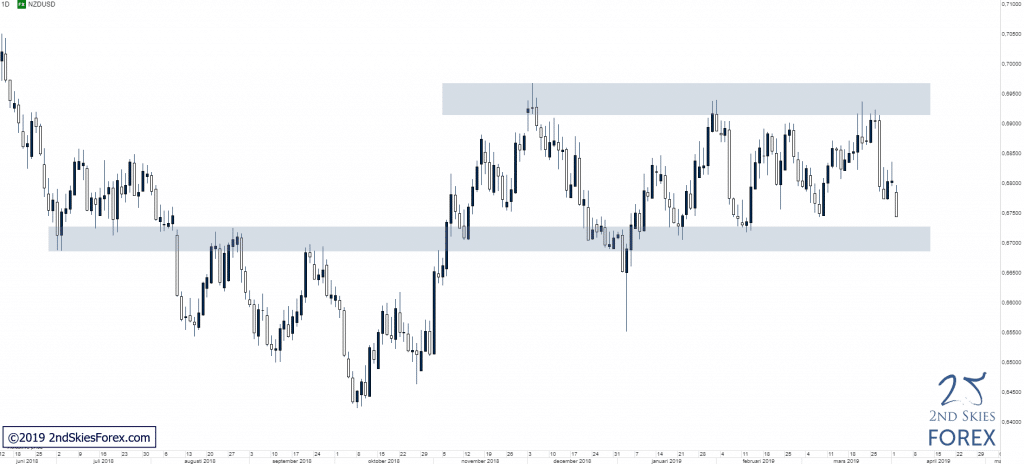
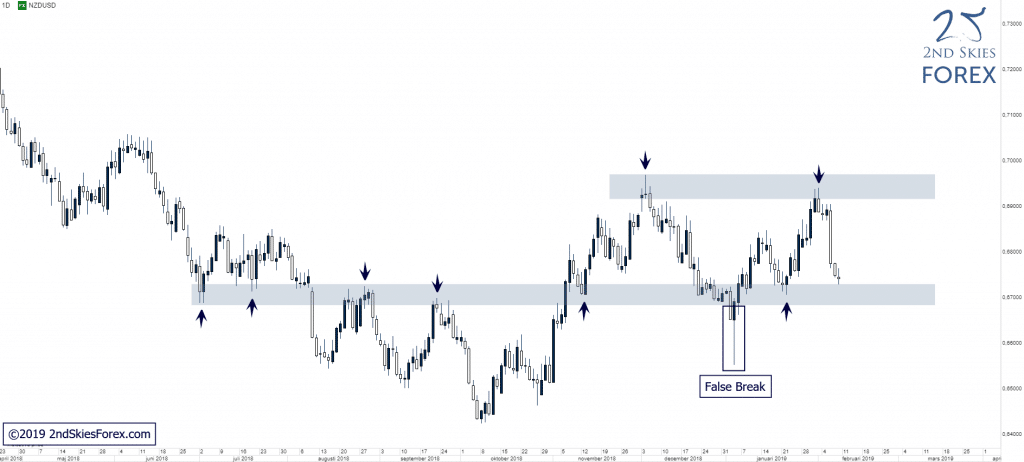
Trading inside of a LT corrective structure preceded by a bear trend that started in January last year @ around 0.81. Since the flash crash and false break in January this year, the pair has been ranging, creating new lower lows, hinting about decreasing bullish order flow.

audusd-forex-trade-signal-2ndskiesforex

Trending Analysis

Bearish bias while below 0.7400. A strong break and close below the key support would open up for a likely continuation towards the multi-year support starting to come in at 0.6940, which in turn can offer potential trading opportunities to bears. Should bulls on the other hand be able to defend the support, a move back up towards 0.72 is likely IMO.

Key Support & Resistance Zones

R: 0.7300 – 0.7400
S: 0.7000 – 0.7060

Stay tuned to our members market commentary & trade ideas for updates.

******

BTCUSD – Closing In On Major Resistance (Weekly chart)

Price Action Context

Bitcoin broke out to the upside of the tight consolidation we mentioned in late March followed by very strong buying and is now approaching a major key resistance zone.
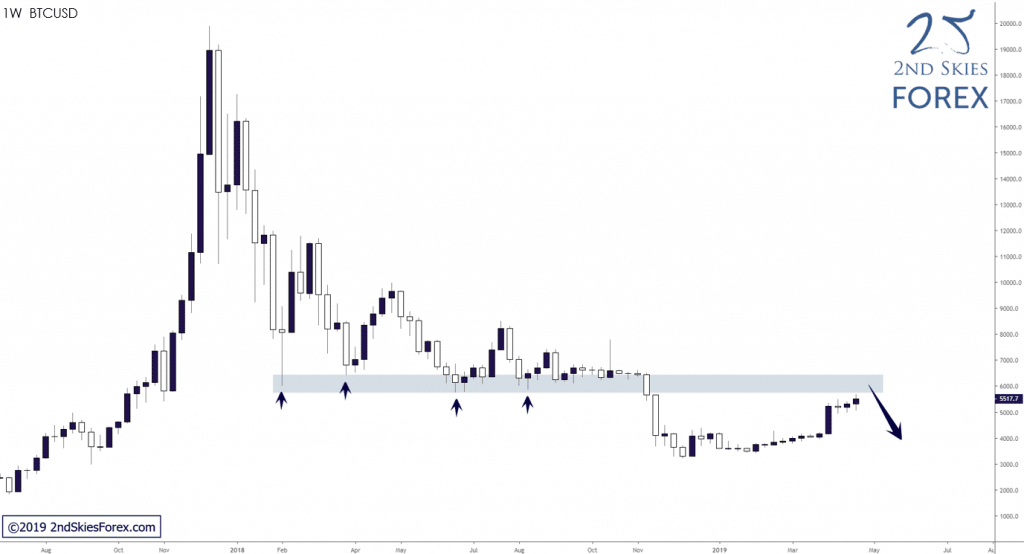
bitcoin-trading-signal-2ndskiesforex

Trending Analysis

LT bias remains unchanged bearish while trading below 6 400 and bears looking for potential shorting opportunities can look for possible locations around the key resistance zone. A break and close above this key resistance would put 7 350 and 8 400 back on the radar.

Key Support & Resistance Zones

R: 5 750 – 6 400
S: 3 000 – 3 500

******

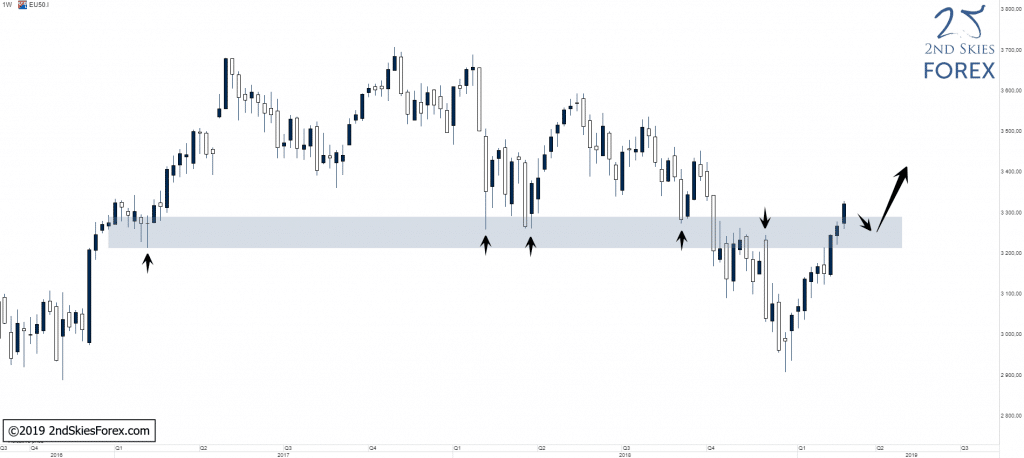
SUI20 – Broken Above Major Multi-Year Resistance, Potential False Break (Monthly chart)

Price Action Context

The bullish order flow was simply too much for bears to counter, and with almost no reaction to the multi-year resistance this time around, bulls have now successfully pushed price above the resistance, creating a new ATH in the process.
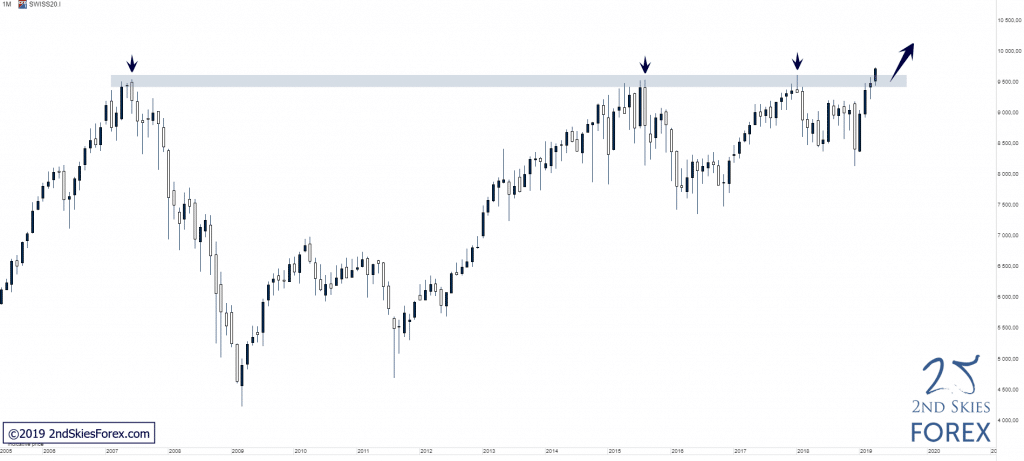
sui20-index-trade-signal-2ndskiesforex

Trending Analysis

LT bias is bullish and the index is now in uncharted territory, with 10 000 being the next area of interest to look out for. If bulls are able to hold price above this resistance, weak pullbacks into the broken resistance, which now should act as support, can offer possible buying locations. Should we on the other hand see a quick return back below the resistance, we’d likely be looking at a false break setup which initially would put 8 400 back on the radar.

Key Support & Resistance Zones

R: n/a
S: 9 400 – 9 630

Chris Capre’s current open price action and ichimoku trades: EURUSD, GBPUSD, EURCHF, EU50, INR.FR, BIR, TLS

NOTE: Want to know how to find the strongest support and resistance levels in forex? Click here to learn more.

NZDUSD – Closing In On A LT Key Support Level (daily chart)
For pretty much all of 2019, the NZDUSD has been stuck in a ~250 pip corrective structure between 6700 and 6950 with several touches on both sides. Until this corrective structure breaks, or either of the key support/resistance zones, with a weekly close above/below them, I’m going to trade both sides of the market while targeting the other end.

nzdusd-forex-trade-setup-key-support-2ndskiesforex

Trending Analysis:

ST corrective so trading both sides. MT mixed and whichever side breaks first will likely indicate the next major direction.

Key Support/Resistance Levels:

R: 6900-6975
S: 6675-6725

Want to get more trade ideas like this? Check out becoming a member whereby you’d get access to trade ideas and market analysis 4x per week.

Chris Capre’s current live price action and ichimoku trades: EURUSD, GBPUSD, USDMXN, USDJPY, EU 50, BIR, TLS

NOTE: Check out my top trade ideas for 2019.

EURUSD – Pulling Back Towards Key Resistance (Daily chart)

Price Action Context

After a failed attempt to fully clear the LT support between 1.1270-1.1300, bulls managed to re-gain some control, but the weak and very volatile bullish move from the support isn’t very convincing, suggest a more balanced order flow and continued bearish presence.

eurusd-price-action-forex-2ndskiesforex

Trending Analysis

LT bias remains bearish while below 1.1515 and a potential move back up to the key resistance zone can offer possible trading locations to bears.

Key Support & Resistance Zones

R: 1.1450 – 1.1515
S: 1.1220 – 1.1275

Stay tuned to the members daily trade ideas for updates.

******

EURO STOXX 50 – Back Above LT Key Support, Bullish Bias (Weekly chart)

Price Action Context

Like many other indices, the Euro Stoxx 50 has now broken back above a key resistance level, which now should act as support.

euro-stoxx-50-trade-setup-2ndskiesforex

Trending Analysis

LT bias changed back to bullish and weak pullbacks into the broken resistance, now support, will likely be of interest to bulls.

Key Support & Resistance Zones

R: 3660 – 3710
S: 3215 – 3280

******

WTI – Holding Above LT Key S/R Zone (Weekly chart)

Price Action Context

WTI bounced heavily from the multi-year support and has now broken back above a LT key S/R zone, initially opening up for a potential continuation towards 59.00.

wti-oil-trade-ideas-2ndskiesforex

Trending Analysis

LT bias bullish with the LT key S/R zone offering potential buying opportunities.

Key Support & Resistance Zones

R: 64.25 – 66.70
S: 53.20 – 55.20

Chris Capre’s current open price action and ichimoku trades: EURUSD, GBPUSD, USDMXN, USDJPY, BIR, TLS

ATTN: Got a full time job and can’t day trade? Make sure to read my article about trading daily and 4 hour price action.

USDJPY – Approaching Key Resistance (Daily chart)

Price Action Context

After multiple bullish attempts to clear the LT resistance during Q4 last year, bears ultimately got the upper hand and pushed price all the way down to ~105.00 within 3 weeks, ending with a massive flash crash. Since then, price has recovered from the sell off and is now approaching a key resistance zone.

forex-usdjpy-technical-analysis-2ndskiesforex

Trending Analysis

MT bias is bearish whilst below 108.30 and ST/MT bears might find the current pullback to the key resistance to be of interesting in terms of possible trading locations.

Key Support & Resistance Zones

R: 111.40 – 112.15
S: 107.35 – 108.30

Stay tuned to the members daily trade ideas for updates.

******

XPTUSD – Key Resistance Broken (4h chart)

Price Action Context

Since early December, Platinum has been ranging and building a MT corrective structure, a structure that now has been broken to the upside.

xptusd-technical-analysis-2ndskiesforex

Trending Analysis

If the broken MT resistance now holds as support, a move back up towards the LT resistance, starting to come in around $865 is likely IMO.

Key Support & Resistance Zones

R: 865 – 890
S: 823 – 832

******

WTI – Broken Back Above LT Key S/R Zone (Weekly chart)

Price Action Context

WTI bounced heavily from the multi-year support and has now broken back above a LT key S/R zone, initially opening up for a potential continuation towards 59.00.

wti-oil-technical-analysis-2ndskiesforex

Trending Analysis

LT bias changed to bullish with the LT key S/R zone offering potential trading locations to bulls.

Key Support & Resistance Zones

R: 64.25 – 66.70
S: 53.20 – 55.20

Chris Capre’s current open price action and ichimoku trades: EURUSD, GBPUSD, USDMXN, USDJPY, BIR, TLS

NOTE: I’ve never met a struggling trader that hasn’t skipped steps. Don’t make that mistake. Read my article The 4 Stages of Becoming A Millionaire Trader to avoid this.

NZDUSD – Rejected At Resistance, Now Testing Support (Daily chart)

Price Action Context

For now, despite 2 solid attempts, bulls have not been able to successfully clear 0.69 which is the top of a multi-year S/R zone. Instead, bears again stepped in, heavily rejecting the bullish attack and price is now back testing the LT support a second time after the false break in early January.

forex-nzdusd-key-support-level-2ndskiesforex

Trending Analysis

If this LT support holds, a move back up towards 0.69 is likely whilst a break below would open up for a possible bearish continuation towards 0.65.

Key Support & Resistance Zones

R: 0.6920 – 0.6970
S: 0.6680 – 0.6730

Stay tuned to the members daily trade ideas for updates.

******

EURGBP – LT Range Still In Play But Expanding (Daily chart)

Price Action Context

Despite the heavy bearish assault on the LT support, bulls stepped in at the lows from April last year and were able to defend the support zone for now. With LT volatility increasing, it seems the range is expanding both to the up- and downside which made us adjust our S/R zones slightly.

forex-eurgbp-trade-setups-2ndskiesforex

Trending Analysis

Non-directional LT price action since October 2017. Neutral bias while trading within this range and traders can look for potential trading opportunities at the extremes (top/bottom) of this range until it breaks.

Key Support & Resistance Zones

R: 0.9000 – 0.9100
S: 0.8620 – 0.8700

******

Hang Seng 50 – Pullback To LT Key S/R Zone (Weekly chart)

Price Action Context

LT exhaustion into 33 350 followed by impulsive selling and corrective price action. The corrective structure got broken to the downside in the end of June last year, followed by continued selling towards 25 000. After putting in a rough double bottom, buyers came back and have now pushed price all the way back up to the LT S/R zone, a zone that coincides with a KSP from Q2 2015.

hang-seng-50-trade-ideas-2ndskiesforex

Trending Analysis

LT bias bearish and sellers can look for potential trading opportunities around the LT S/R zone.

Key Support & Resistance Zones

R: 28 200 – 29 350
S: 24 400 – 25 400

Chris Capre’s current open price action and ichimoku trades: EURUSD, GBPUSD, USDMXN, USDJPY, BIR, TL

NOTE: Every trader has to go through stages to make money trading. Which stage are you at? To find out, read my article The 4 Stages of A Millionaire Trader.

GBPUSD – Potential ST Exhaustion Into Key Resistance (Daily chart)

Price Action Context

In December last year, sellers initially were able to clear the LT key support, but the bearish continuation failed and buyers pushed price back above the key support, which since has been followed with very strong buying, now starting to look like a ST parabolic move and exhaustion price action into the key resistance ahead.

forex-gbpusd-trade-setups-2ndskiesforex

Trending Analysis

Bearish while below 1.3370 and the key resistance can potentially offer shorting opportunities to bears.

Key Support & Resistance Zones

R: 1.3230 – 1.3370
S: 1.2600 – 1.2730

Stay tuned to the daily member trade ideas for updates.

******

ASX200 – False Break @ Weekly Support (Weekly chart)

Price Action Context

The break below the weekly key support level ended up being a false break setup and after breaking and closing back above the key support, price has continued north and is most likely headed for the next key resistance.

asx-200-technical-analysis-2ndskiesforex

Trending Analysis

LT bias changed to bullish after the false break and bulls can look for potential bullish plays on weakness into the key support.

Key Support & Resistance Zones

R: 6 110 – 6 160
S: 5580 – 5700

******

XAUEUR – Strong Close Above LT Resistance, Potential False Break (Weekly chart)

Price Action Context

Precious metals were bought up heavily during Friday, which was the last bullish push XAUEUR needed to clear the next LT key resistance level in line. If this broken resistance holds as support, a move up towards 1160-1180 is likely IMO.

gold-vs-eur-forex-trade-setups-2ndskiesforex

Trending Analysis

LT bias bullish and weak pullbacks into the broken LT resistance, which now should act as support, can present potential bullish trading opportunities. A break and close back below the zone would render this a false break and put 1060 back into perspective.

Key Support & Resistance Zones

R: 1 160 – 1 180
S: 1 116 – 1 134