Price Action, Breakouts & Order Flow
Today I am writing a potent article about pre-qualifying forex breakouts, particularly understanding them from a price action & order flow perspective. When you pre-qualify a breakout, you put yourself in a position to identify it as a high or low probability breakout. To do this however, you have to understand what makes a successful forex breakout trade both from a price action and order flow perspective.
In my prior article 3 Keys for Identifying Breakouts, I talk about 3 such parameters for pre-qualifying forex breakouts. They are;
1) Well Defined Support/Resistance Level
2) Pre-Breakout Squeeze/Pressure/Tension
3) 20ema Carry
When you can identify these prior to a potential breakout, you highly increase the probabilities of trading a successful breakout. But let’s dig into this a little deeper as to why from a price action and order flow perspective.
Order Flow Behind Breakouts
From an order flow perspective, breakouts generally start with an initial balance between buyers and sellers. This usually results in a range of sorts, with two clearly defined support and resistance levels. When you get several touches on these levels, this clearly communicates where both sides of the players are parked (and likely their stops as well). The more touches on these barriers, the more players are brought in.
Those who are bullish will get in on the bounces off support, while bearish players on rejections off resistance.
However as time goes on, tension starts to build between the two camps as someone will eventually want to take control. In almost all cases, the side with the largest number of orders and money behind their camp, will win this tug of war.
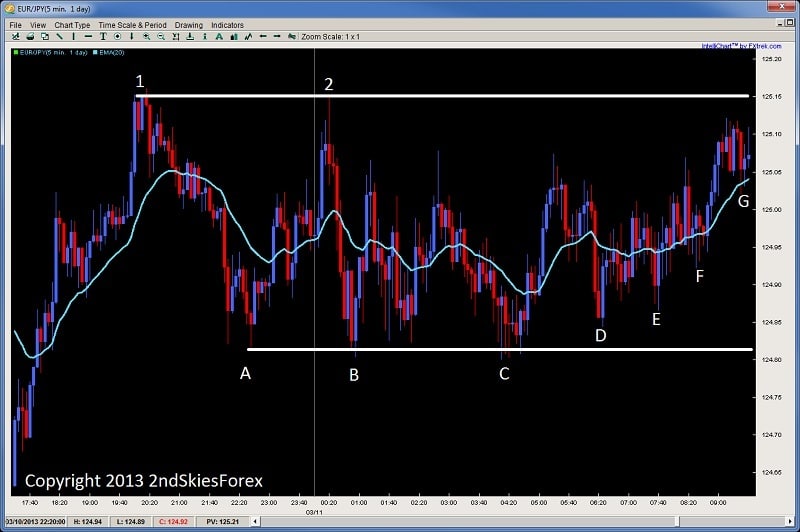
This usually manifests in a higher low (HL) or lower high (LH) being formed inside the range, and more aggressive pushes towards the other line in the sand, while less or no touches on the other side, almost as if the sellers or buyers could not reach the other support or resistance level. It usually looks something like the chart below.
Looking at the chart above, you’ll see a clearly defined support and resistance level with a minimum of two touches on each side. This tips us off to where the bears and bulls are parked on the chart with stops just above/below the levels.
Now you will notice each rejection at A & B minimally went up to 125.05 before coming back down and touching the same support level at 124.80.
C pushes price back up to 125.05, but this time the rejection fails to reach 124.80, and can only make it to 124.85. From an order flow perspective, the buyers are starting to get more aggressive and confident their level will hold, so they are buying up higher (at a more expensive price).
The next pullback at E is also higher, so we are seeing a continual change of hands by the bulls buying higher from support (and their defenses at 124.80).
Now notice every push up from B, C, D, and E only makes it to a maximum price of 125.05. But with F, it goes to 125.10. There were probably some intraday bears shorting at 125.05 (now stopped out), while the rest were still short at 125.15.
Now that price is pushing up towards the resistance without ever touching the support, this communicates the bulls are taking control of the price action with more orders and money, and will likely continue to squeeze the bears out.
This price action squeeze takes out smart sellers early as they recognize they are about to get stopped out if they stay in. The slower players stay in until they are at breakeven, while the slowest and most stubborn bears stay in till they are stopped out.
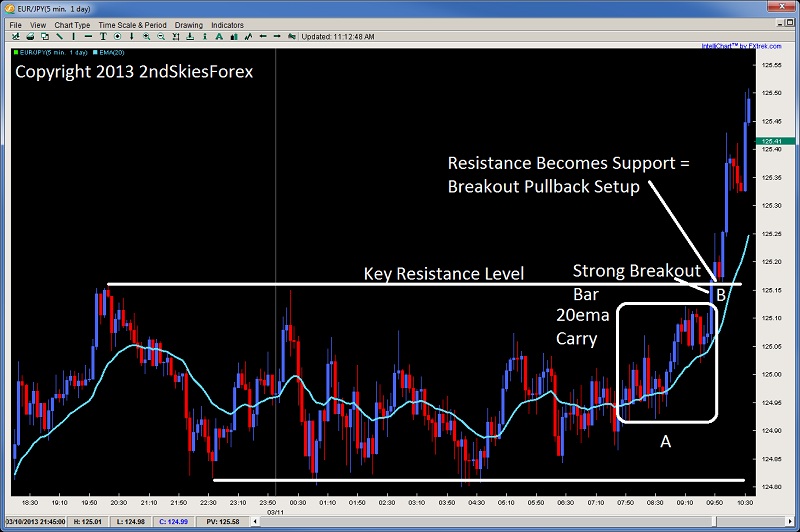
Using the chart above, we see the final stage of the breakout which is the 20ema carry in Box A. This “20ema carry” is a common price action formation prior to a good breakout, as it shows;
a) the mathematical representation of price gaining
and
b) gives bulls who haven’t entered a chance to get in prior to the breakout
This is followed by a strong breakout bar at B. This large bar should be curious, for why would bulls buy up so strongly heading into a resistance level if they were worried about sellers parked there. Usually, institutional traders can smell an upcoming breakout like this, so will push really hard to take out any stops as they go after the barrier.
A “strong breakout bar” is usually a really good sign the breakout will continue as it means stops were tripped above the resistance level, and price jumped aggressively in one bar. More ideal is if it has a good “clearing distance“, for if it does, then it increases the chances all the stops were tripped by going further away from the resistance level where most of the stops were near.
Tripping The Stops
It is this latter part – the stops getting tripped, which helps fuel the breakout even further, because those bears who were short now have to buy back, and this buying back to exit out helps further fuel the upside breakout. This is why if you ever watch the prices on your actual platform during a breakout like this, it generally reads (using 4 decimal places);
1.2999
1.3000
1.3001
1.3002
1.3003 (stops tripped)
1.3006!
You can always tell where the stops were parked and tripped, because price then jumps a few pips in a shot. The reason for this is – there were no sellers between 1.3003 and 1.3006, meaning the brokers could not print a price there since there were not enough orders there to hold that price. The stops being tripped at 1.3003 were sellers who now had to buy back, and when they did, they helped to push the next market price up 3 pips in a single tick or print.
When you see this, it usually means the breakout will likely continue – as long as you have done your pre-qualifying ahead of time.
One Final Note
Like all things, we have to pre-qualify a forex breakout using several price action characteristics ahead of time. The ones listed above are just a few of the ones we use in my Course, and there are several others which will clue you off and enhance the probability of the breakout being successful or not.
When you can pre-qualify them correctly, you will find breakouts quite easy to trade and accuracy levels around 60-70% as this is what my more profitable students are doing consistently just trading breakouts.
But, you have to pre-qualify them, like any price action setup. We never just trade them in isolation, as we are not pattern traders. We are price action traders, and we always trade setups & price action in context.
Any good system can perform badly without the proper context. Pin bars can be a highly effective system, if traded in context. But without understanding the type of trend, or volatility levels, you will likely lose money trading pin bars in isolation, even if you trade them at key chart levels.
Thus, we are never just trading patterns on a chart. We are always trading them in context, and this is exactly the same for breakouts, so always pre-qualify them ahead of time.
Look for the three characteristics above, try to trade them with trend more often then counter-trend, and you’ll find they can offer highly profitable trades, with some of the better reward to risk ratios out there, such as 3, 4, 5, or many reaching 7 or 9:1 reward to risk ratios.


A potent article indeed. One question though. When you say in the article:
From an order flow perspective, the buyers are starting to get more aggressive and confident their level will hold, so they are buying up higher (at a cheaper price).
Shouldn’t that read at a worse/more expensive price?
Oh thanks for pointing that out mate.
Will change it now, thanks for spotting it
Kind Regards,
Chris Capre
Eventually when I have the means, I will be investing in your course.
Superb article.
Thank you
nice
Glad you liked it Sobuj,
Kind Regards,
Chris Capre
Excellent Chris, as usual…
Glad you liked it Hugo.
Kind Regards,
Chris Capre
Chris,
Thank you very much! This has given me a better perspective about the way the market operates in the case of a ranging market preparing for a breakout. It always helps (gives more confidence in your trades) when one can understand why the price is acting the way it does.
Hello Ernest,
Am glad you liked the article as its a key perspective to understand the order flow behind a breakout.
Kind Regards,
Chris Capre
Hey Chris,
I was wondering what is for you a ” good clearing distance” ?
How far should it be beyond the key level?
Thanks a lot !
Greg
Hello Greggy,
There is no fixed rule for this as each pair has its volatility levels, which are different per pair and time frame.
Kind Regards,
Chris Capre
It will be difficult to decide the direction through the breakout.
Hello FB,
Not if you learn how to read the price action.
Kind Regards,
Chris Capre
I’m not sure I understand what you’re saying.
Can you clarify?
Nello Chris I want to tell that it seems the breakout bar andò the spike bar are very similari in lenght,.body and so on. Is this correct?
Hello fantastic Chris a small question; to see the right trend direction is correct to use the daily timeframe as general rule? Or also the monthly or weekly time frame? Thank you
Hello Fabrizio,
Trend is relative to time frame. A trend on one TF does not = a trend on another TF. There is no ‘right’ trend. There are simply time horizons you work with, and you have to find the time horizon you’re trading, and then the TF for that time horizon.
Hope this helps.