I want to share with you some results and tell me if you think these would be considered professional grade, or highly impressive to say the least;
110% gain for 2011
124 Trades, 74 winners, 50 Losses
59.67% Accuracy Rate
Largest Win: $14,360
Largest Loss: $8,180
Max Win = 43% larger than Max Loss
Max Consec. Wins: 16
Max Consec. Losses: 6
Max Consec. Win Streak 2.66x Larger Than Max. Consec. Loss Streak
Largest Trading Position: 1M
Overall, this could make the grade for a professional trader. In fact, I know many that did worse (a lot worse) then him and would be happy with his results.
The 4hr Charts
There has been a lot of talk and garbage being spoken about trading off the 4hr charts, how its trading as a hobby, how you’ll only be an amateur, how if you want to be a professional trader, you need to trade off the 1m, 5min, 15m, smaller time frames. Ridiculous, but we are going to demonstrate why.
I’ve been wanting to show people the power of trading the 4hr time frames for a while. Although I have many students doing it, nobody is solely trading off the 4hr. They usually add the daily, or 1hr and have a mix of time frames and systems. In comes Tony.
Do you remember Tony? I wrote about him in the Pyramid of Trading article whereby I talked about him back in early Oct. At that time he was up 76%, and ended the year up 110%. Meaning, he gained another 34% in the last three months – impressive to say the least.
Tony had one thing going for him which was the best edge one could have – discipline. Tony had very little experience, no business/finance degree, just a desire to learn, patience and discipline. He came to me in late 2009 wanting to take some private mentoring sessions.
I taught him less than a handful of systems which he learned well and practiced on in 2010. By the end of the year, he settled on his two favorites:
Price Action
& my Shadow System.
He learned his risk parameters, his style, how he wanted to trade, what was the best pair for him, then went for it. He settled on trading the AUDUSD only on the 4hr time frames using those two (Price Action & the Shadow System).
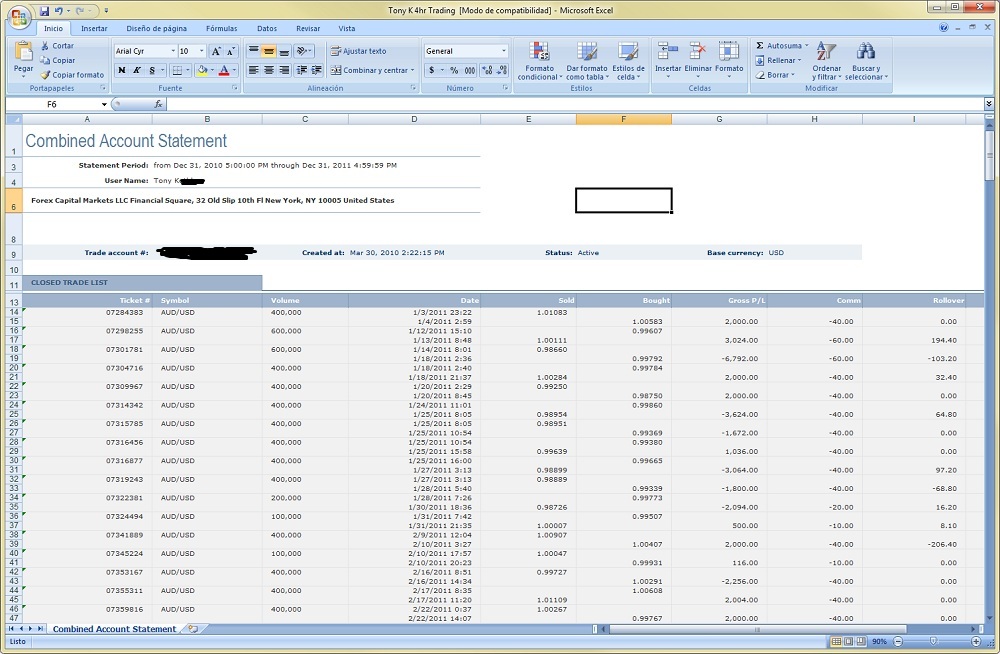
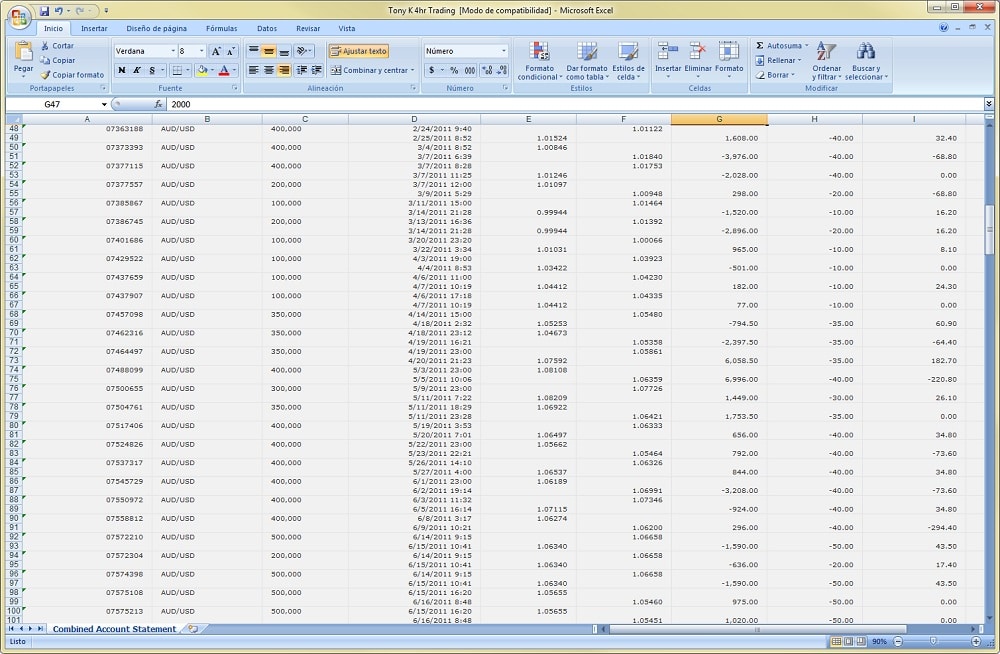
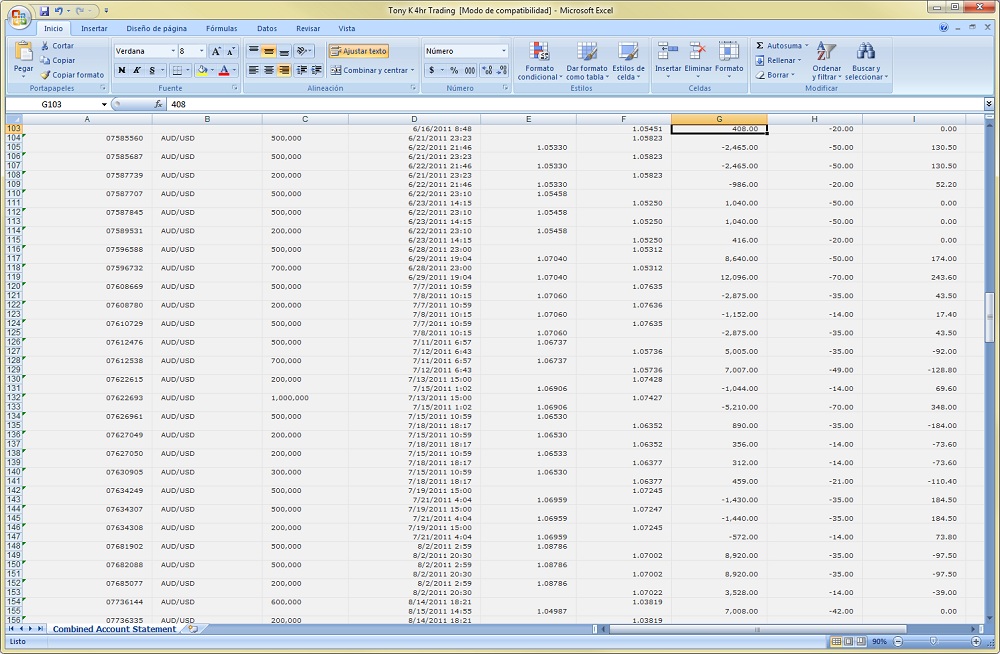
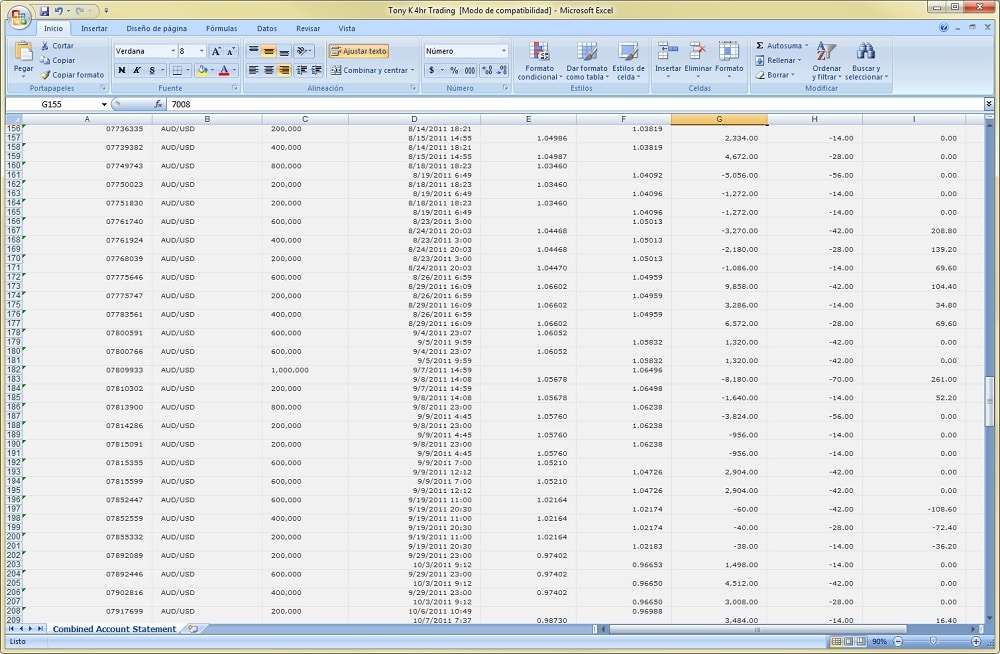
I am going to show you his entire trading report, which averages about 10-12 trades a month with the max being 16 and the least being about 8. You already have the stats above so lets show you the entire trade history for 2011. I have covered his personal details and acct number to protect his privacy, but all the trading is there which you can see below.
Screenshot 1
Screenshot 2
Screenshot 3
Screenshot 4
Screenshot 5
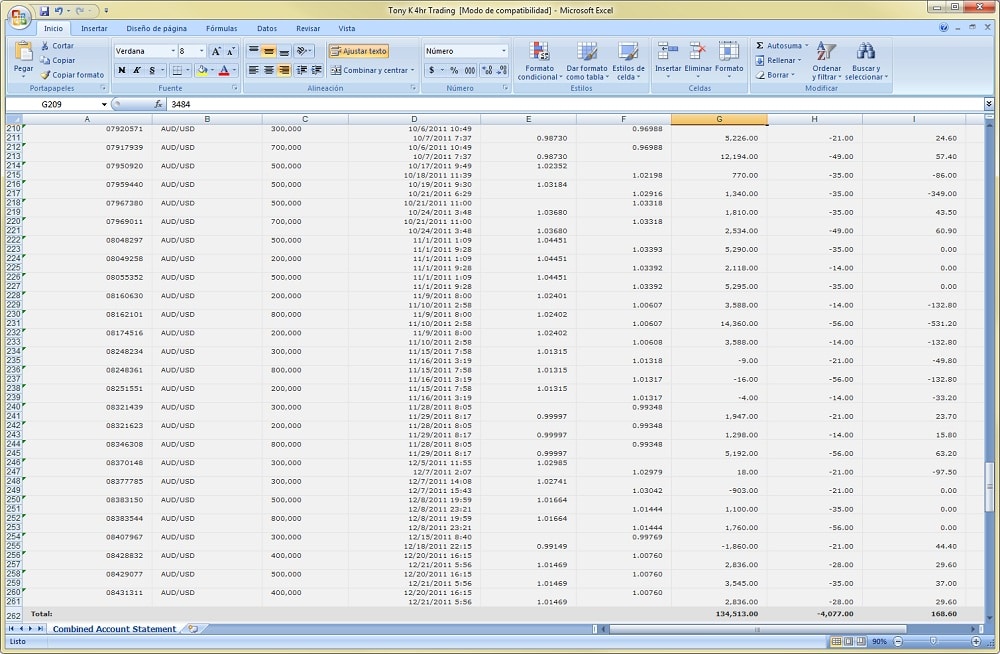
Screenshot 6
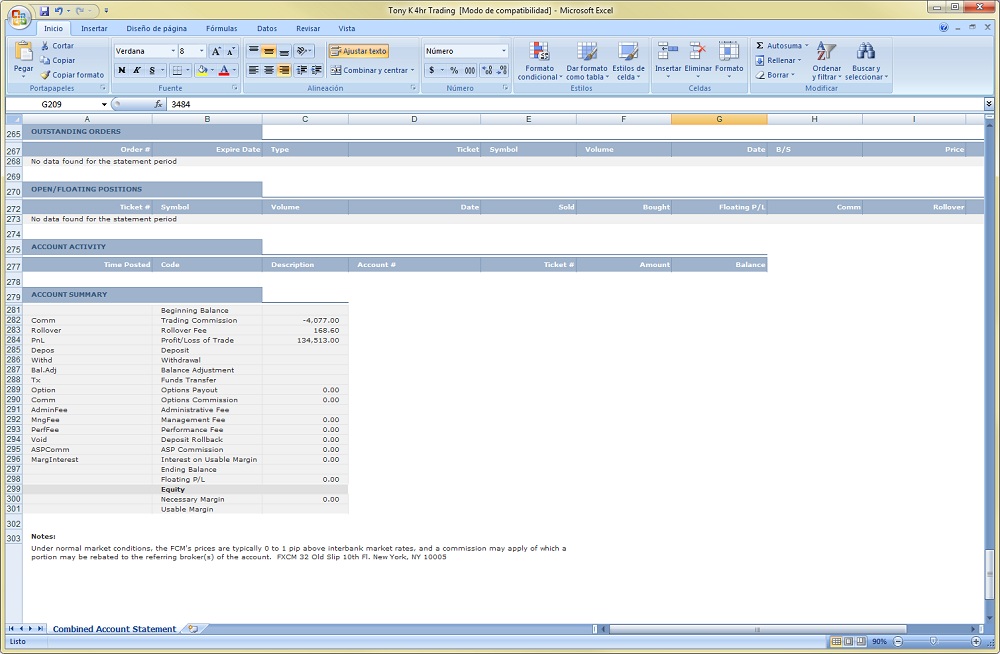
So there you have it, an entire year of trading. To recap his performance;
110% gain for 2011
124 Trades, 74 winners, 50 Losses
59.67% Accuracy Rate
Largest Win: $14,360
Largest Loss: $8,180
Max Win = 43% larger than Max Loss
Max Consec. Wins: 16
Max Consec. Losses: 6
Largest Trading Position: 1M
This should finally put to rest the ridiculous talk and idea you only have to trade one time frame or smaller time frames to be a professional or highly successful trader.
All of this is thanks to Tony for sharing his results with me. He traded only on the 4hr time frame for an entire year. A lot of his trades were done in a day, but many went a few days, with several going 4-6 days holding time. All he traded was Price Action and my Shadow System on one pair for an entire year. Disciplined, patient, and highly profitable.
How many educators show results from their students, especially of this caliber? I believe I am one of the few, and Tony will not be the last. Maybe the next person is you – hopefully it is.
To also separate myself and end the debate, at the end of this year, I’ll show you audited results from an account I opened up just to demonstrate I am not just a good teacher, but a good trader as well. I will publish the audited results from a professional accounting firm, on my site so you can all see I am the real deal.
I have no idea how i’ll end up for the year, but whatever it is, you will see it. Even though my fund has an 8+yr audited track record (which should be proof enough), this will settle it, as it will only be my trading, only me pushing buttons, not anyone from my trading team, or any account from my fund. Just my own individual account opened just for this. This should end the debate. Hopefully then I can stop answering questions about my legitimacy, focus on trading, and teaching people who are serious about learning to trade successfully.
There are 3 things I live and breathe every day and have been for over the last 10yrs;
Yoga
Meditation
Forex Trading
I make my living and have been for almost a decade from trading. I study it every day and every moment I can get a chance. The only thing that is right up there with the three things I listed above is Teaching People to Become Successful Traders. I’ve seen every kind of trader you can imagine (from time frame to profitability), and there is no one person who holds the monopoly on the truth of trading and the learning process.
And to the rest of you with open minds and a serious desire to learn, this demonstrates you can be a profitable and highly successful trader, regardless of your time frame, system or background. With the right effort, discipline, and patience, you can be a profitable and successful trader as well.
Ode to the 4hr Charts and profitable trading.
Kind Regards,
Chris Capre
2ndskiestrading.com
Twitter; 2ndSkiesForex
Tag Archive for: 4hr charts
The 4-Hour Chart
No, this is not a Timothy Ferriss promotion or new book, but an examination of the 4hr chart, along with the how and why I recommend using it for your price action trading.
If you are in the beginning or developmental stages for learning how to trade the forex market, I definitely recommend learning to read price action off the 1hr, 4hr an daily time frames. For our purposes, we will concentrate on the 4hr chart.
Some Advantages of the 4hr Time Frame?
Price Action is the result of order flow (the total summation of all buy and sell orders). It really matters not why people buy and sell, or if they are buying and selling, what matters is who has dominant control of the market, where is the market most likely to go, and how can we trade it.
With that being said, a few minutes of price action can more often than not, represent a false move, perhaps Toyota buying some USD with JPY, and very likely have any significant force behind it to drive the market, bring in other players, and be the start of a big move.
Think about it…how many 1min, 3min, 5min, 10min, 15min, or even 30mins of price action throughout the day will really be representative of a major move and driving force throughout the day?
Now, think about the 4hr chart. No matter how you slice it, 4hrs is half of a trading session (for the most part). For any trading session, a 4hr candle will represent a large sum of order flow, sentiment, continued or sustained buying/selling, etc. If a rejection happens on a 4hr chart, it likely represents a large rejection because to sustain that rejection, the market had to close the entire 4hr candle while maintaining the rejection till the end. If it rejects during the 4hr candle, but closes exactly where it rejected, then it wasn’t that important because it couldn’t sustain that rejection in time.
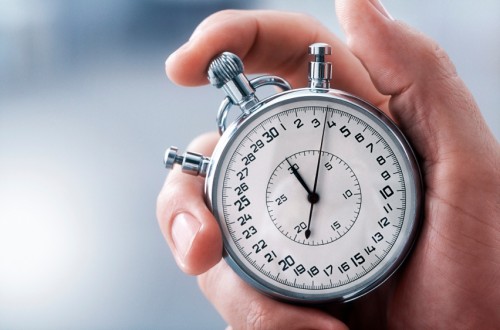
Time is a critical component when reading price action and representing order flow. In many cases, the longer price reacts/rejects off a key level, the longer it holds from that rejection, the stronger it can be. Of course the price action context leading up to it is key and informative, so make sure to understand this.
But if a key level can sustain the directional move for 4hrs as opposed to 5mins, then it had to do so through increased order flow and participation from the market. That communicates there were more players and more money behind this move.
But on a 5min candle, or even a 1min candle, this could be nothing and represent little/meaningless order flow with no real potency behind it. It could be the result of some minor profit taking which creates a negative feedback loop in terms of order flow and price action. But do this for 4hrs and sustain it into the close, and we are talking more participation, orders, money and participants.
For price to sustain a particular price action move for 4hrs means no matter how many players, sentiments, and ideas there were participating in the market, the dominant theme held for half the trading session and quite a long time. But on a one min time frame, a 5min, or even 30min time frame, these moves could be simple noise which can move the market up to 30pips without having any major force behind it. Think about how many 5min candles in between the NY close and Tokyo open and how much order flow will really be behind that? Think about how many 1min and 3min candles will be between the 3rd and 4th hours of the london session (where volatility and pip ranges generally decrease) and how they will represent less order flow and participation. Then you will see how ineffective these candles can be and how what your reading has very little meaning.
One and Two Bar Patterns
Continuing with that logic, for those who trade pure price action patterns, like an inside bar (which is a 2 bar pattern) shows up on a 1min, 3min, 5min or even 30min time frame, it is much more likely to be absolutely meaningless than an inside bar which shows up on a 4hr time frame.
Think about it, if price holds inside the previous price range on a 5min candle, that could mean almost anything and be the result of a laundry list of order flow environments and situations. 5mins of price going nowhere could mean anything and have very little direction on upcoming order flow.
But apply an inside bar on a 4hr time frame, and you are talking 4hrs of price action being held in a range for almost half an entire trading session. That means no matter how many players participated in the market, nobody was able to break the previous price range for an entire 4hrs which tells you a) price was pretty suppressed, b) very little directional control in the market, c) very little participation. That is much more communicative in terms of information than any passing 5mins.
The market could be in a dominant trend, but be simply pausing for 5mins because its coming to lunchtime, there were some short term counter-orders/forces in the market that will be quickly absorbed, a little profit taking (again, a negative feedback loop on price action and thus, not great for trading). Technically, for an inside bar pattern, you would be basing your decision on 8hrs of price action since an inside bar pattern is a 2bar pattern (thus 8hrs), so there is a lot more information in this then an inside bar pattern on a 5min time frame (10mins of price action).
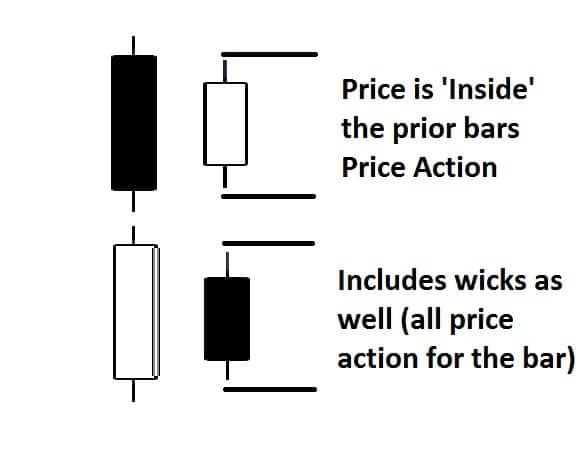
Furthermore, to get any real significant amount of data with confirmation and continuation of the order flow (and price action), you need far more 1min, 3min, and 5min candles to make sure the noise is filtered out. That means more moving parts and more variables to manage. Contrast to the 4hr chart where one candle (or two) can give you all the information you need to make a trade while filtering out any noise and meaningless price fluctuations.
For an interesting story about meaningless price fluctuations, make sure to put in a question in the comment box below and i’ll tell you a story which will blow your mind.
In Conclusion
As we can see, when trading and reading price action, a 4hr candle will offer us much more information, and have a cleaner look and feel to it than any 1min, 3min or 5min chart. This will make it easier for you in your learning process as you’ll be making decisions off of less false signals, more information and cleaner charts.
The 1hr, 4hr and daily time frames will have a greater communicative value about direction, clear support/resistance levels, what is a key rejection, who’s in control, while filtering out noise and meaningless order flow and price action. This will give you less confusing information in the beginning, and teach you how to be patient with your trading.
Once you have developed your skills, have some experience and confidence under your belt, it’s really up to you from there how you want to trade, whether it be on the smaller time frames (1min – 30mins) or larger time frames (1hr, 4hr and daily). At that point, it’s a question of style and life-style.
But it should be noted we aren’t saying trading on the lower time frames is meaningless. One can trade price action on any time frame and make money. In fact people are making money on almost every time frame available.
Just understand you have to increase your price action skills and ability to read price action context before trading lower time frames. For some people’s brains, it doesn’t work with their natural wiring and dispositions. For other traders it does, so the key is finding what works for you. If it hurts your brain, then it likely isn’t for you, so make sure whichever style you trade isn’t hurting your brain, but engaging it well.

For those of you wanting to learn how to read price action and the order flow behind it, take a look at our Advanced Price Action Trading Course where you will learn rule-based price action systems to trade the forex market.
Please remember to leave your comments below and to ‘Like’ and ‘Tweet’ to share the article.
Also make sure to check out our most recent article on Price Action Trading.
