Tag Archive for: breakouts

If there is one pattern in the price action you need to learn for trading breakouts profitably, it is this pattern. And no, I’m not talking about a candlestick pattern. I’m talking about trading price action and the order flow behind it.

In today’s trading video lesson, I’m going to share with you my most profitable pattern for trading breakouts.

Read more

Today I am writing a potent article about pre-qualifying forex breakouts, particularly understanding them from a price action & order flow perspective.  When you pre-qualify a breakout, you put yourself in a position to identify it as a high or low probability breakout. To do this however, you have to understand what makes a successful forex breakout trade both from a price action and order flow perspective.

In my prior article 3 Keys for Identifying Breakouts, I talk about 3 such parameters for pre-qualifying forex breakouts.  They are;

1) Well Defined Support/Resistance Level

2) Pre-Breakout Squeeze/Pressure/Tension

3) 20ema Carry

When you can identify these prior to a potential breakout, you highly increase the probabilities of trading a successful breakout. But let’s dig into this a little deeper as to why from a price action and order flow perspective.

Order Flow Behind Breakouts
From an order flow perspective, breakouts generally start with an initial balance between buyers and sellers.  This usually results in a range of sorts, with two clearly defined support and resistance levels. When you get several touches on these levels, this clearly communicates where both sides of the players are parked (and likely their stops as well).  The more touches on these barriers, the more players are brought in.

Those who are bullish will get in on the bounces off support, while bearish players on rejections off resistance.

However as time goes on, tension starts to build between the two camps as someone will eventually want to take control. In almost all cases, the side with the largest number of orders and money behind their camp, will win this tug of war.

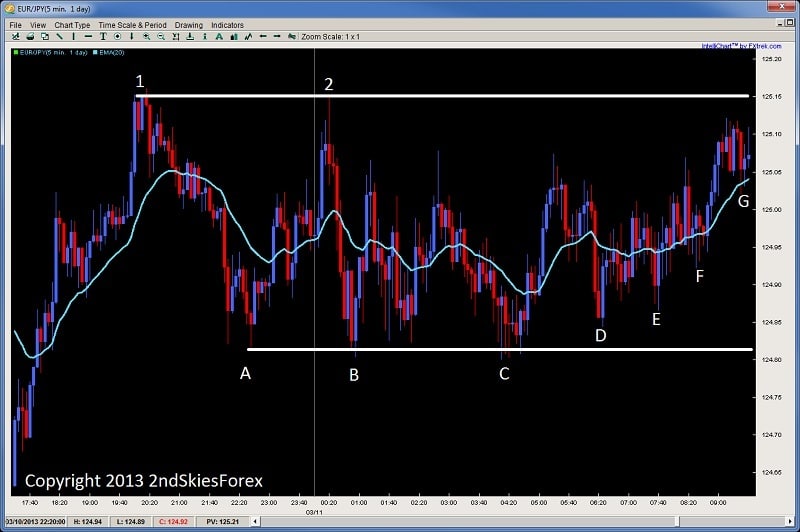
This usually manifests in a higher low (HL) or lower high (LH) being formed inside the range, and more aggressive pushes towards the other line in the sand, while less or no touches on the other side, almost as if the sellers or buyers could not reach the other support or resistance level.  It usually looks something like the chart below.

EURJPY 5M Chart
price action breakouts and order flow chris capre 2ndskiestrading.com eurjpy

Looking at the chart above, you’ll see a clearly defined support and resistance level with a minimum of two touches on each side. This tips us off to where the bears and bulls are parked on the chart with stops just above/below the levels.

Now you will notice each rejection at A & B minimally went up to 125.05 before coming back down and touching the same support level at 124.80.

C pushes price back up to 125.05, but this time the rejection fails to reach 124.80, and can only make it to 124.85.  From an order flow perspective, the buyers are starting to get more aggressive and confident their level will hold, so they are buying up higher (at a more expensive price).

The next pullback at E is also higher, so we are seeing a continual change of hands by the bulls buying higher from support (and their defenses at 124.80).

Now notice every push up from B, C, D, and E only makes it to a maximum price of 125.05.  But with F, it goes to 125.10. There were probably some intraday bears shorting at 125.05 (now stopped out), while the rest were still short at 125.15.

Now that price is pushing up towards the resistance without ever touching the support, this communicates the bulls are taking control of the price action with more orders and money, and will likely continue to squeeze the bears out.

This price action squeeze takes out smart sellers early as they recognize they are about to get stopped out if they stay in. The slower players stay in until they are at breakeven, while the slowest and most stubborn bears stay in till they are stopped out.

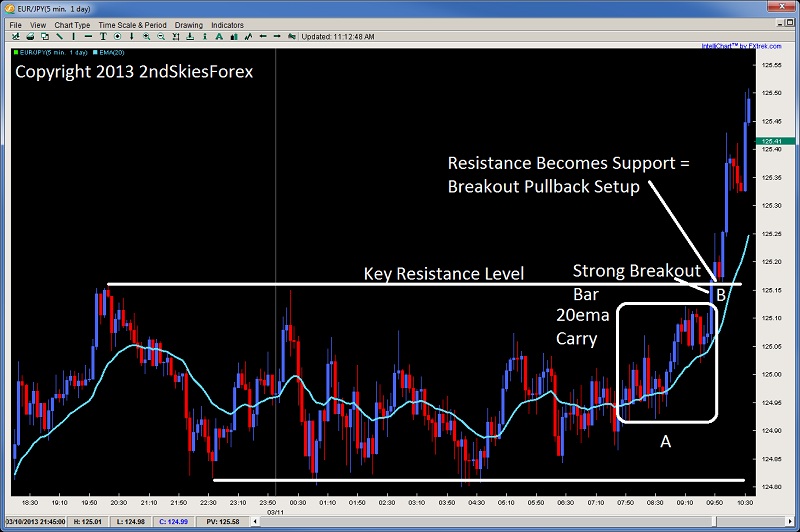
EURJPY 5M Breakout Chart
price action breakouts and order flow chris capre 2ndskiestrading.com eurjpy 5m breakout chart

Using the chart above, we see the final stage of the breakout which is the 20ema carry in Box A.  This “20ema carry” is a common price action formation prior to a good breakout, as it shows;

a) the mathematical representation of price gaining

and

b) gives bulls who haven’t entered a chance to get in prior to the breakout

This is followed by a strong breakout bar at B. This large bar should be curious, for why would bulls buy up so strongly heading into a resistance level if they were worried about sellers parked there.  Usually, institutional traders can smell an upcoming breakout like this, so will push really hard to take out any stops as they go after the barrier.

A “strong breakout bar” is usually a really good sign the breakout will continue as it means stops were tripped above the resistance level, and price jumped aggressively in one bar.  More ideal is if it has a good “clearing distance“, for if it does, then it increases the chances all the stops were tripped by going further away from the resistance level where most of the stops were near.

Tripping The Stops
It is this latter part – the stops getting tripped, which helps fuel the breakout even further, because those bears who were short now have to buy back, and this buying back to exit out helps further fuel the upside breakout. This is why if you ever watch the prices on your actual platform during a breakout like this, it generally reads (using 4 decimal places);

1.2999
1.3000
1.3001
1.3002
1.3003 (stops tripped)
1.3006!

You can always tell where the stops were parked and tripped, because price then jumps a few pips in a shot. The reason for this is – there were no sellers between 1.3003 and 1.3006, meaning the brokers could not print a price there since there were not enough orders there to hold that price. The stops being tripped at 1.3003 were sellers who now had to buy back, and when they did, they helped to push the next market price up 3 pips in a single tick or print.

When you see this, it usually means the breakout will likely continue – as long as you have done your pre-qualifying ahead of time.

One Final Note
Like all things, we have to pre-qualify a forex breakout using several price action characteristics ahead of time. The ones listed above are just a few of the ones we use in my Course, and there are several others which will clue you off and enhance the probability of the breakout being successful or not.

When you can pre-qualify them correctly, you will find breakouts quite easy to trade and accuracy levels around 60-70% as this is what my more profitable students are doing consistently just trading breakouts.

But, you have to pre-qualify them, like any price action setup.  We never just trade them in isolation, as we are not pattern traders. We are price action traders, and we always trade setups & price action in context.

Any good system can perform badly without the proper context. Pin bars can be a highly effective system, if traded in context. But without understanding the type of trend, or volatility levels, you will likely lose money trading pin bars in isolation, even if you trade them at key chart levels.

Thus, we are never just trading patterns on a chart. We are always trading them in context, and this is exactly the same for breakouts, so always pre-qualify them ahead of time.

Look for the three characteristics above, try to trade them with trend more often then counter-trend, and you’ll find they can offer highly profitable trades, with some of the better reward to risk ratios out there, such as 3, 4, 5, or many reaching 7 or 9:1 reward to risk ratios.

Today’s price action tip article is designed to give any beginning, or non-profitable trader, 2 critical tips to help accelerate your learning curve and avoid the pitfalls almost everyone falls into.  If you can learn to follow these two beginner forex trading tips, then you will find yourself making more winning trades, along with less mistakes that tend to get you in trouble.

Trading is already hard enough, regardless of your level, so integrating these two tips will help you to make more winning trades.

Tip #1:  Trade Only When The Price Action & Direction Is Clear
Although this may seem confusing for the beginner, as price action rarely seems clear, there is actually a simple model to determine whether the price action and direction is clear.

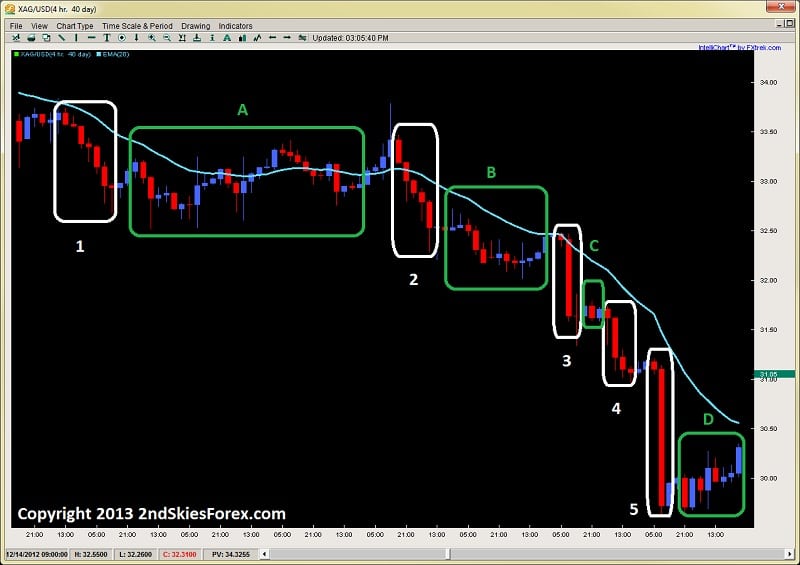
The model I use daily to determine the direction/clarity of the market is looking for impulsive price action moves.  To briefly sum it up, impulsive price action is when the institutional players (those that move the market) are either heavily buying or heavily selling the market.  You can spot these moves by three simple characteristics;

1) The bars are quite large

2) They are mostly one color

3) They have closes towards the highs or lows (in the direction of the move)

When you see these three things, you almost always have an impulsive move.  And when you have an impulsive move, those that move the market are predominantly pushing it in one direction, which is the direction you want to trade with.  When you can find the correct direction, and trade it, you give yourself the greatest probability of making money.

An example of some impulsive moves are below, and you will see when looking at the chart, you will definitely want to be trading in that direction.

Silver 4hr Chart
impulsive price action 3 tips for beginning traders 2ndskiestrading.com

Looking at the chart above, you will see two colors of boxes; White and Green.  If you look at all the white boxes above, you will all notice they have the three characteristics of impulsive moves described above.

Compare them to the green boxes – these have the opposite of the 3 characteristics of impulsive moves. These are called corrective moves, and for beginning traders, they should be avoided as a whole.  When in doubt, if you do not have a clear market or impulsive moves, avoid trading.

Often times for beginning traders, finding the right direction is difficult, and it seems like you tend to find the opposite side of the move.  By learning to only trade with impulsive moves and the price action is clear, you are saying to yourself, ‘I’m only going to fish when the easy fish are around’.

Tip #2:  When Trend Trading – Best to Buy or Sell When the Prior Bar Closes in Your Direction
This is a general rule I suggest to use until you get really good at trading trends.  The reason for this is simple;

a) If you are looking to buy in an uptrend, you have a greater chance of being correct when the last bar to close, closed bullish.
b) If you are looking to sell in a downtrend, you have the greater chance of being correct when the last bar to close, closed bearish

If you think about it – when looking to buy in an uptrend and the last bar closed bullish, it is a confirmation for the last candle (and time), the bulls were in control.  This bullish close is more likely to inspire bulls the trend is still alive.

Contrast this to buying when the bears demonstrated control on the last bar.  This means they dominated the order flow for that bar, and may be pushing against your orders.  This increases the chance the bulls will take profit after seeing a bear bar as opposed to a bull bar (continuation).

However, if the bulls demonstrated control on the last bar, then they are likely still present pushing the market in your favor, so this gives you a greater probability to have follow through on your trade when you enter the market.

Two examples are below.

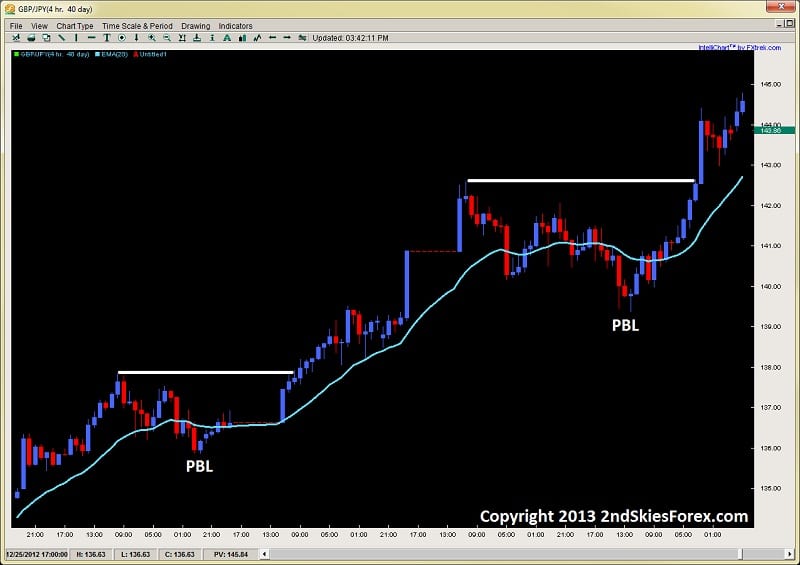
GBPJPY 4hr Chart
pullback low pbl price action chris capre 2ndskiestrading.com

In this chart, we clearly have an uptrend, which offers a couple of with trend pullbacks.  In these pullbacks, you will see two PBL’s (Pullback Lows), which led to a breakout of the prior SH (Swing High) for the trend. You will notice in both of them, the low for the pullback was a bull candle, and the follow up price action was a strong series of bull candles to follow.

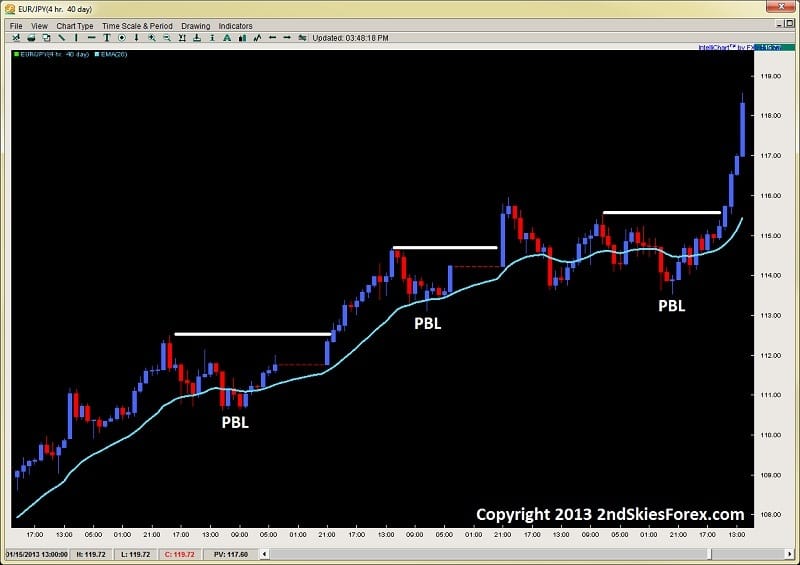
Another example is in the chart below on the EURJPY 4hr Chart
price action pullback low pbl chris capre 2ndskiestrading.com

In this chart, we have 3 major with trend pullbacks, and in two out of three of them, the PBL’s had a bull bar at the bottom, also demonstrating this principle.  As a general rule, bulls will feel more confident buying a pullback (or breakout) in a trend, when the last bar closed bullish. This is a stronger communication the bulls have been able to take control of the price action and order flow for the last bar.

In Summary
Trading is already challenging enough, and finding the right direction is one of the most crucial aspects to making good trades. In the beginning, you already have enough to think about, so try to keep it simple, and trade when the direction is clear.  Look for impulsive price action moves as much as possible, and when you find them, trade in that direction.

However, when the price action is not clear, try to stay out until a clear signal and market emerges.

When trend trading, you have a much better chance in the beginning, if you buy/sell when the last bar closes in your direction.  This closing in your direction is a clearer communication from the market, the bulls/bears are more likely in control, and in your favor.

I hope these two beginner forex trading tips help you.

To learn more price action techniques and systems, make sure to check out my price action course where I have a large community of traders, posting live trade setups daily, and I teach them how to read and trade price action.

Breakouts are some of the tougher environments for traders, and understandably so because they represent potential, but often fail.

I’ve already written an article for trading breakouts Post-Breakout, but what about the Pre-Breakout moments where you have to make that key decision to trade it or not?

How do you identify them and what are the key elements that precede strong breakouts?

This is the key point of this article – to give you 3 tips for identifying a soon to be strong breakout so you don’t get trapped in a false breakout.

I will go over the three elements you will want to find before considering a breakout, then briefly highlight what is behind them from an order flow perspective.  By learning to spot these breakout trading clues, you can position yourself to trade higher probability breakouts and capture a larger portion of the upcoming move.

1) Well Defined Support/Resistance Level
The first pre-requisite to identifying a healthy pre-breakout situation is having a clearly defined barrier in the form of a support  or resistance level. The classic case is when you have a trend in place (lets say uptrend) and then the price action runs into resistance at a key level.

Ideally, you want there to be at least two touches on this level before defining it.  The more horizontal and neater this level is – the better.  But it should be noted, this is just a pre-requisite and generally by itself not enough to identify a healthy breakout setup.  The reason for the two touches is to identify a sticking point where players are parked and what level they are defending that the (bulls in this case) are unable to penetrate.

By finding both parties present, we have the environmental potential from an order flow perspective to create a healthy breakout.   In this example, the sellers are clearly holding a price they want to defend and have stops just above it.  By them staking their defense in a clear location, it communicates where their orders and stops are likely parked.  It is tripping those stops, along with bringing in new buyers that is the goal of the bulls.

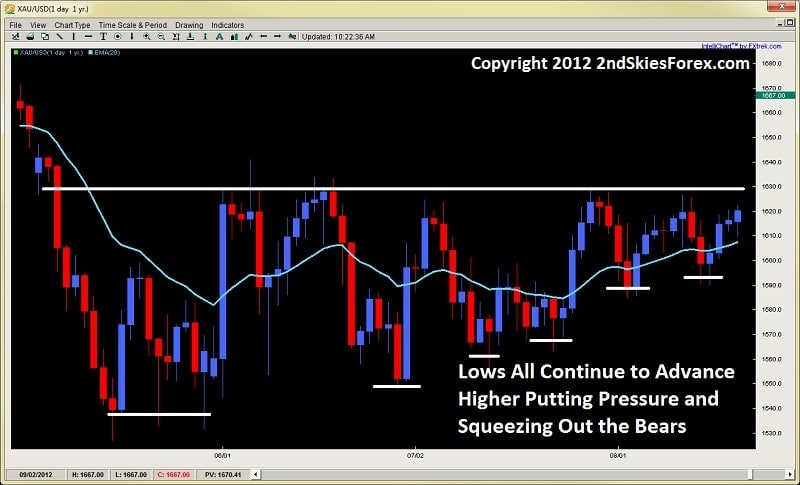
Below is an example of a clearly defined resistance level after a downtrend and consolidation period, communicating there are bears clearly defending a level.

Image 1.1
breakout trading clear resistance level 2ndskiestrading.com aug 28th

2) Pre-Breakout Pressure or Tension (Squeeze)
The second element you want present prior to a breakout is a pre-breakout pressure or tension that manifests as a squeeze.  This pre-breakout tension is highly important because it creates a friction and pressure upon the defenders (in this case the bears).  As the bears realize their rejections off a key level are getting smaller, while the bulls continue to gain more upside and territory, it causes a friction in their minds that forces them to make a critical decision (either stay in and defend, or exit the market).

As the room gets smaller and smaller for them to work with as the bulls squeeze the bears out, sellers defending a level will often exit early, leaving the defense to those who are not realizing the game is up. This further weakens the defenses at these levels until very few are left to carry the burden.

You can easily identify a price action squeeze and this pre-breakout pressure, or tension, by the price action forming higher lows in attacking a resistance level, or lower highs when attacking a support level. This is a combination of the current bulls willing to buy up the instrument at a worse price, along with new bulls wanting to get long before the breakout.  A good example is presented in the same chart which I will zoom in on to highlight.

Image 1.2
price action squeeze breakouts chris capre 2ndskiestrading.com aug 28th

3) 20EMA Carry
Another key element you will find prior to breakouts is the 20ema begins to carry price leading up to the key resistance or support level that is being defended.  This is not so much that traders are placing orders there prior to the breakout (although many will), but also a visual representation of how the squeeze is taking place.

Just looking at the chart above, we can see in the beginning, after the first rejection off the key resistance level, price penetrated nicely below the 20ema.  But as we get closer and closer towards the right where the squeeze is taking place, you see the market barely go below it for more than a single candle before resurfacing.

Also, you will notice how the first few times the rejection approaches the 20ema, it breaks through after one candle.  But towards the end many candles start to float above it where some traders are entering in anticipation of the breakout.

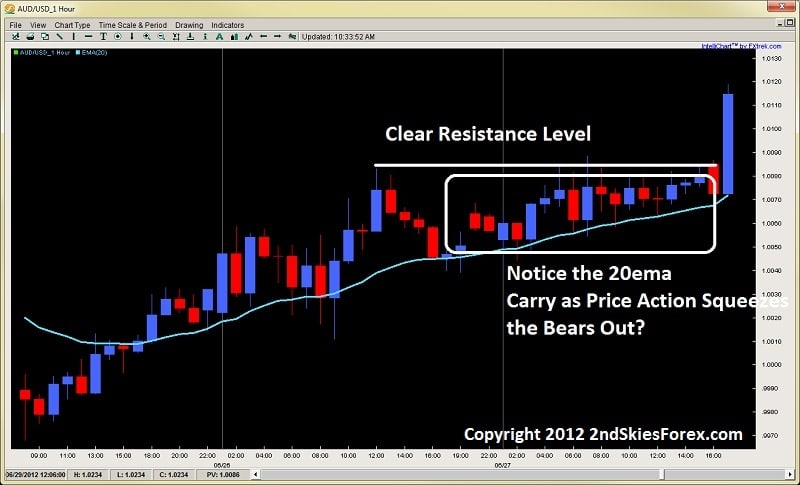
Another really good example was one I traded and blogged about ahead of time with the AUD/USD on the 1hr time frame.  The pair had been trending up for 110 pips over two days, but ran into a key resistance level that it got stuck on at 1.0081 (image below).

Image 1.3
20ema carry price action squeeze breakout 2ndskiestrading.com aug 28th

Using the example above, notice how the 20ema in the middle of the chart is penetrated about 20pips, but then as we get closer and closer to the resistance level and the squeeze begins to happen, notice how the 20ema begins to carry the price action, and the penetrations get smaller and smaller?

This is a combination of very few sellers defending the level, while the bulls in anticipation of a breakout (realizing they have control) are likely entering new positions to get in ahead of the upcoming breakout (I was one such trader).  Eventually the pre-breakout pressure and tension became too intense and the bears gave up when the bulls made their push, tripping stops and creating a large breakout bar with a strong close.

In Conclusion
Identifying breakouts can offer highly profitable opportunities when you can position yourself well.  But to do this, you must be able to identify highly probable breakouts with these 3 key elements which are;
1) Well Defined Support/Resistance Level
2) Pre-Breakout Pressure/Tension (Squeeze)
3) 20EMA Carry

If you can learn to spot these key elements prior to a breakout, along with reading various other price action clues, you will find yourself entering in higher probability breakouts, increasing your success and profitability.  You will also find yourself not getting trapped by false breakouts which can wreak havoc on your account and confidence in trading them.  Thus it is critical to read and identify the key elements prior to a breakout.

For more info on how to trade price action, along with lifetime membership, getting access to the traders forum & more, make sure to visit my price action course page.

Other Related Articles:
Trading Breakouts
Key Price Action Elements to Breakouts
Breakout Role Reversal Setups

With the holiday coming tomorrow, I wanted to write a short price action article with 3 quick, but highly useful tips for using a breakout trading strategy.  If you can add these forex breakout strategy tips to your price action toolbox, you can significantly increase your success rate when trading.
 
1) Time of the Day
One of the key components to a successful breakout is volatility.  When you have greater volatility, you have more orders/players behind the market and therefore increase the probability the breakout bar will have more force behind it. This helps the breakout bar to take out more stops and push the market further in the breakout direction.
But, volatility fluctuates tremendously throughout the day.  Statistical analysis has pointed out to how breakout strategies actually function far better during the London and NY session while tend to fail during Asian market hours.  This is simply to do with volatility, so the time of the day you take the breakout trade will have an impact on the success of your trade.
Ideally, breakout trades are taken during the following times;
-1st three hours of London session
-30mins before NY open up to 30mins before London close
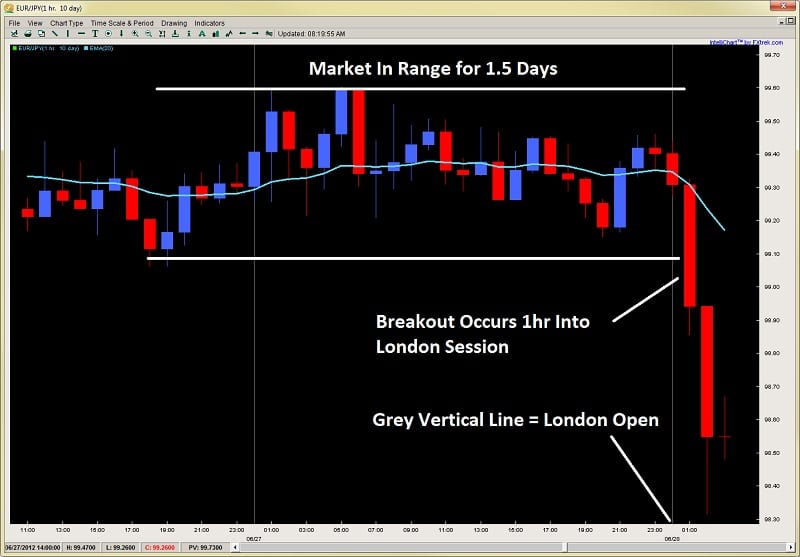
A great example of this is in the chart below how price consolidated for a day and a half, then broke out massively during the 2nd hour of the London session.
Image 1.1 EURJPY 1hr Chart
breakout trading price action 2ndskiestrading.com image 1.1
Outside of these times, the probabilities decrease for your breakout trade (variably depending upon hour) as volatility is either low or in a declining phase and may not have the order flow behind it to break through the key levels.  Also avoid taking breakout trades several hours prior to major economic announcements, or going into major holidays where trading and liquidity will be subdued.
 
2) Use Options Data to Aid Your Timing
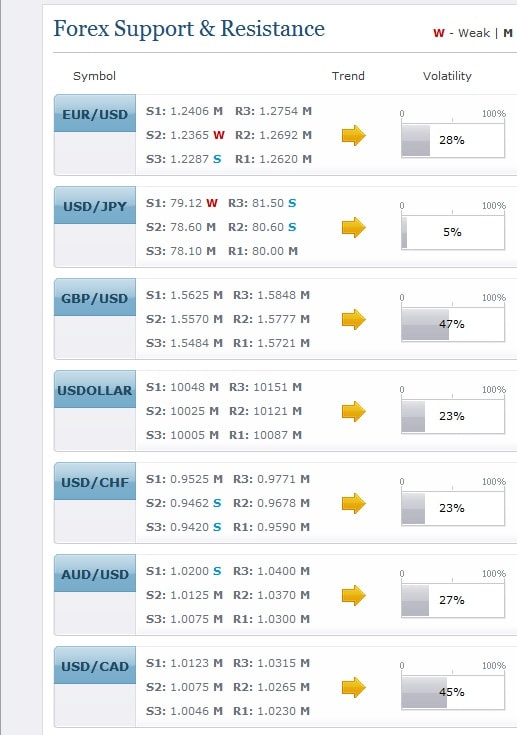
Daily FX has a useful piece of data in their technical analysis page whereby they publish a Volatility Percentile feature.  This is derived from options prices with a higher number communicating options traders are expecting greater volatility, while a lower figure suggests more range bound/reversion to the mean type play.
Image 1.2 Volatility Percentile Data
volatility percentile breakouts 2ndskiestrading.com image 1.2
You can simply check the data at any time (per pair) to see where the volatility percentile figure is at.  When you are thinking of taking a breakout trade, ideal is to have the Volatility Percentile figure above 70% or greater, suggesting options traders are expecting a greater amount of volatility in the market and thus increasing the probability of your breakout trade working out.  If several of the pairs are above these percentages, then there is broad market participation which will likely create strong impulsive moves in the market which are ideal for breakout trading.
 
3) The Longer the Compression, the Better
Usually breakouts give you several warning signals ahead of time a breakout is happening, either via a squeeze in the price action to one side of the market, a tightly coiled range or higher low/lower high forming inside the range.  Regardless of what the clues are, the longer the compression in the price action, the better.
Why?
Markets, traders (and brokers) do not like tightly bound up price action.  Smaller ranges and markets mean less continuation and directional follow through.  If markets turn around quickly, they offer us less profit in the direction we have chose.  But a long compression in the price action will build up a pressure and friction which eventually needs to be released.  The longer this builds, the better, for when it breaks out, the market can often go for a large move in the breakout direction as seen in the chart below.
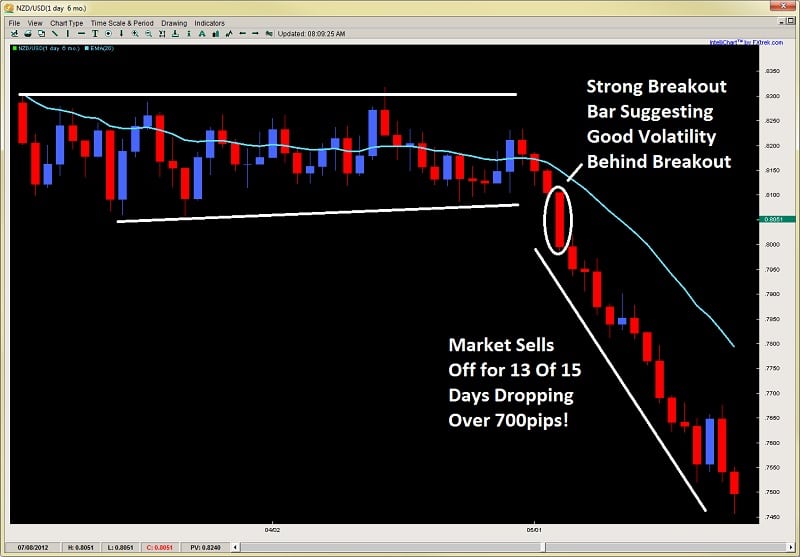
Image 1.3 NZDUSD Daily Chart
breakout bar nzdusd price action trading 2ndskiestrading.com image 1.3
You will notice in the chart above how the price action was consolidated in a tight 200pip range for almost two months.  But when it broke out, forming the breakout bar, it sold off for the next 5 days in a row, 11 out of 12 days and 13 of 15 days, selling off for over 700pips.
 
In Conclusion
Breakout trades can offer some really profitable opportunities, but can be maximized by adding these three forex breakout strategy tips above which are;
1) Time of the Day
2) Using Options Volatility Data
3) Looking for long compression periods prior to the breakout
If you can learn how to spot these, along with other various price action clues, you can increase the profitability and success rate to your breakout trading.
For more info on how to trade price action and breakouts, along with lifetime membership, getting access to the traders forum & a lot more, make sure to visit my price action course page here.
Other Related Articles:
Key Price Action Elements to Breakouts
The Best Support & Resistance Levels
Breakout Role Reversal Setups

This is our newest price action trading strategy video talking about how to trade ‘forex role reversal levels’ using the breakout pullback setup. We share some advanced price action elements on how to read the order flow and price action, along with what are the unique elements in a good breakout.