Tag Archive for: false break

Chris Capre’s current live open price action and ichimoku trades: USDMXN, VIX, CAMP, EA

New to Forex? Then check out my FREE Learn Forex Trading Course with videos, quizzes and downloadable resources

Want to learn how to draw support and resistance? Check out my latest video How To Draw Support & Resistance (5 Tips)

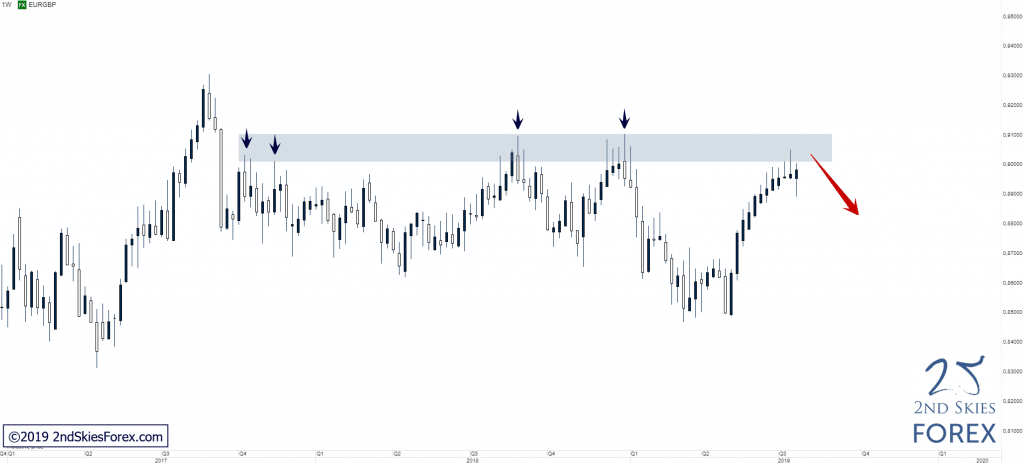
EURGBP – Running Into Major Resistance (Weekly chart)

Price Action Context

After a failed bearish continuation + false break back above LT support in May, the strong MT bull run that followed has taken the pair all the way back up to a major LT resistance that has held since Q3 2017.

EURGBP_-_Running_Into_Major_Resistance

Trending Analysis

Overall neutral bias with the LT resistance offering potential bearish plays with 0.8710 being the closest LT support to look out for. A break above 0.9100 would technically open up for a continuation towards 0.9300.

Key Support & Resistance Zones

R: 0.9000 – 0.9100

S: 0.8620 – 0.8710

Stay tuned to our members market commentary for updates.

******

GBPUSD – Attempting To Break Key Support (Daily chart)

Price Action Context

After being rejected twice from 1.3300 in Feb/Mar, price sold off towards the lows created in 2016/2017. Bulls seem to be absent and unless they step in soon, it’s like this key support zone will fail to hold IMO as price action is looking very weak atm.

GBPUSD_Attempting_To_Break_Key_Support

Trending Analysis

LT bias is bearish and a strong break and close below this key support level opens up for a likely bearish continuation towards the 2016/2017 lows and can offer potential short plays for bears.

Key Support & Resistance Zones

R: 1.3300 – 1.3385

S: 1.2400 – 1.2485

******

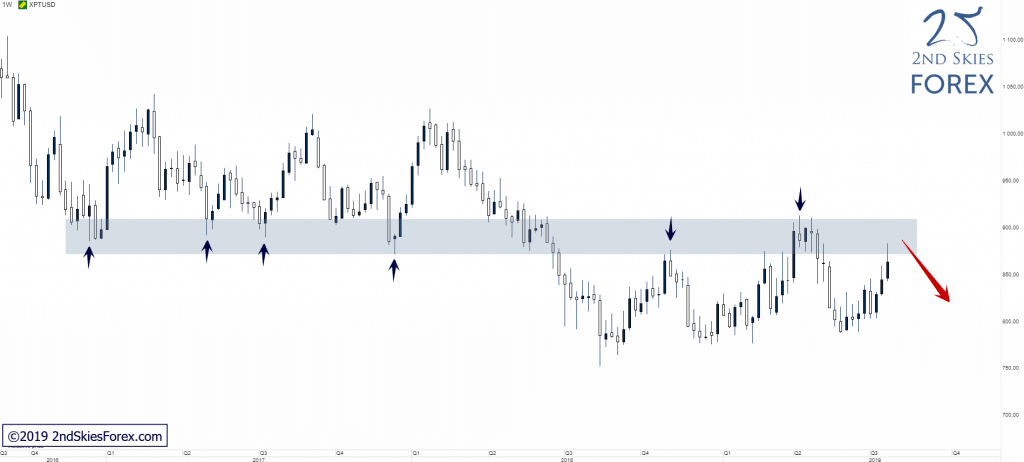
XPTUSD – Back @ LT Key Resistance (Weekly chart)

Price Action Context

After reversing a bit shy of the LT support zone, Platinum is now back at the LT resistance which has rejected price multiple times since mid-2018.

XPTUSD_Back__LT_Key_Resistance

Trending Analysis

LT bias is bearish and if bears successfully can defend this zone a move back down towards the LT support is likely. A strong break and close above this zone on the other hand would put 1 010 back into focus.

Key Support & Resistance Zones

R: 870 – 915 S: 754 – 777

Chris Capre’s live open price action and ichimoku trades: GBPUSD, NZDJPY, USDJPY, USDNOK, CAC40, VIX

New to Forex? Then check out my FREE Learn Forex Trading Course with videos, quizzes and downloadable resources

How Much Should You Risk Per Trade? Watch our latest video How Much Should You Risk Per Trade {3 Rules}

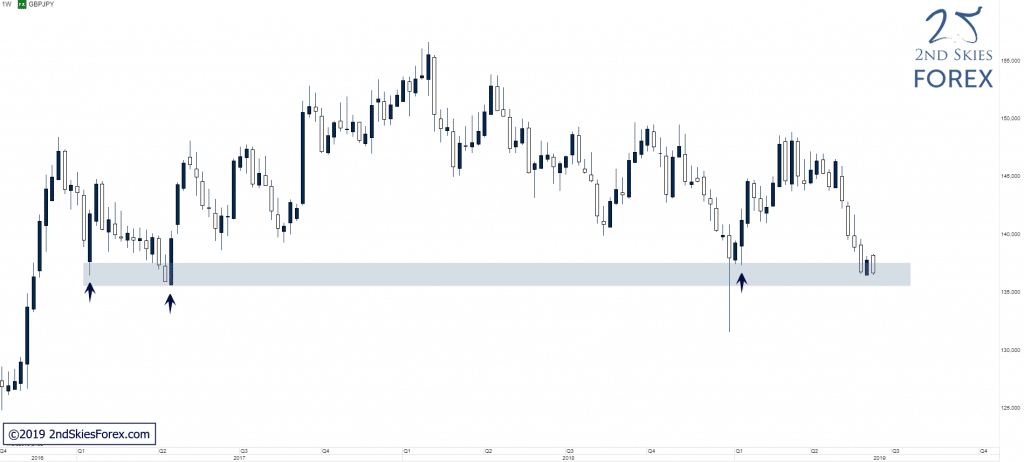
GBPJPY – Testing Multi-Year Support (Weekly chart)

Price Action Context

After breaking below 140.00, the strong selling continued and the pair is now testing a multi-year support zone at which I think at least a solid ST bounce is likely considering the significance of this support zone.

forex-gbpjpy-key-support-2ndskies

Trending Analysis

If bulls are able to successfully defend this key support, a move back up towards 140 is likely IMO and should 140 fail to stop price, 148 would be the next key resistance to look out for. A failure of this support on the other hand would open up a solid amount of downside with 130 being the first support in line to look out for.

Key Support & Resistance Zones

R: 138.60 – 140.00
S: 135.50 – 137.50


******

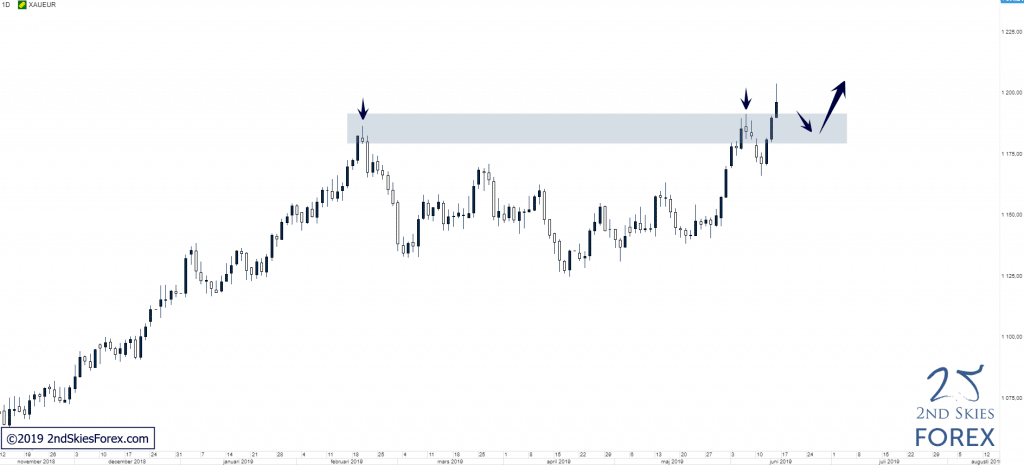
XAUEUR – Broken Above Key Resistance, Potential False Break (Daily chart)

Price Action Context

After a brief rejection at the KSP from February, the precious metal found support at 1 170 and impulsively broke above 1 190, producing a solid bullish close above the resistance.

gold-vs-euro-bullish-trend-2ndskiesforex

Trending Analysis

LT bias is bullish and weak pullbacks towards the broken resistance can present potential buying opportunities. A break and close back below 1 180 would render this a CT FB and initially open up for a move back down to 1 135.

Key Support & Resistance Zones

R: 1 215 – 1 225
S: 1 180 – 1 190

******

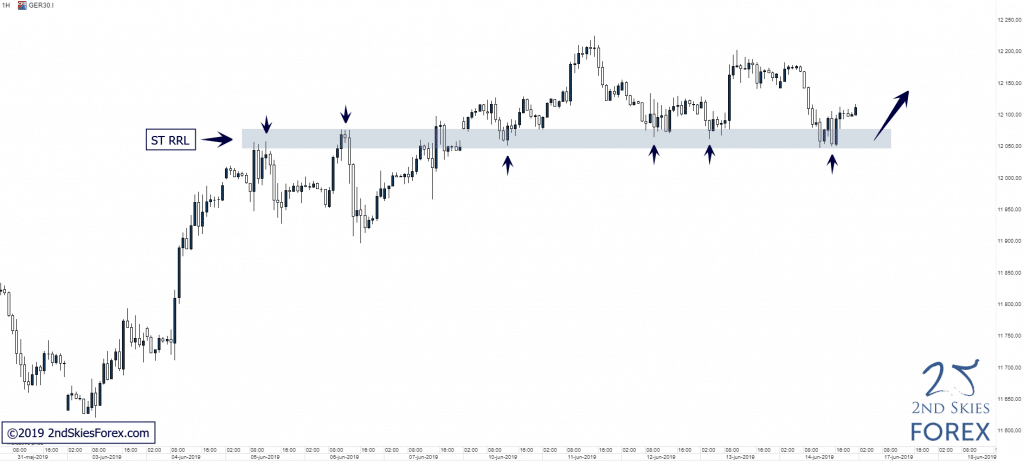
DAX – Holding Above ST RRL (1h chart)

Price Action Context

After putting in a WT false break at 11 850, which we talked about in our commentary on the 8th of June, price continued trading higher and is currently holding above a ST RRL.

dax-trade-signal-2ndskiesforex

Trending Analysis

LT bullish bias and bulls can look for possible buying opportunities around the ST support level. A break below this ST support would open up for a move lower back into 11 850 which in turn also could present potential buying opportunities IMO.

Key Support & Resistance Zones

R: 12 173 – 12 225
S: 12 045 – 12 080

Chris Capre’s live open price action and ichimoku trades: EURUSD, GBPUSD, AUDJPY, EURJPY, EURCZK, EU50

New to Forex? Then check out my FREE Learn Forex Trading Course with videos, quizzes and downloadable resources

Forex Trading Q&A: How We Teach Price Action Skills & Why You Need Patience {New Video}

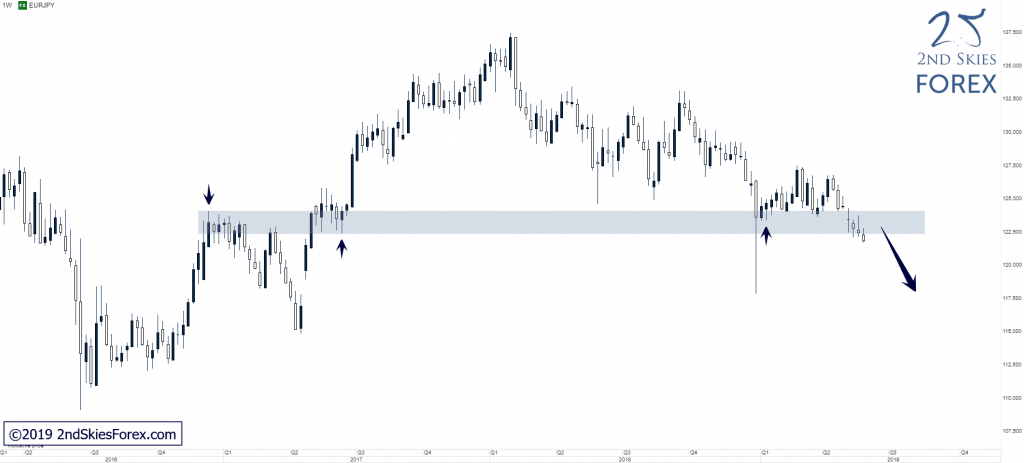
EURJPY – Breaking Below LT Key Support Zone (Weekly chart)

Price Action Context

With almost no signs of bullish order flow over the last few weeks, price has slowly been chewing its way through the LT key support zone we’ve mentioned in earlier commentaries, and this week we’re seeing the first solid attempt by bears to fully clear this support zone.

eurjpy-forex-trade-setup-2ndskies

Trending Analysis

A strong weekly close below this support zone would open up for a potential bearish continuation towards 1.1860, whilst a bullish impulsive move back above the support zone would render this a false break and put 1.27 back into focus.

Key Support & Resistance Zones

R: 122.50 – 124.00
S: 118.60 – 117.70

Last year I did a top trade ideas for 2018, and now that I’m really centering my new year’s around losar, it’s time for a new trade ideas for this year. But before we jump into that, we need to hold my feet to the fire and see how I did last year. Let’s jump in and review.

2018 Top Trade Ideas Reviewed

I gave 3 trade setups and ideas free to the public which are below.

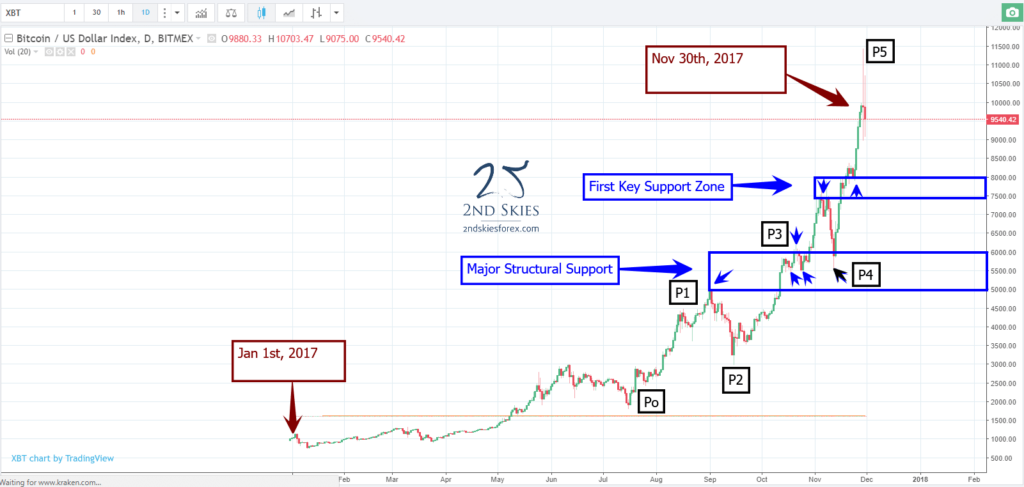
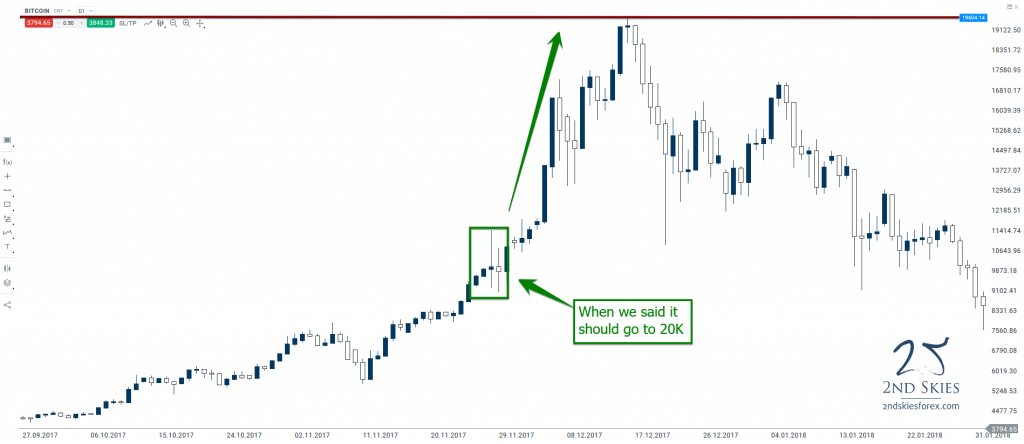
2018 Trade Idea #1: BTCUSD Will Hit 20K

Here is the chart before my trade recommendation (image below).

bitcoin-price-action-chart-2ndskiesforex

And here is the chart after.

bitcoin-2019-trade-ideas-2ndskiesforex

How close did I get? It got within $50 of 20K, or .2% from my target while gaining about 80% from its price near 11K.

The Verdict: A Win. Hard to argue otherwise.

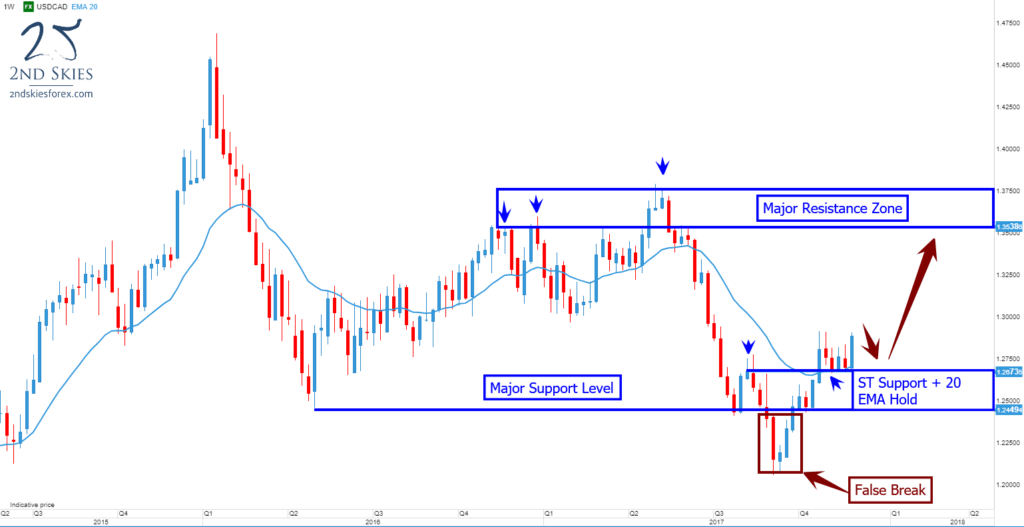
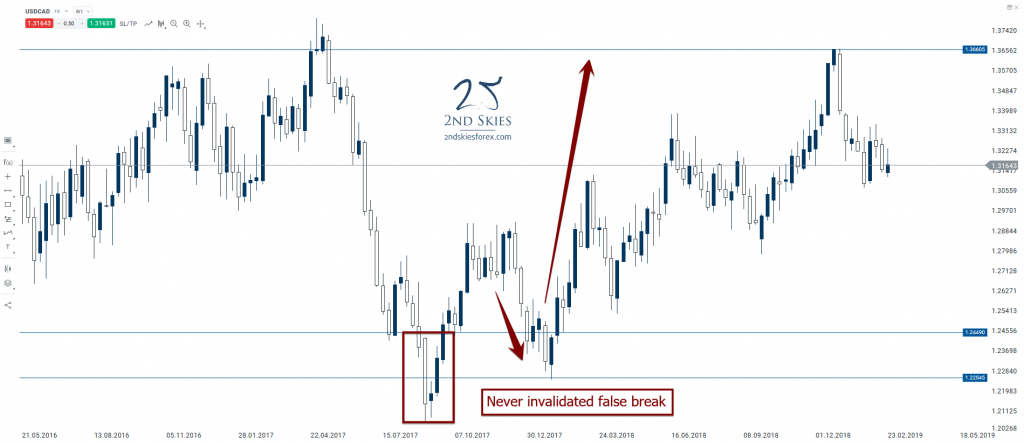
2018 Trade Idea #2: USDCAD Should Pullback And Then Hit 1.35

As we mentioned in our trade ideas, we felt like the false break provided us with a bullish trade signal and that prices should go higher targeting 1.35 and perhaps 1.37+

Here is the chart at the time of the trade recommendation.

usdcad-trade-ideas-and-price-action-context-2ndskiesforex

And here is the chart after.

usdcad-trade-ideas-2ndskiesforex

The Verdict: Overall, a win. The false break structure was never violated.

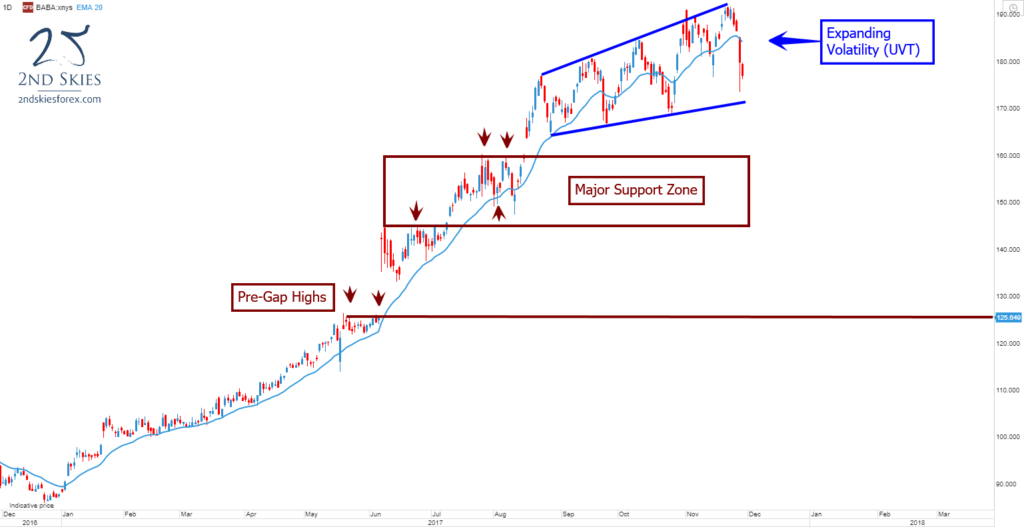
2018 Trade Idea #3: Alibaba Is Going to $300

At the time of the post last year, I felt like the increasing volatility was suggesting an unclean volatile trend, but that overall prices should go higher towards $300.

Here is the chart I had from last year.

alibaba-trade-ideas-and-price-action-context-2ndskiesforex

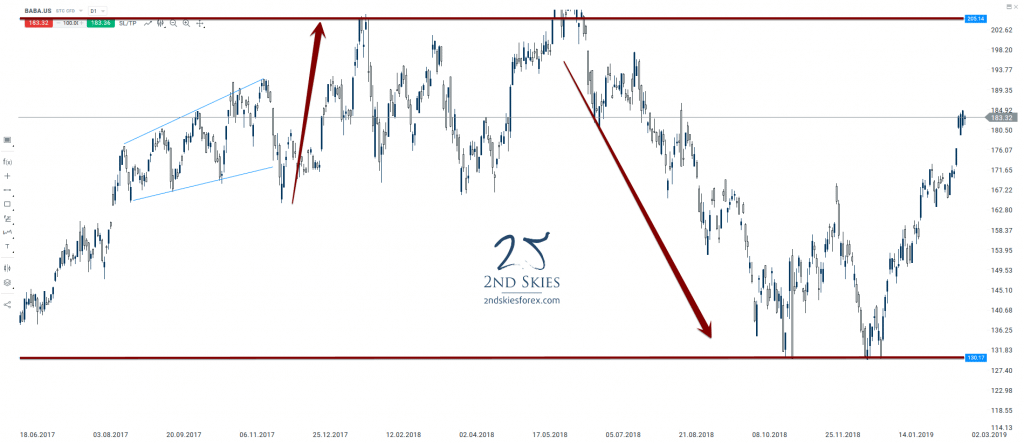
And here is the chart after.

alibaba-trade-idea-2ndskiesforex

The Verdict: Definitely a loss. I was clearly wrong on this one.

Now that we’ve gone through the 2018 trade ideas, let’s move onto 2019.

Top Trade Ideas for 2019

#1 Facebook Has Peaked, Looking to Sell

A lot has happened for big tech this last year. While Amazon is coming under greater scrutiny, along with Google, Facebook has been the bad apple causing the biggest problems for big tech.

Scandal after scandal has come out, and IMO it’s really starting to weigh on investor sentiment, employee morale, and long term prospects for the company. I recently had a conversation with my friends daughter who is in High School. We talked about FB, and she flat out said, “Most people my age don’t really use FB that much anymore, and it’s not that popular“. So the newest generation of people are becoming less and less interested in FB. That is telling sign IMO.

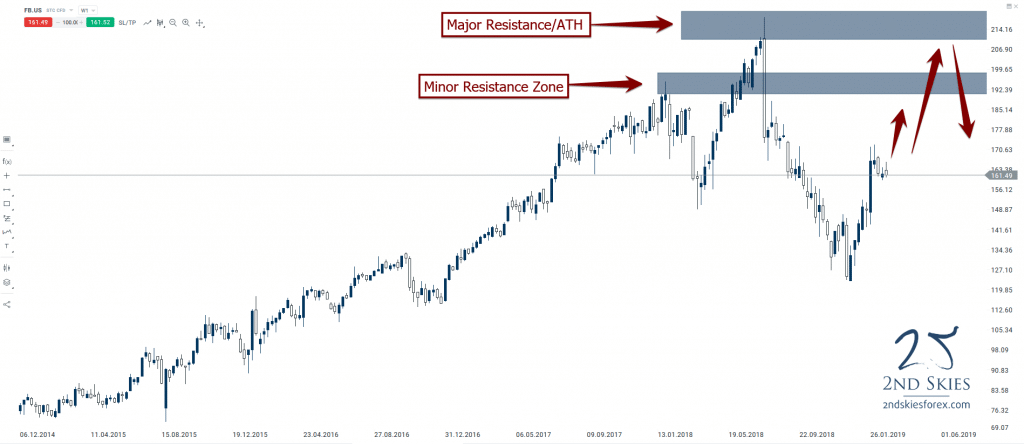
When I look at the charts, I see a stock that had very little resistance or selling from 2013 (around $25 a share) to $212 a share. And then shit started to get real.

facebook-price-action-trade-ideas-2ndskiesforex

After spiking north of $212 to $218, Facebook had had its largest one week drop on record closing at $175. That one week of selling took out the prior 12 weeks of gains, and we haven’t seen $200 since. It sold off for 2 out of every 3 weeks right around the time the Cambridge Analytica scandal broke. It’s low last year was around $123, which is a whopping 43% drop in a matter of 5 mos. This peak to trough movement took out all the gains from 2018, 17′ and most of 16′.

The stock (like most indices) has rebounded well this year, but remember, when making all time highs year after year, there’s very little resistance on the way up. The 2nd time around, there will be resistance and sellers waiting.

Turning to the price action, and considering the above, I want to be selling on rallies. The earliest (and most aggressive) location I’ll consider selling, perhaps a small position, will be between 183 and 193 which is the first major resistance zone marked on the chart.

The second key resistance zone is notable the all time highs between 210 and 218. Downside I wouldn’t be surprised to see 150 and then 122 revisited. If more scandals break, and other big fines are levied on the Zuckerberg darling, we could be witnessing the peak of FB.

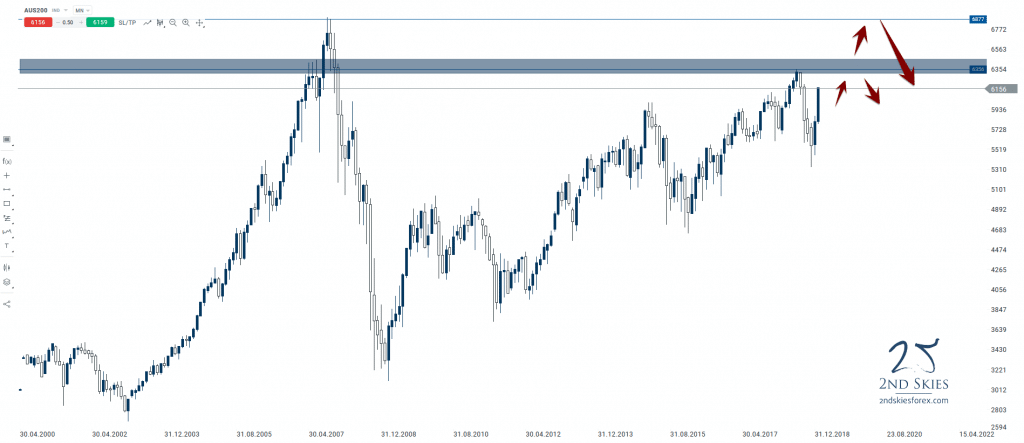
#2 ASX 200 – Approaching Major Resistance & ATH

Since the 2007 peak of 6877, along with the subsequent sell-off, the ASX 200 has never breached the 07′ peak, nor visited it once. However since 2008, the major Australian index has been climbing steadily, gaining virtually 2 out of every 3 months with a continuous building of higher lows and higher highs.

The index however is approaching some major resistance coming up with the 2018 peak ~6356, and then the 07′ peak of 6877.

asx-200-trade-setup-2ndskiesforex

It’s hard to imagine a scenario where it just blasts through either the first, or second zone without finding some sellers, and thus presenting a short opportunity.

If the first zone on the chart fails, then I’ll definitely be looking to sell near the 6877 peak, targeting first the zone below it, and potentially a larger sell-off towards 5400, possibly sub 5000.

We’re getting into rarified air here, so hard not to look for a short opportunity. ST the index looks bullish and is posting a strong start to the year. But offers are likely parked above where I suspect we’ll see a real challenge to this ST bull run.

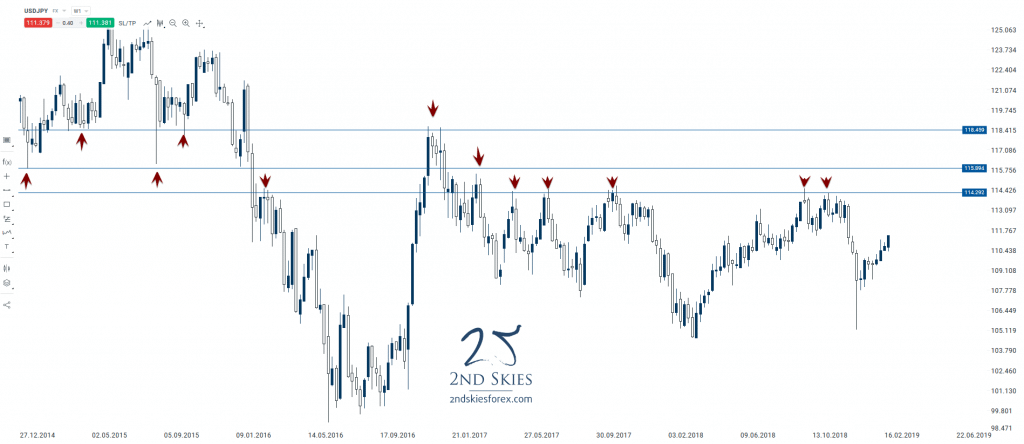
#3 USDJPY – Range Structures + Resistance Ahead

Since Feb 2016, the USDJPY has not had a weekly close above 118.45, and nothing above 115.90 since late 2016. 114.29, which is a major resistance level above has been tagged about 5-6x over the last 3 years, all resulting in 600+ pip rejections.

usdjpy-2019-trade-idea-2ndskiesforex

IMO, one of these levels is likely to present a solid level of resistance, and keep the range structures intact.

Hence I’m looking to sell, either at 114.29, 115.89. or 118.45. Shoot, I might even sell at all 3 levels, but my suspicion is one of these levels will hold, and present a great selling opportunity.

For the downside, I’ll be looking to target the bottom of the range structure which comes in initially near 108.75, then 105.

******
For our course members last year, we did a total of 10 top trade ideas for 2018. We’ll be doing the same for our members over the weekend in a video which I’ll post in the coming days.

Until then, I hope you enjoyed these trade ideas, and that you have a great end to your trading week and month for February.

Chris Capre’s current open price action and ichimoku trades: EURUSD, GBPUSD, USDMXN, USDJPY, BIR, TLS

NOTE: I’ve never met a struggling trader that hasn’t skipped steps. Don’t make that mistake. Read my article The 4 Stages of Becoming A Millionaire Trader to avoid this.

NZDUSD – Rejected At Resistance, Now Testing Support (Daily chart)

Price Action Context

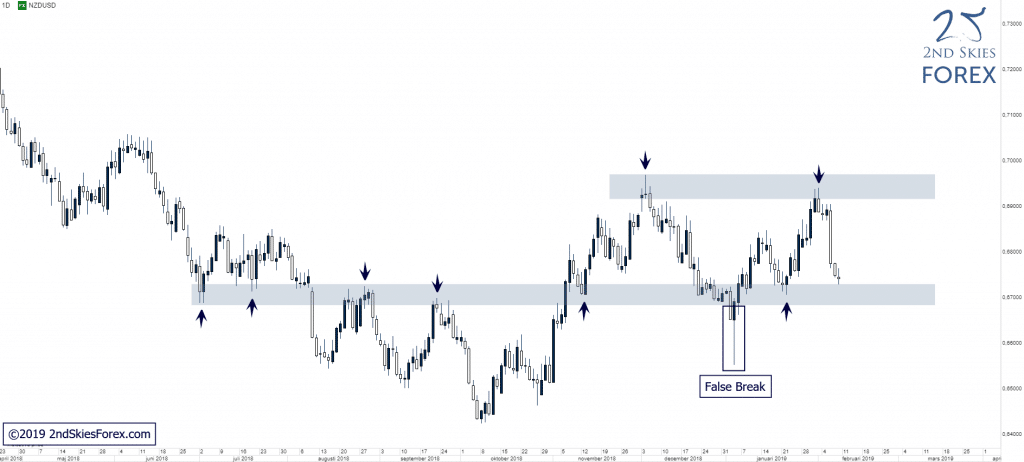
For now, despite 2 solid attempts, bulls have not been able to successfully clear 0.69 which is the top of a multi-year S/R zone. Instead, bears again stepped in, heavily rejecting the bullish attack and price is now back testing the LT support a second time after the false break in early January.

forex-nzdusd-key-support-level-2ndskiesforex

Trending Analysis

If this LT support holds, a move back up towards 0.69 is likely whilst a break below would open up for a possible bearish continuation towards 0.65.

Key Support & Resistance Zones

R: 0.6920 – 0.6970
S: 0.6680 – 0.6730

Stay tuned to the members daily trade ideas for updates.

******

EURGBP – LT Range Still In Play But Expanding (Daily chart)

Price Action Context

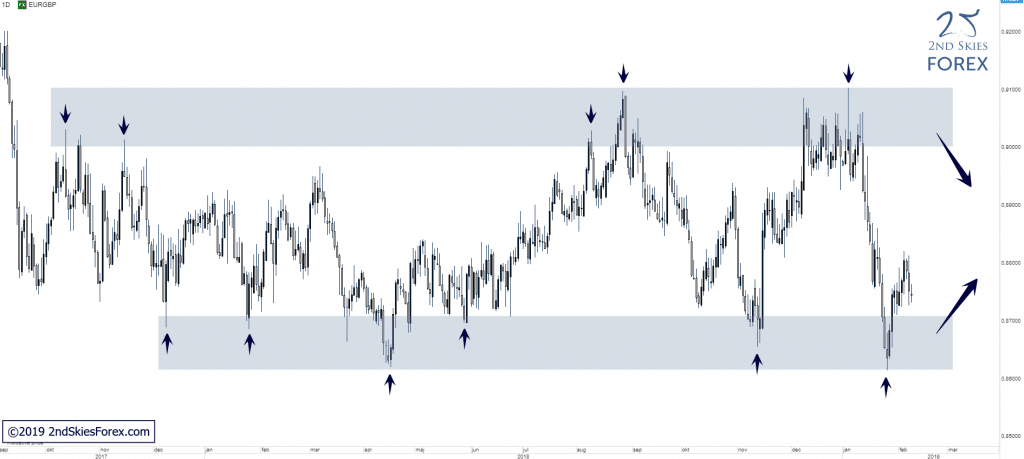
Despite the heavy bearish assault on the LT support, bulls stepped in at the lows from April last year and were able to defend the support zone for now. With LT volatility increasing, it seems the range is expanding both to the up- and downside which made us adjust our S/R zones slightly.

forex-eurgbp-trade-setups-2ndskiesforex

Trending Analysis

Non-directional LT price action since October 2017. Neutral bias while trading within this range and traders can look for potential trading opportunities at the extremes (top/bottom) of this range until it breaks.

Key Support & Resistance Zones

R: 0.9000 – 0.9100
S: 0.8620 – 0.8700

******

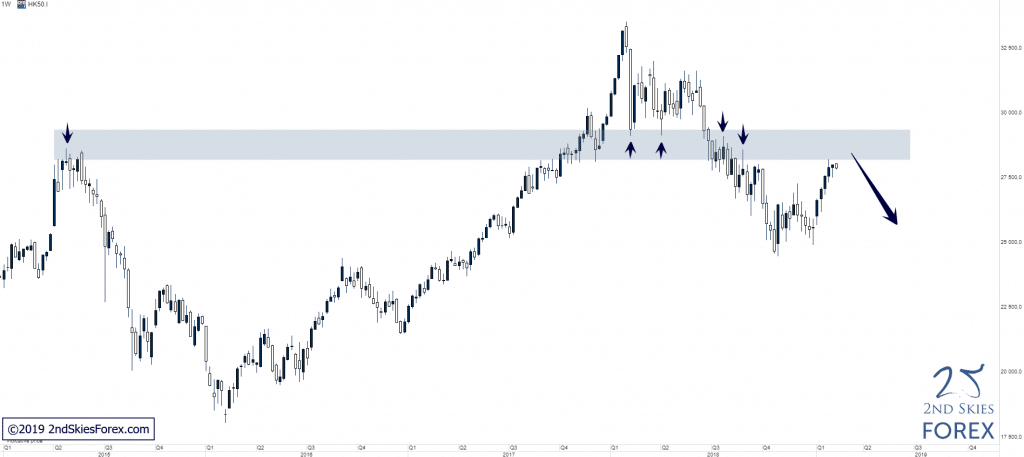
Hang Seng 50 – Pullback To LT Key S/R Zone (Weekly chart)

Price Action Context

LT exhaustion into 33 350 followed by impulsive selling and corrective price action. The corrective structure got broken to the downside in the end of June last year, followed by continued selling towards 25 000. After putting in a rough double bottom, buyers came back and have now pushed price all the way back up to the LT S/R zone, a zone that coincides with a KSP from Q2 2015.

hang-seng-50-trade-ideas-2ndskiesforex

Trending Analysis

LT bias bearish and sellers can look for potential trading opportunities around the LT S/R zone.

Key Support & Resistance Zones

R: 28 200 – 29 350
S: 24 400 – 25 400

Chris Capre’s current open price action and ichimoku trades: EURUSD, GBPUSD, USDMXN, USDJPY, BIR, TL

NOTE: How do you know if you’re taking the right steps to make money trading, or skipping steps you shouldn’t? If you want to know, read my latest article The 4 Stages of Becoming A Millionaire Trader.

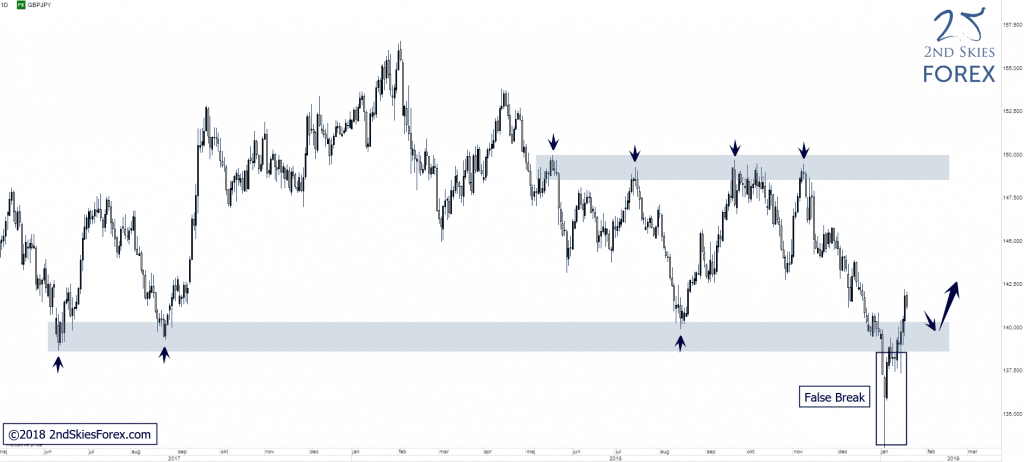
GBPJPY – Strong Rejection + False Break @ LT Support (Daily chart)

Price Action Context

After the flash crash in early January, bulls heavily rejected lower prices, resulting in a false break of two LT support zones (only upper one shown in chart). If bulls successfully can defend the closest LT support, a move higher towards 148.60 is likely IMO.

forex-gbpjpy-trade-setups-2ndskiesforex

Trending Analysis

Bias changed to neutral and bulls can look for potential trading locations on weak pullbacks into the LT key support.

Key Support & Resistance Zones

R: 148.60 – 150.00
S: 138.60 – 140.30

Stay tuned to the members market commentary for updates.

******

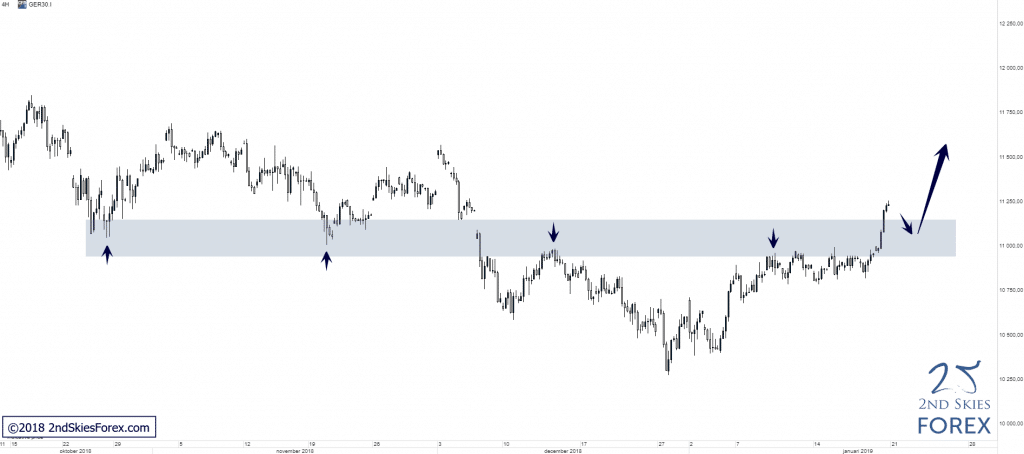
DAX – MT Trend Reversal, Broken Above MT Resistance (4h chart)

Price Action Context

After an initial CT impulsive move, followed by a corrective structure, which often is an early indication of a potential trend reversal, bulls ultimately managed to push through a key MT resistance zone on Friday, clearly closing above the zone ending the trading week.

dax-technical-analysis-2ndskiesforex

Trending Analysis

MT bias changes to bullish and ST/MT bulls can look out for possible trading opportunities on weak pullbacks into the S/R zone (now support).

Key Support & Resistance Zones

R: 11 700 – 11 950 [LT]
S: 10 950– 11 150

******

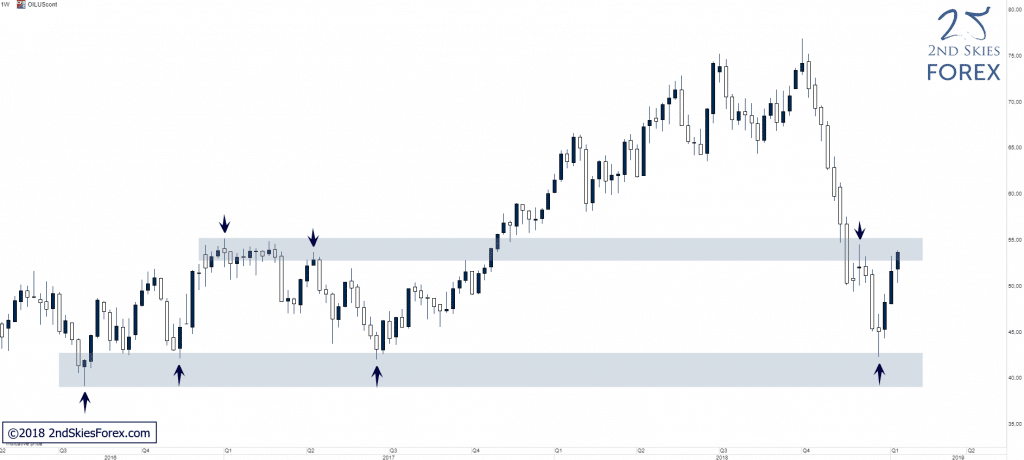
WTI – Strong Close @ LT Key Resistance (Weekly chart)

Price Action Context

Between early October and late December last year, WTI sold off roughly -40%, all the way to a major multi-year support level. The support produced a very strong rejection/bounce that has taken price all the way up to the closest key resistance with a very strong close right at the zone ending the trading week.

wti-oil-technical-analysis-2ndskiesforex

Trending Analysis

LT bias is bearish and if the resistance holds, a move down towards the key support is likely, whilst A failure of the resistance on the other hand would technically open up for a continuation towards 59.00.

Key Support & Resistance Zones

R: 53.20 – 55.20
S: 39.00 – 42.80


AxiTrader's Million Dollar Competition & Nial Fullers 71% Drawdown


UPDATE: Click here to see my analysis of Nial’s Fuller’s trades in the AxiTrader Million Dollar Trading Competition – it’s more shocking than I originally thought.

A former student of Nial Fuller who is now in my price action course asked me about Nial winning the AxiTrader competition.

Of course Nial Fuller talked about how he used “sophisticated money management strategies” and “wasn’t day trading“, but it turns out he lied – he was day trading, and was using horrible risk management.

With all things Nial Fuller, once you dig into the details, a completely different picture emerges from what he says.

So make sure to read this article about why Nial Fuller lied about his price action trading in the million dollar trading competition.

Now I’m not going to talk about the fact he and AxiTrader are business partners, or the fact AxiTrader actually allowed their business partners to join vs. pure clients. I’ll leave that to y’all to decide on.

But here is my summary of why Nial Fuller & AxiTrader represent everything bad about the trading industry below.

Only Nial Fuller would:

  1. Enter a trading competition with the absolute smallest acct possible (5k)
  2. Trade less than 10 times (by his own admission) for 6 weeks
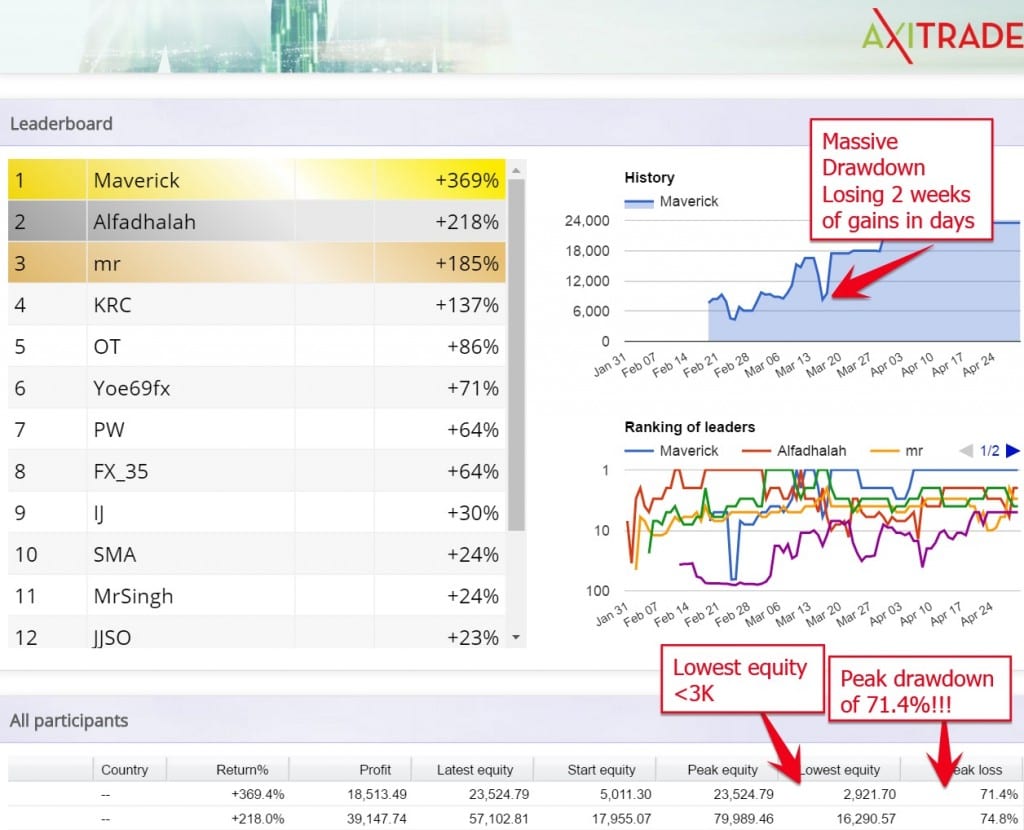
  3. Completely throw risk and money management out of the window by having a 71.4% drawdown over 3 days!
  4. Another 50+% drawdown over another 3 day period!
  5. Call his risk and money management system ‘sophisticated’ (see below)nial fuller gambling axitrader competition 2ndskiesforex
  6. Brag about it

And for proof, below is an image which shows you the details Nial forgot to mention about his heavy 71+% and 50+% drawdowns.

nial fuller massive drawdown axitrader competition 2ndskiesforex


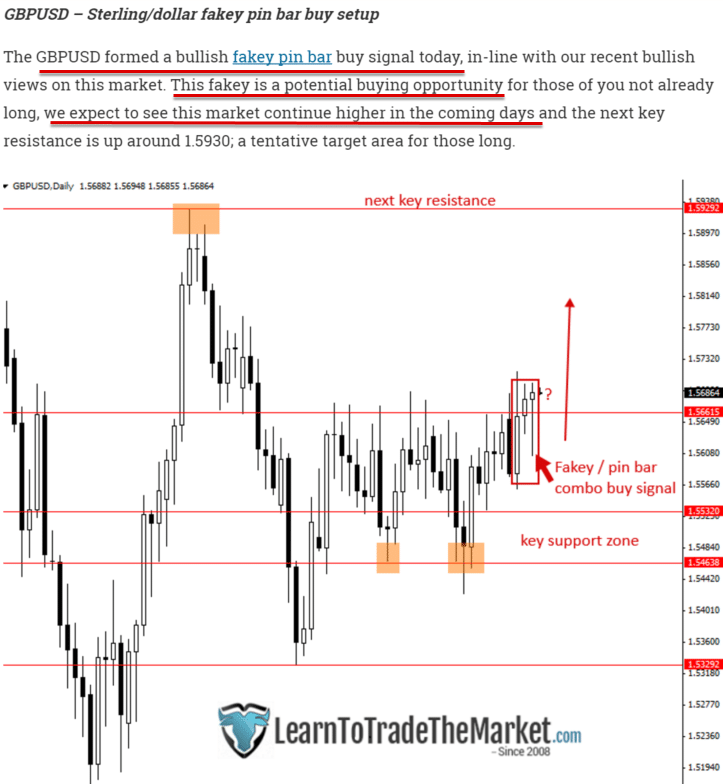
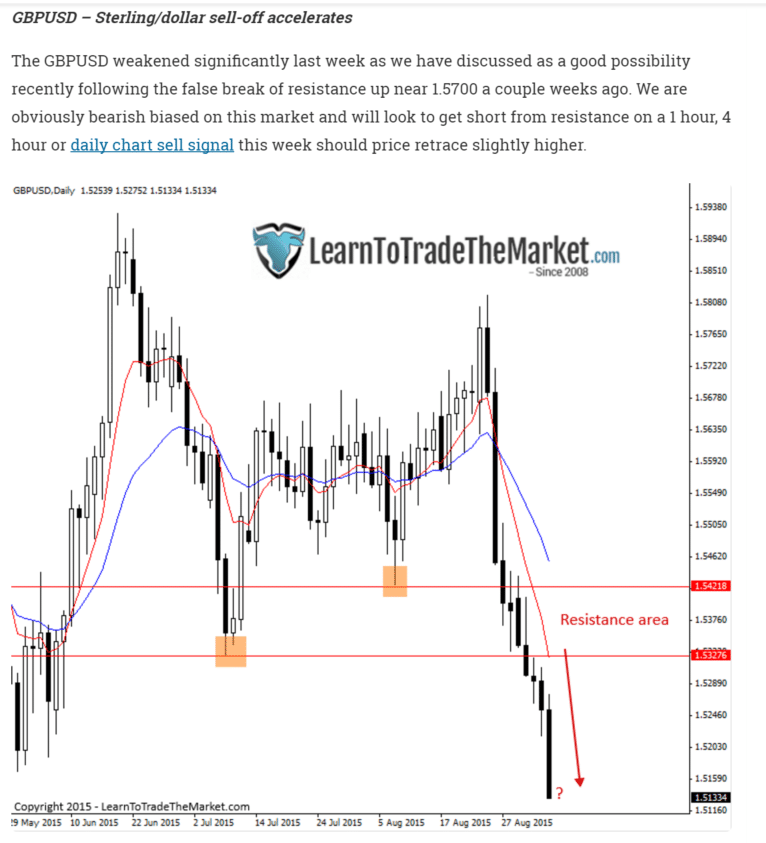
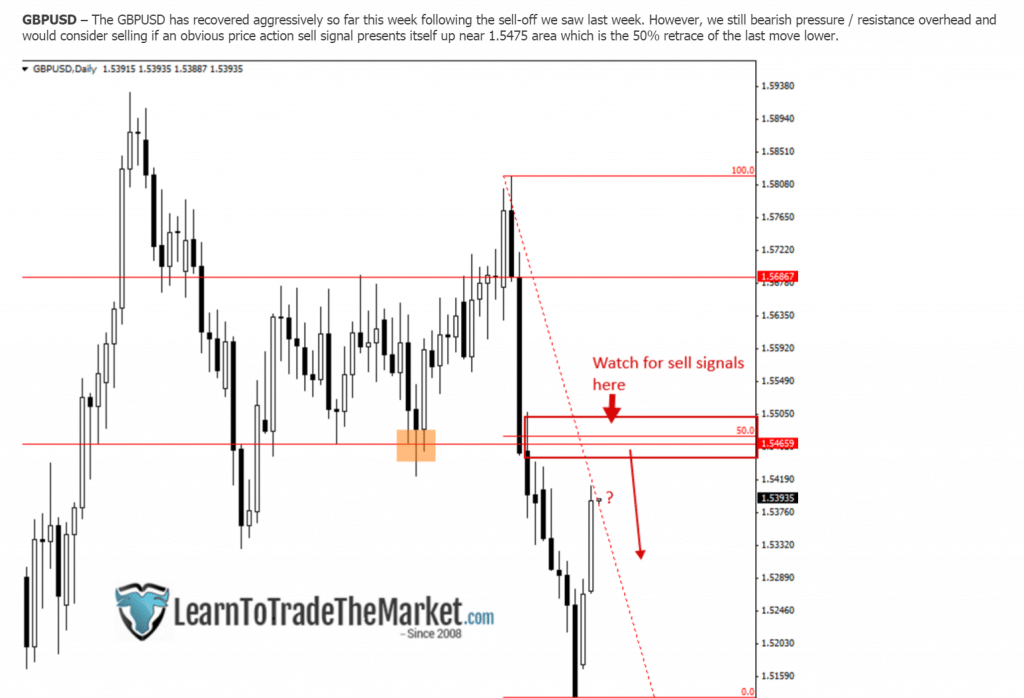
Keep in mind, this is the same guy who on Aug 20th, 2015 was bullish on the GBPUSD lauding his bullish fakey setup (commentary below).

nial fuller fakey setup fails 2ndskiesforex

Now make sure to remember the chart below & attached to this commentary.

nial fuller fakey pin bar trade fails 2ndskiesforex

Remember, this is a buy signal in line with his bullish views on the market.

Why am mentioning all this?

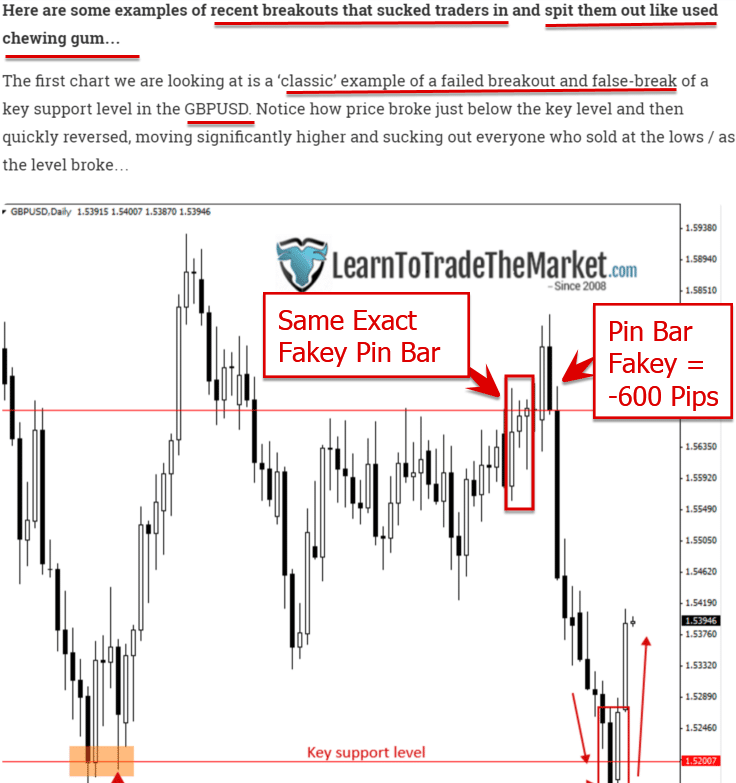
Because the same pin bar fakey setup Nial Fuller was lauding above, magically a few months later was a trade that Sucked Traders in and spit them out like used chewing gum (in his own words – see below).

nial fuller fakey pin bar loses 600 pips 2ndskiesforex

So which is it Nial?

Is this a great fakey pin bar trade that you were bullish on, or a ‘classic’ false break that ‘suckered traders’ (like yourself)?

And will you (ahem) Nial Fuller make some ‘editorial’ adjustments to your above article now that the hypocrisy is fully on display?

Inquiring minds want to know.

EDITORS NOTE (Jun 1 5.18pm EST)

After an editorial review, I realized I made a mistake. While Nial Fuller was bullish after the fakey pin bar combo that failed for 600 pips, the ‘false break that suckered traders in’ he was referring to was the break of the support level down below. My mistake and I apologize for the error.

BUT….

In a strange twist of irony, even when I’m wrong about Nial, I’m right. How so you say?

A look at this commentary of the false break that ‘suckered’ traders in ironically reveals the same thing. That he was ‘obviously bearish’ after the break of the key support level and looking to sell (see below – 3rd line).

nial bearish sept 7 commentary and looking to sell

To top this off with a cherry – after the market formed the famous false break, he was still bearish and would consider selling (see below as well).

nial fuller bearish after false break suckers traders in 2ndskiesforex

So different trade – same result. He’s bearish, but later, he wants to point out any of you that were short were ‘suckers’.

Regardless, this should give you a good idea about Nial Fuller.

Along the lines of marketers and all things bad for the industry, only AxiTrader would:

  1. Invest $1MM in someone who threw money and risk management out the window
  2. With a 5K acct
  3. Over 6 weeks and do < 10 trades
  4. Produced a 71.4% drawdown + a 50+% drawdown

and say ‘YES, I WANT TO INVEST $1MM IN THAT GUY.”

Brilliant!

Now ask yourself the following question:

Who is Nial trying to attract with this promotion?

Is he going after the veteran trader? Is he going after someone who’s had a few years of experience and knows what is a reasonable return on risk?

Or is he going after the newbie trader who will only see the % gain and dream of tripling their account? And what kind of clients are AxiTrader going after by promoting results and performances like this?

I’m guessing you can figure out the answer (newbie traders who wouldn’t see the difference).

nial fuller and axitrader marketing to newbies 2ndskiesforex

And this is why Nial Fuller and AxiTrader represent everything wrong with the industry. They talk about % gains, but fail to mention the risks it took to get said results.

In fact there was no mention of the risks or the downside. Only upside!  Those don’t make for the best marketing materials. Nor do they make the return seem so impressive now do they?

They certainly don’t speak of a ‘sophisticated’ risk management system. But you won’t hear that from Nial Fuller or AxiTrader. And that is why they are bad for the industry (IMO).

Nial Fuller & AxiTrader are targeting newbie traders in the hopes they will open up an account playing on the idea ‘you too can triple your acct’.

But one last question naturally arises, which is:

When does making less than 10 trades over a 6 week period represent anything about one’s skill set or ability?

To put this in perspective:

  • Would you understand a basketball player’s strengths and weaknesses over 10 shots sparsely taken over 6 weeks?
  • Would you know what kind of golfer someone was by watching them hit the golf ball less than 10 times over 6 weeks?
  • Would you feel comfortable putting $1MM behind a poker player whom has only played 10 hands over 6 weeks?

Let me know on which planet or universe you think this is a good idea. Yet this is what Nial Fuller & AxiTrader would want you to believe.

I know this article is controversial. I know it may irk some feathers. But I’m willing to bet many will cheer my sentiments/opinions on this as a key topic that has plagued the education industry.

Do you agree with what I’ve said above or not? If so, why not?

I’ll look forward to your comments below.

Key Talking Points:

  1. False Breaks Offer Great With Trend Trade Setups
  2. Trading the False Break with Pin Bars
  3. Trading the False Break with Engulfing Bars

In my prior article on trading the false break strategy part 1, I shared the basic definition of a false break, covered what is the price action and order flow behind false breaks, and how we can trade them.

In this false break forex trade strategy article, I will discuss how you can trade them using pin bars and engulfing bars, along with entry, SL and TP techniques.

To Recap What A False Break Is
I generally define a false break as one of the two following scenarios:

  1. A break above/below a prior candle that fails to close above/below that candle
  2. A break above/below a key level, quickly reversing that level, and sparking a counter-trend move

Below is another example of a false break:
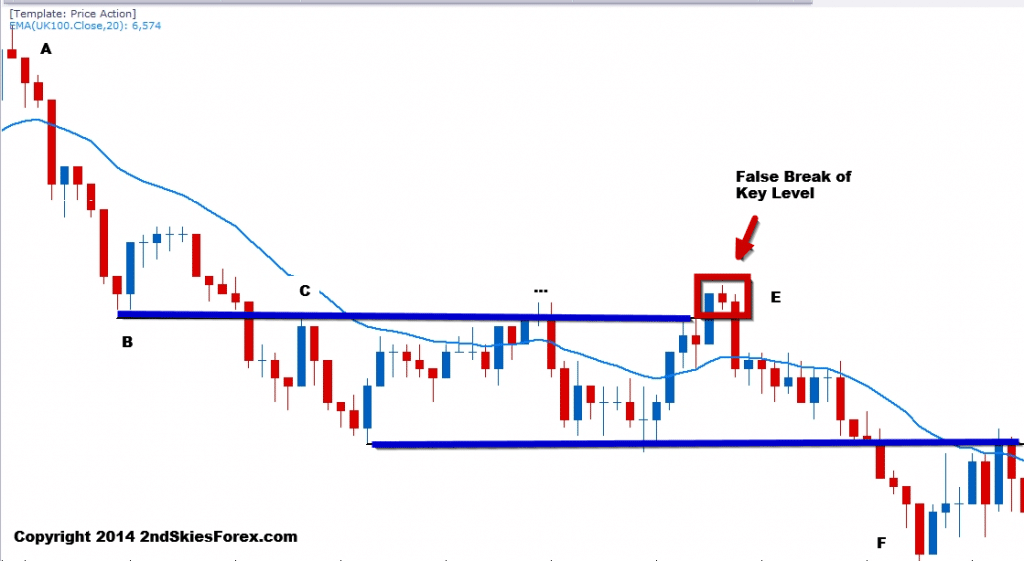
forex price action false break strategy 2ndskies c2

Looking at the chart above, we can see a clear downtrend, starting with A in the top left of the chart. The sell-off finds support at B, which eventually becomes a role reversal level at C.

Further along at E, we can see the textbook false break setup, just like we defined in the prior article. The pair breaks up above the key level CT (counter-trend), stalls, then sells off again breaking back below, and offering a great false break setup.

This sell off heads all the way down to F for a nicely profitable trade, and is a great example of a false break setup.

Now we will discuss how to trade the false break setup with a pin bar.

The Pin Bar + False Break Setup
Another type of false break setup is using the pin bar reversal pattern. In many ways, the pin bar by itself, can be a type of ‘false break’.

This is true if the body of the pin bar itself is housed within the prior bar. The breaking above/below the prior bar, and then closing back within that bar, is in and of itself, a type of false break.

What we are going to discuss is how we can use this to trade the false break strategy in combination with the pin bar.

A Pin Bar + False Break Example
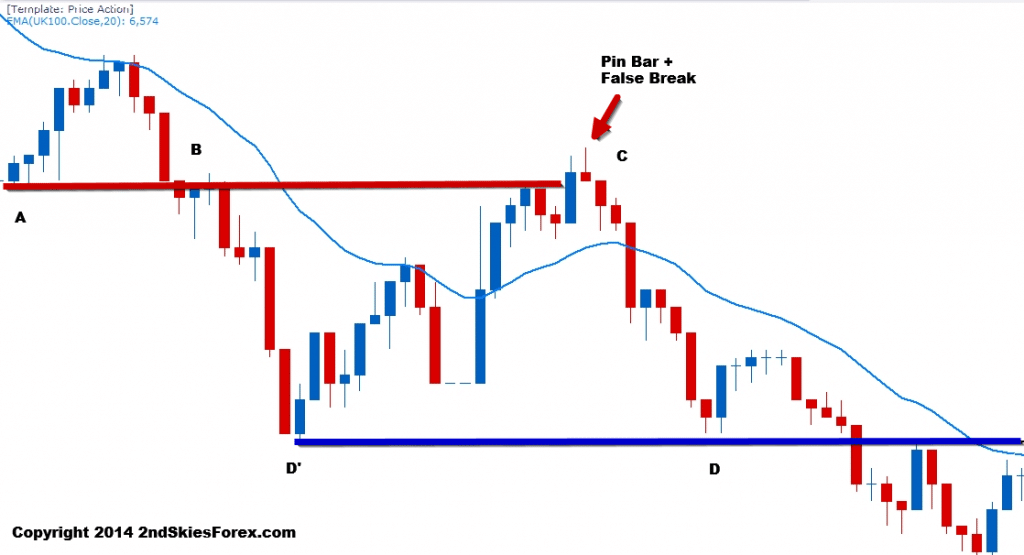
false break pin bar price action 2ndskiesforex c1

In this chart above, we can see at A (top left), there is a bullish move to the dynamic resistance (20 EMA). The sell off from the dynamic resistance to B only takes 3 bars, which means it was over 2.5x faster then the buying pressure at A.

From an order flow perspective, the sellers are stronger, since it took them less time to cover the same distance.

After breaking below the support level at B, the pair bounces at D’ towards C, (very same support level at A), hence a role reversal level.

Now notice at C how the pair briefly broke above A. If the buyers were really in control, they would have kept pushing prices. But the pin bar formed a false break above the highs of the blue bar (or prior bar).

This breaking above then back below, suggested a likely false break and more selling. The pair sold off from C to D, re-affirming the pin bar + false break setup.

NOTE: Observe how the support level at D and D’ formed another role reversal setup just after? This is a great example of trading with the trend.

Entry, Stop & Limit
If the pin bar represents a real false break, then the with trend direction should continue. Assuming I have read the price action context correctly, I generally like to enter using one of two methods:

  1. On a few pip break back below/above the key level
  2. On a pullback setup to the key level

The first entry method (more aggressive), can protect you from missing the move, as sometimes the false break never offers a second chance to enter.

For those wanting more ‘confirmation’, then I’d recommend the second entry method.

Now assuming the pin bar is the high/low in the move, I’ll put my stop just above/below the pin bar. For my take profit, if there is a prior level which caused the bounce/sell-off leading into the pin bar, then I’ll target that. One can use that as the only target, or as a first TP holding for a deeper move.

Trading the Engulfing Bar + False Break Setup
In reality, the engulfing bar + false break setup is not much different from the pin bar false break. I am still wanting to trade them with trend as much as possible, looking for a false break followed by an engulfing bar.

An Engulfing Bar + False Break Example
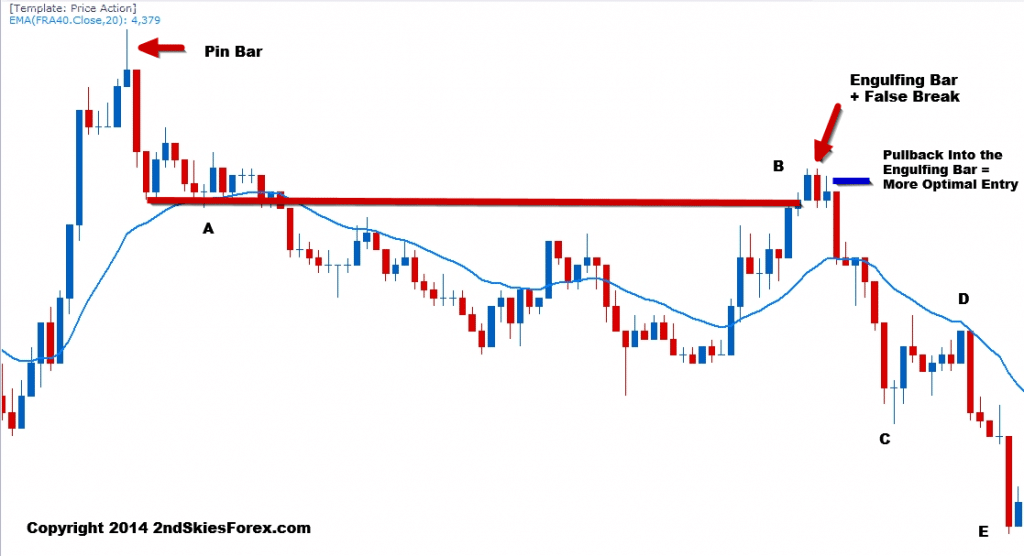
engulfing bar false break price action 2ndskiesforex c3

Turning to the chart above, we can see the strong selling stops at A. This forms a price action squeeze, which leads to a breakout and further selling.

The pair pulls back to B (the support level at A), and forms a false break. This is immediately followed by an engulfing bar.

Now ask yourself, if the bulls were truly in control, why did the price action immediately reverse after taking out A? This should have been a clue to watch for a false break.

You’ll notice right after the engulfing bar was an inverted pin bar. This is a failed attempt to rally, suggesting the buyers tried to push higher, but failed. What results is heavy selling from the open of the next bar down to C, and eventually E, resulting in a nice profit.

NOTE: Take a look at the move from C – D. This is a corrective pullback following an impulsive move. The corrective pullback went into the dynamic resistance (2o EMA), and then sold off heavily after.

This would have represented a great pullback setup, and is a good example of how impulsive and corrective moves manifest.

impulsive and corrective price action 2ndskiesforex
Entry, SL & TP
The entry, stop loss and take profit techniques are the same as the pin bar + false break. The only variation, would be if the engulfing bar closes back below/above the key level.

If it does, I’ll look to take a pullback into the engulfing bar, which is far more optimal entry as a whole. For more information on why the pullback is a more optimal entry for the engulfing bar, click here.

To Recap
In today’s false break forex trade strategy article, I talked about how false breaks offer great with trend setups. I then went into two more examples of the false break strategy, showing how you can trade them with pin bars and engulfing bars.

I shared entry, SL and TP techniques, along with explaining the price action and order flow behind these great setups.

These are just a few of the false break techniques available. If you want to learn more about trading the false break, along with other forex trading strategies, you can read more about my Price Action Course & Daily Members Commentary here.
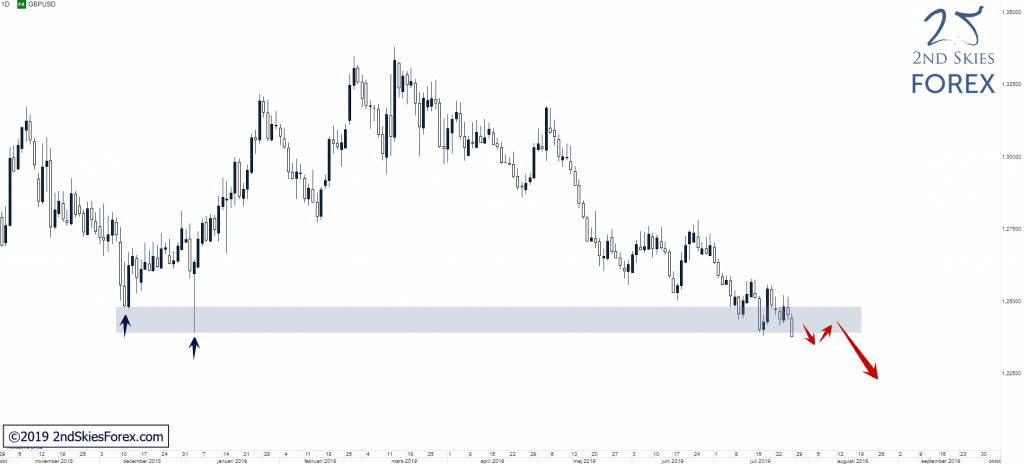
Recently I got a question from a newer student asking the following;
“Right now I’m short this pair. It’s in profit, but it just formed a pin bar against my trade before I hit my profit target. What should I do?”
This is a common question I get about what to do when you see a price action signal that is counter to your trade. The question by itself actually tells me a lot about the student and where they are at in their process (beginning, middle or more advanced).
My response was similar to the following;
“It is important to understand we are not pattern traders. We are price action traders. Being a pattern trader, as in trading pin bars, inside bars, engulfing bars, or fakey’s does not make us a price action trader.
Pin bars are not the death of trends. I can come up with about 50,000 examples of trends both intraday, or on the 4hr and daily time frames whereby the trends ran into a pin bar at a key level, then smashed right through it. I can also come up with thousands where they did the same and reversed.
‘Wait, but those were counter-trend pin bars, what about with trend pin bars?’ 
Same thing, I can come up with 50,000 of those that were with trend, and the market reversed the prevailing trend. I can also find you thousands that were with trend and worked out.
So what was the difference between the ones that did work out and ones that didn’t?
The key was the price action context around the pin bar. How the price action was leading up to the pin bar, and around it (the context of how the pin bar formed) is what will make that signals useful or not.”
This is why it is such a freshman idea and a complete fallacy to think all you need to trade successfully is 3 simple patterns (pin bars, engulfing bars, inside bars). All that + trading with trend at key levels and VOILA! You have your A+ setup and a profitable price action trade.
If it were only that simple (FYI – if it were, a lot more people would be profitable).
So how do you deal with a counter trend signal to your trade?
The answer is in reading the price action context around it. I will share four charts below to demonstrate the point clearly.
Exhibit A
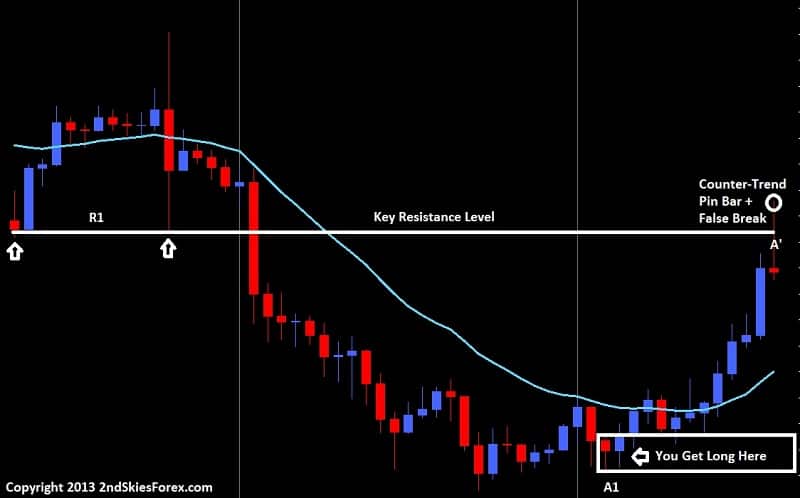
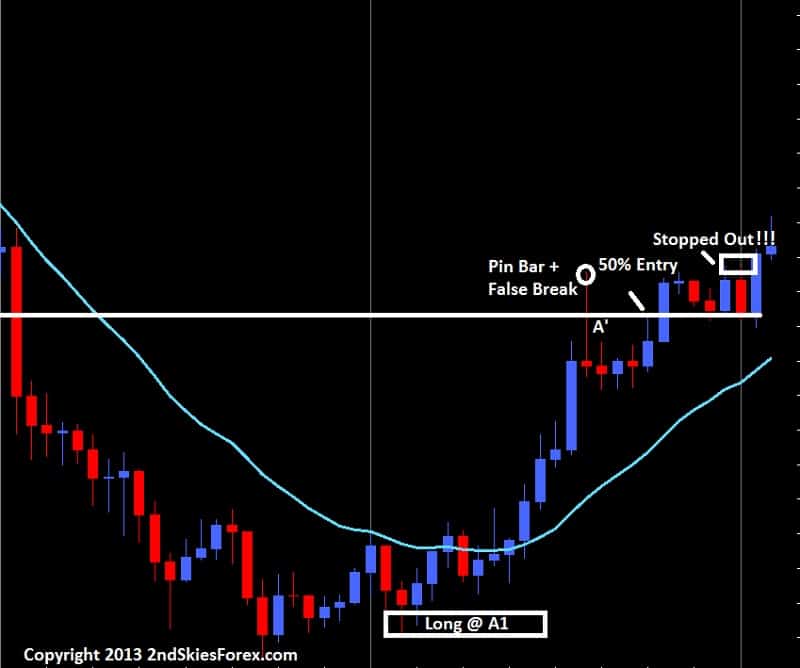
Looking at the chart below, we can see towards the left a double touch off the level R1, then a break through it with a large breakout bar. The market falls heavily and you look to get long around A1 on the bottom right of the chart. Your trade is working out great, but you run into a pin bar + false break (A1) at the key resistance level R1.
price action counter trend trade pin bar key level 2ndskiestrading.com
Minions of the 50% retrace entry on the pin bar are salivating because they think this is a great chance to short as you have a pin bar + false break at a key level, and the 50% retrace is at the level.
Meanwhile, you being long back at A1 see this pin bar and are worried about the market reversing thinking the move is over, so you exit.
Turns out both of you were wrong (see chart below)
pin bar 50 percent retrace entry failed price action context 2ndskiestrading.com
Exhibit B (later on in the same chart)
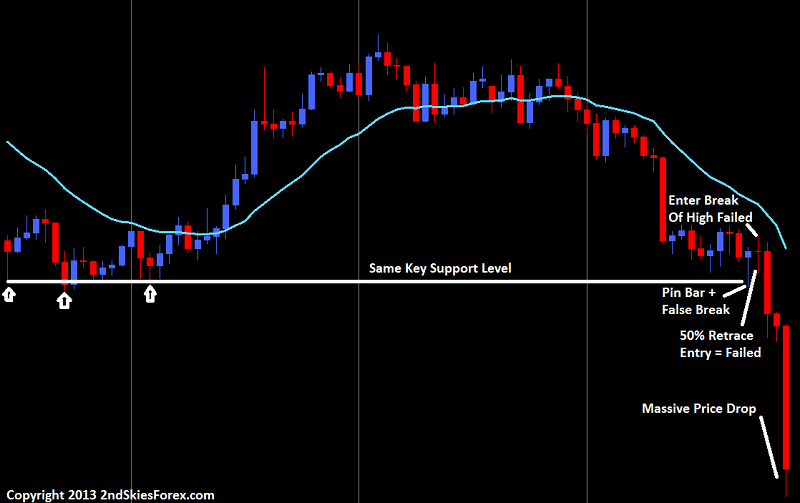
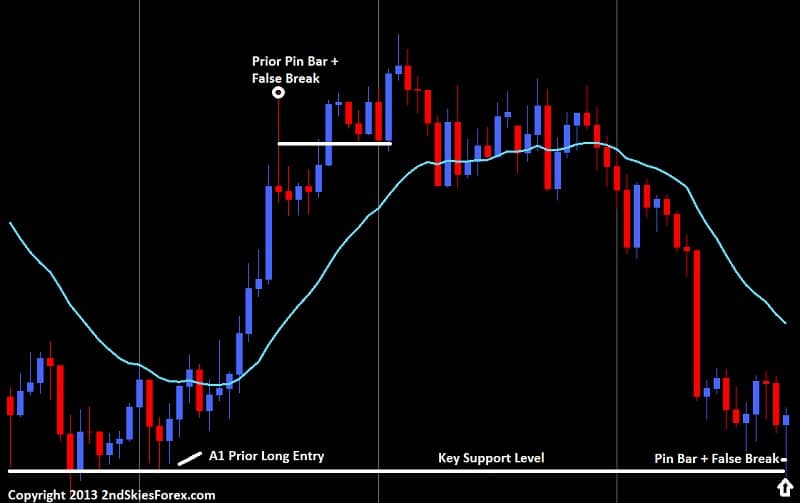
In this next chart below which is only a couple days later on the same pair, price eventually falls back to the same key level where we bought at A1 prior. It forms a consolidation just above it, then a pin bar + false break.
pin bar false break price action context 2ndskiestrading.com
Great! Time to get in on the 50% retrace entry yes as its at a key level. Or, the other option touted is to get long on a break of the pin bar high yes? Either way, this is an A+ setup right since the pair is in a range and formed a pin bar at a key level right?
See the next chart below
price action context pin bar entry fails 2ndskiestrading.com
Turns out both pin bar entries failed, even though it was at a key level while price action was in a range. Now imagine you were long around the top of this chart, and ran into this counter-trend pin bar signal at a key level. You probably would have taken profit.
But by not understanding the price action context around the level, you would have missed out on a ton of profit, almost double your profit leading up to that pin bar.
This is why its important to graduate beyond the freshman concepts of trading pin bars, inside bars, engulfing bars, fakey’s, or whatever price action patterns. If trading were that easy, as in trading with the trend + key levels + price action signal = profitable trading, then a lot more people would be making money.
The difference between knowing when to take those signals is in learning to read the context and order flow behind the price action. Pin bars are not the death of trends. Nor are the other patterns. In isolation, or even with trend analysis + key level analysis does not make it a good trade.
Thus my answer to this students question about what to do when you see a counter trend price action signal to your trade – my response is to understand the order flow and price action context around that signal. When you begin to do this, your trading will start to turn. You will find yourself winning more trades, and holding onto trades longer. And while others are buying this last pin bar – you are selling it, and you’ll understand why.