Now that I have outlined the major components to Ichimoku Time Theory (ichimoku numbers), I want to talk about the 2nd pillar of Ichimok which is the Wave Theory.
Remember, the main pillars of Ichimoku are not the Tenkan, Kijun, Chikou and Kumo. These are components of Ichimoku to help you read the main aspects of what is going on with the trend, support and resistance, and price action – all within a glance.
But…..these are NOT the pillars of Ichimoku. This led Hosada to state the following when he realized everyone was getting stuck believing the Tenkan, Kijun, Chikou and Kumo were all Ichimoku was about;
“Of the 10,000 or so people who are practicing and trading ichimoku, only about 10 really understand it.”
The 3 main pillars of Ichimoku are;
1) Ichimoku Time Theory
2) Ichimoku Wave Theory
3) Ichimoku Price Theory
I have discussed Ichimoku time theory which is the basis for all the other pillars and all of the ichimoku components you use when you look at any ichimoku chart. Now I would like to get into the 2nd pillar which is Ichimoku Wave Theory. I will get into the basic components or waves only as there are several types of waves (basic, mid-term, etc.) so to give an introduction without confusing anyone, I will write about the basic waves in today’s article.
3 Basic Waves
There are 3 basic waves which are the most important ones to learn because they are the basis of the ichimoku wave theory and will always be a part of your wave counts. They are;
1) I Wave
2) V Wave
3) N Wave
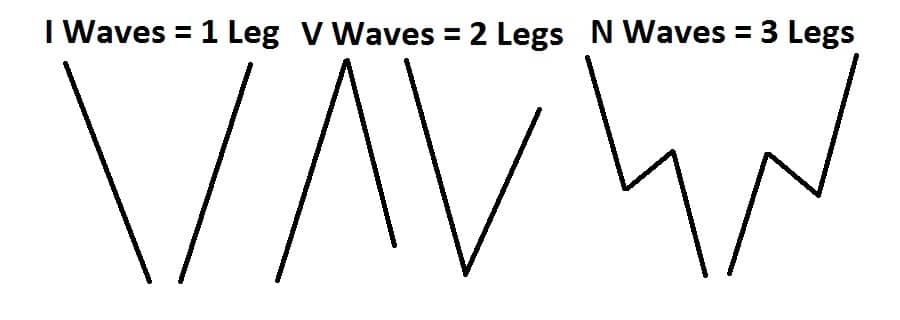
Ironically, an I Wave is 1 leg, a V Wave is 2 legs and a N Wave is 3 legs. Just like all the basic ichimoku numbers are building blocks for all the other numbers, it is the same with the waves. But let me show you a picture below to help give you a needed visual.

Looking at the image above, you can see how the one, two and three legs form the individual waves. I, V and N waves can all be up or down so that does not matter. Generally, I waves are impulsive price action moves, but they can be corrective. V waves are usually one impulsive and one corrective move, but can be two impulsive moves back to back. Whereas an N wave is usually an impulsive leg, followed by a corrective leg, and then another impulsive leg in the same direction as the original leg.
Being the most complex of the three, the N wave can have variations of this, but the first leg of the N wave should be impulsive with the other two having variations between them. Generally, most N waves will end with a higher high for an up wave, and a lower low on a down wave.
So the wave should end up lower or higher than where it started. If this is not the case, then it usually means a breakdown of the wave structure, but lets look at a few examples.

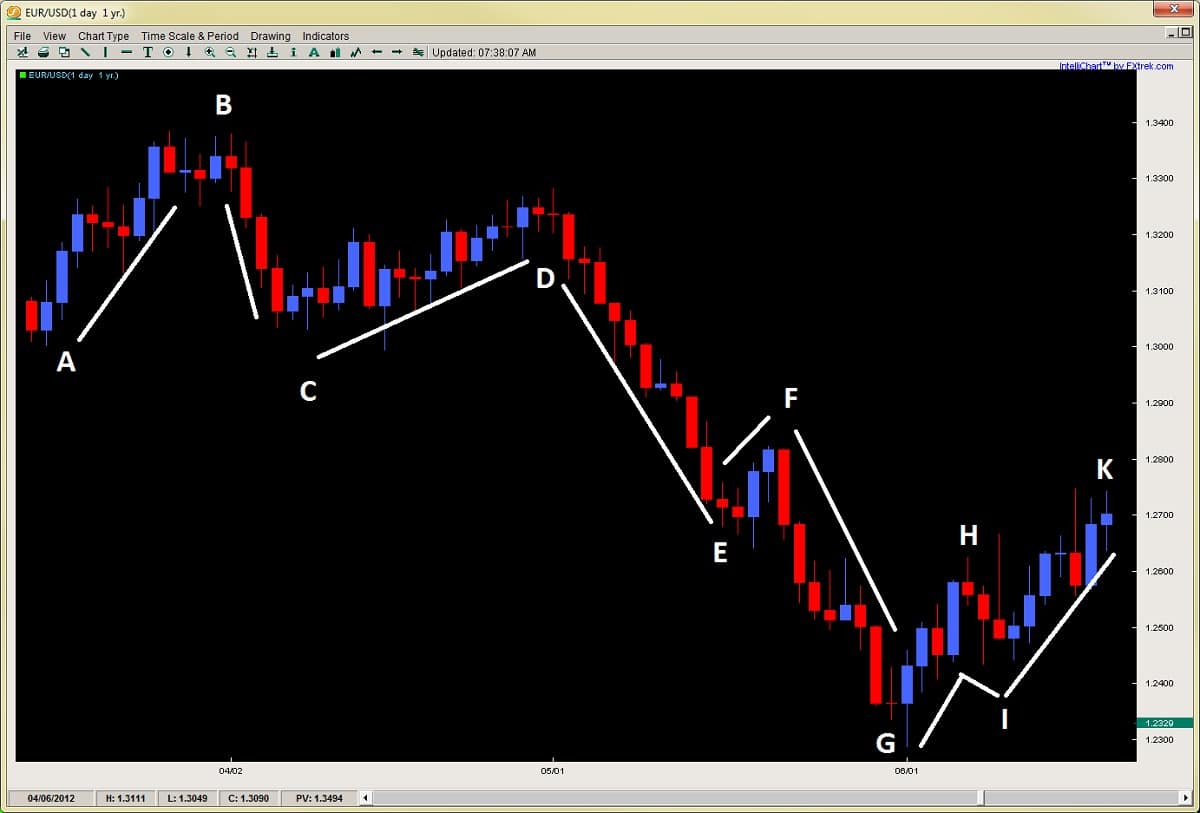
Using the chart above, I have labeled several lines, all of which individually are I Waves. As I said before, they all are components of each other, so a V Wave is really two I Waves put together, while an N Wave is either three I Waves, or one V Wave and one I Wave. But lets break this down in the chart above.
Starting at the top left of the chart, the first movement from A-B is an I Wave. Now by that token, the move from A-B-C is a downward V Wave. A-B-C-D would be therefore an N Wave, but also composed of two V waves (one up and one down). As a general rule, it’s better to look at the wave structure from a macro perspective then a micro one, so breaking say four N Waves up into 16 I waves is unnecessary. Look for the larger macro structure (gestalt) of the wave structure and you got the trick.
Now, as I stated, even though A-B-C-D is an N Wave, it doesn’t end with D being higher than B. When this happens, it generally means a range bound market at a minimum or a breakdown into a downward N wave, but rarely ever do these end up with higher prices above B, especially if C is breached.
Since this did happen, we actually have an downward N Wave starting at B-C-D-E. We can also count a downward N Wave from D-E-F-G. This brings me to the point that N Waves generally continue in their original direction until the ideal structure of the waves gets broken or disrupted. It also means N Waves can continue and parts or legs (ends) of them can start new N Waves in the same direction.
So if we were counting a new N Wave from F-G-H-I, since the wave structure is being disrupted, we would expect a likely reversal, and this is supported by the upward N Wave starting at G-H-I-K. This may seem like a lot, but this should give you some starting ideas of how to use these basic waves when reading an ichimoku cloud chart and will get easier with practice.
Usage in Trading
There are many ichimoku trading strategies we can use with these basic waves in trading, and if you were paying attention, I already gave away one idea. One example is how the wave structure generally performs (particularly N Waves). If the structure breaks down from its ideal formation, then watch for trend change – minimally a consolidation, but definitely not a trend continuation.
Another way this can be useful is if the number count (using ichimoku numbers) in a particular move is getting long, such as a two section, one period or a combined-6 move. These common turning points, combined with wave structure changes often bring a confluence of signals together which can mark major turning points in a move.
For example, in the chart above, the move from D-G is actually 1 day short of a one period move (a common turning point).
Additionally, you can combine forex price action strategies with these moves, especially reversal setups, so when you see (for example) pin bar setup happening at a major resistance, along with an N Wave structural change, this can increase the probability of a reversal.
Other ways to do this is if the V Wave is not a traditional impulsive move followed by a corrective move. For example, if it is an impulsive move followed by another one counter-direction, this could also be suggesting trend change or a range bound market, depending upon how it started the V Wave.
As you can see, there are many ways, too many to discuss here, but hopefully this gives you something to work with.
In Summary
Although there are other waves that we have not discussed, this is a good introduction and start to understanding Ichimoku Wave Theory and gives you the foundational theory to start practicing with the basic waves. But it is important to understand this is one of the key pillars underlying all of Ichimoku Kinko Hyo theory, so understanding the basic waves is a gate towards understanding ichimoku trading strategy as a whole.
Best is to practice forex wave theory by itself so you learn it as an individual component. Then after building some experience, combining it with ichimoku time theory. But hopefully for now, this gives you a nice introduction to Ichimoku Wave Theory as there is very little information about it available, nor discussed openly.
For those wanting to learn how to trade the Ichimoku Cloud, time, wave and price theory, along with lifetime access to the Ichimoku traders forum, discussing ichimoku setups using rule-based systems, make sure to visit my Advanced Ichimoku Course.
Tag Archive for: ichimoku course
For all those traders interested or currently trading Ichimoku, you will not want to miss this article.
Although I am heading out in a few hours with my girlfriend to Harbin Hot Springs, I wanted to write a brief introduction to Ichimoku Number Theory as there has been a lot of questions (and confusion) about Ichimoku settings, time frames, etc.
The basis of Ichimoku as known to most is the 5 lines;
- Tenkan Line
- Kijun Line
- Senkou Span A (part of the Kumo)
- Senkou Span B (other part of the Kumo)
- Chikou Line
Almost 95% of the commentary, traders, educators and understanding of the ichimoku kinko hyo view this as the basis of Ichimoku.
This is actually incorrect.
The basis of Ichimoku are the three pillars which are listed below;
- Ichimoku Number Theory (also has to do with time)
- Ichimoku Wave Theory
- Ichimoku Price Theory
These are the three pillars of Ichimoku, but the root of all them is based on the Ichimokunumber theory.
4.5yrs
Goichi Hosada (founder of Ichimoku) in his development of Ichimoku, spent 4.5yrs of his study just on number theory. He studied pretty much every Eastern and Western theory under the sun, and eventually settled upon 3 basis numbers that he not only made the basis of Ichimoku theory, but underlined all of reality.
NOTE: I have an interesting follow up story to tell about this so remind me to discuss it later.
The three numbers he made as the basis for Ichimoku were 9, 17 and 26.
So the idea that the reason why the Kijun was set to 26 periods had to do with the former 6 day Japanese trading week is false.
The kijun was set to this measurement, along with the tenkan – based on his findings.
What this means is, for those who are asking the question about should we adjust the settings since we are not working with a full trading week, or are trading an intraday time frame, is in effect answered. Regardless of the trading week or time frame, we are best served from an Ichimoku perspective keeping the original settings. So hopefully this puts that one to rest and the kabbash on all the alternative theories.
The 10 Numbers
Although there were 3 basic numbers which underlie the entire set of Ichimoku numbers, there were 10 in all. They are listed below;
9
17
26
*These three represent the basic or simple numbers
33
42
65
76
129
172
200-257
Now if you do a quick calculation, 9+17 = 26. 26+17 = 42+1. 33+9 = 42. 33×2 = 65+1. 42+33 = 76-1. 65×2 = 129+1. 129+42 = 172-1. So all these numbers are interrelated and all comprised of the basic numbers in some way.
There are names for these numbers like one section, two sections, one period, etc. which I will get into a later date, but the basic three names are;
one section (9)
two sections (17)
1 period (26)
So if you see me using this terminology in my future Ichimoku posts, you will know what I am talking about.
Use in Practice
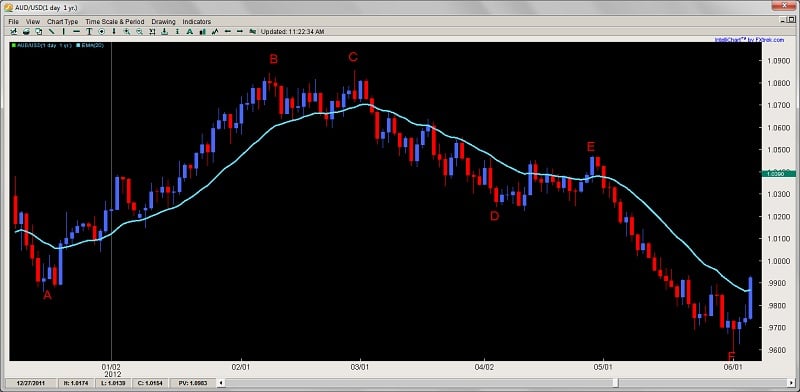
Ideally, Ichimoku number/time theory should be used in combination with the price and wave theories. So by itself, it is limited. But we can start the introduction with the basic concept. This is, the market is more likely to have a turning point or strong price action reaction around these numbers. They are not meant to be treated as fixed in stone numbers, but moreso higher probability turning or reaction points. An example of this is below;
AUDUSD Daily Chart

Now using the chart above, lets make some observations:
A-B = 41 (1 short of 42 bar move)
B-C = 16 (1 short of two section move/17)
C-D = 26 bars exactly or one period
D-E = 18 bars (1 short of two sections move)
E-F = 26 bars exactly or one period
Now this is just one chart and there will be many that are not so accurate upon first glance, and others that are. JPY pairs tend to move and respond more to the Ichimoku paramters and numbers since a great amount of Japanese traders are primarily trading Ichimoku strategies, and therefore are making trades based on it.
However, from my experience, this works on most pairs, commodities, and indices across the board, so quite potent and relevant. Keep in mind, it is important to understand we do not just apply the Ichimoku number/time theory in isolation, but mate it with Ichimoku price and wave theory. When combined, they become very highly predictive tools for catching major turning points, finding precise targets and determining future support and resistance levels, so powerful tools when yielded properly.
In Summary
Although this is just an introduction, I hope this gives you a better understanding of Ichimoku and how not to relate to it in just its basic form, but understand there is more going on than just the 5 lines. Anyone just teaching and professing the 5 lines as the be all end all of Ichimoku have very little understanding of it.
Goichi Hosada once said about this in the mid 80’s;
“Of the 10,000 or so people who are practicing and trading Ichimoku, only about 10 really understand it.”
Keep in mind, when he was saying it, he was including himself and his grandson, so not many. This is because people get too fascinated with the 5 lines and relate to that only without ever taking the time to understand what it is all about. Although the 5 lines are potent and informative by themselves, they are a small fraction of the Ichimoku picture and information contained in the Ichimokukinko hyo chart, so keep this in perspective.
I’ll be doing further introductory articles about these additional elements in the future over the next several months, but hopefully this sparks your curiosity and imagination for now.
For those wanting to learn how to trade the Ichimoku Cloud, Ichimoku time, Ichimoku price and Ichimoku wave theory, along with lifetime access to the Ichimoku traders forum, using rule-based systems, make sure to check out my Advanced Ichimoku Course.
This Ichimoku forex trading video is designed to provide an introduction to the Ichimoku Cloud, a popular Japanese trending indicator with high accuracy in all global markets. The video focuses on key elements that can enhance Kumo Break trades and show you how to spot them.
