Tag Archive for: ichimoku kinko hyo

What’s Inside?

  • What is Dynamic Support and Resistance?
  • How I can find Dynamic Support and Resistance in the forex market?
  • What is the Ichimoku Cloud?

In my last article, I talked about how forex traders can find the best key support and resistance levels. This is a critical component to understanding price action trading. But what is less talked about, yet critical for your trading is understanding and finding Dynamic Support and Resistance.

In this article, I’m going to help you understand what is the difference between ‘static‘ and ‘dynamic‘ support and resistance. From here I’m going to talk about why you need to understand dynamic support and resistance, along with give you two methods for identifying and trading dynamic support and resistance.
static and dynamic support and resistance

What is the difference between static and dynamic support and resistance?

When we talked about key support and resistance levels in our last article, you should have noticed a pattern. You should have noticed all those levels were ‘horizontal‘. While many key support and resistance levels are horizontal, many of them are ‘evolving‘, which means they are ‘dynamic‘. Dynamic support and resistance levels, or areas, where the market can pull back into and find support w/o needing to be at a horizontal support or resistance level.

This happens because:

1) The market is evolving, and sometimes buying/selling interest changes in a way that isn’t at pre-designed levels

2) Momentum in trends is dynamic, along with the order flow

Momentum can often be the underlying energy behind trends or movements (kind of like running downhill).

There are other reasons, but the key point is that you get the underlying idea, and can integrate this ‘conceptual knowledge‘ into your trading. We’ll get to this later in the article.

But to summarize:

a) Static support or resistance levels aren’t moving, and are horizontal in nature

b) Dynamic support or resistance levels are moving, and are not horizontal in nature

Now that we know what dynamic support and resistance is, we can move onto the next section.

How I can find dynamic support and resistance in the forex market (or any market for that matter)?

There are many methods to find dynamic s/r, but we’ll talk about two that I prefer to use.

Dynamic Support and Resistance Strategy #1: The 20 EMA

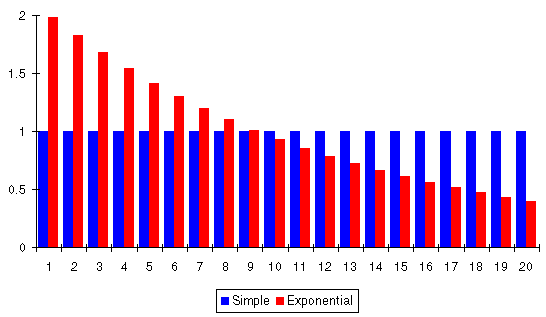
The 20 EMA is one of my favorite choices for discovering dynamic support and resistance as it does a really good job of being ‘balanced‘. What do I mean by being ‘balanced’? So the 20 EMA (exponential moving average) tracks the last closing prices of the candles for the last 20 periods. It gives more weight to the most recent closes (hence why it’s exponential), with less as you go through the series of 20 candles.

Below is a good graphic of how it differs from a ‘simple’ moving average which weighs the data the same regardless of time.
exponential moving average vs simple 2ndskiesforex

EMA’s (exponential moving averages) are balanced (IMO) because it does a great job of detecting the more recent momentum and changes in the price action, while at the same time taking into account some of the longer term movements in the price action, so well placed in between those two forces (hence ‘balanced’).

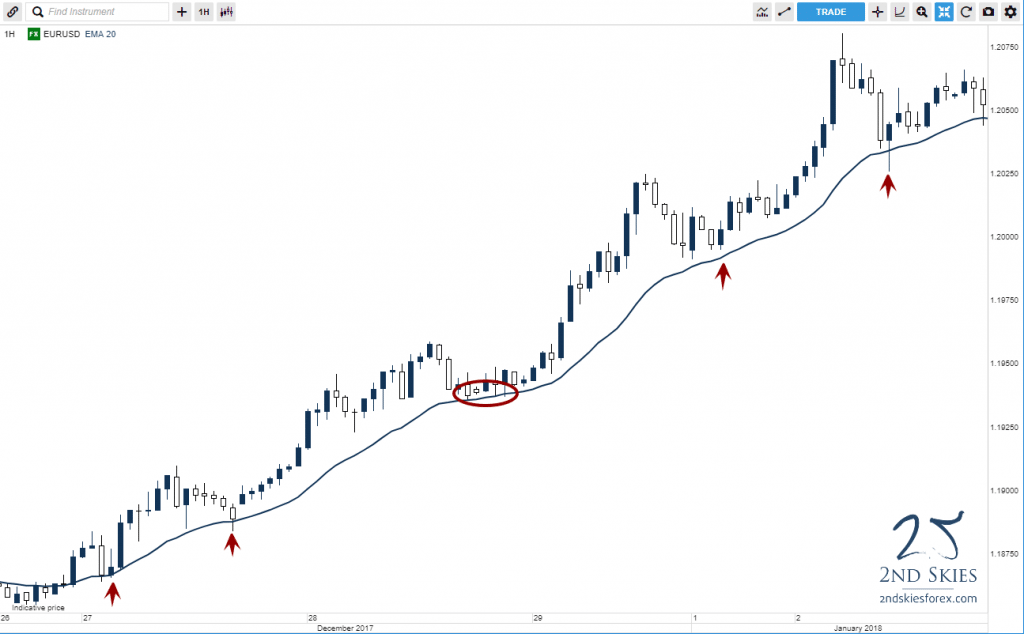
Below is a 1hr chart on the EURUSD showing the 20 EMA and how the price action related to it.
dynamic support and resistance forex market 2ndskiesforex

Notice how the price action touched the 20 EMA several times (navy line) which could have offered you great trade setups to get into the market with trend?

Another example is below on the S&P 500 on the 4hr chart.
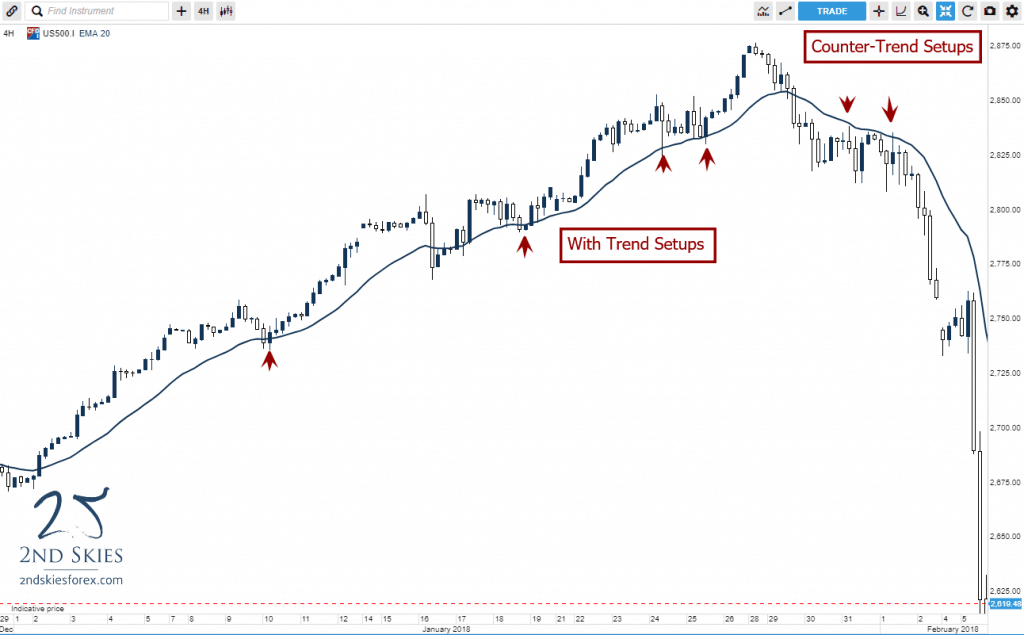
s&p 500 dynamic support and resistance 2ndskiesforex

In this chart of the S&P 500, you can see how the 20 EMA offered some great trade setups both with trend, and counter-trend as the market reversed.

It’s important to note the 20 EMA can act as a solid method for finding dynamic support and resistance on any time frame.

Dynamic Support and Resistance Method #2: The Ichimoku Cloud

In the first 3 years of my trading, I spent the majority of my time learning, studying and trading two strategies:

#1 price action

#2 the ichimoku cloud

If you want to learn about how I trade price action, click here to watch

However for now I’d like to talk about the ichimoku cloud (called ‘ichimoku kinko hyo’) roughly translates from japanese to ‘one glance balanced chart‘. It was created by Goichi Hosada many decades ago. It is one of the most commonly used methods for analysis and trading strategies in Japan, and there are many great ichimoku traders who were considered some of the best analysts of their time (i.e. Hidenobu Sasaki).
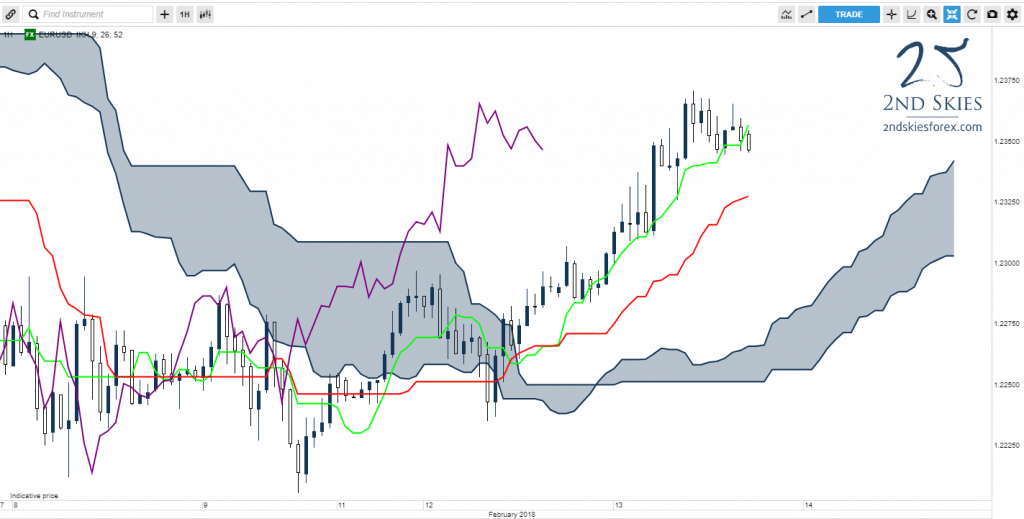
ichimoku cloud 2ndskiesforex

To briefly sum up the ichimoku cloud, the goal of this approch is to communicate in one shot (or ‘glance’) the following:

1) what is the trend in the market

2) what is the underlying momentum (or lack thereof)

3) what are future key support and resistance levels

You read that last part right (“future”). One of the primary goals of the ichimoku cloud is to give you an idea where future support and resistance levels will be (and how much there is).

I’m not going to do a whole lesson on the ichimoku cloud. If you want to learn more about the ichimoku cloud and how it’s constructed, click here.

But for our purposes, just understand that the ichimoku cloud measures a) momentum {a form of dynamic support or resistance}, and b) future support and resistance levels.

Below is a chart to show you how this works.
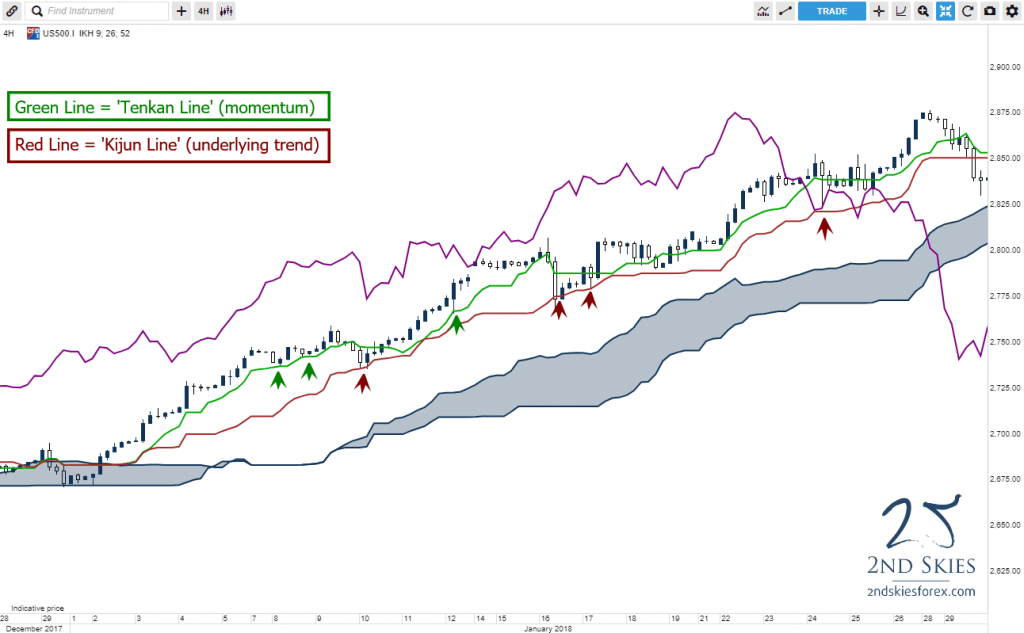
ichimoku dynamic support and resistance 2ndskiesforex

In the above S&P 500 ichimoku cloud chart on the 4hr time frame. There are several ways the ichimoku kinko hyo can act as ‘dynamic’ support or resistance. But for our purposes, in this uptrend, notice how the Tenkan Line (green line) did a good job acting as support on minor pullbacks.

The tenkan line does this well because it’s meant to track the underlying momentum in the price action. If the trend is strong, and has good momentum, the tenkan can often act as support or resistance. If momentum is weak, you’ll see this in the tenkan line by price crossing it more frequently, and not respecting it. This should tell you momentum is ‘weak’ or ‘weakening’ (depending upon the ichimoku context).

You’ll also notice the kijun line (red line) which is supposed to track the underlying trend in the price action. Notice how as price pulled back deeper in the uptrend, it stopped at the kijun several times, offering potential trade setups to get in this with trend.

There are many ways ichimoku is great for helping you find ‘dynamic’ support or resistance, but these are two good methods for now.

NOTE: If you want to learn more about the ichimoku cloud, click here for several free videos on learning more about the ichimoku cloud.

In Summary

While we spent a good amount of time recently talking about horizontal key support and resistance levels, today we’ve showed you how there is a different form of support and resistance which expresses itself as ‘dynamic‘.

We’ve also given you methods for finding dynamic support and resistance, along with showing you how the ichimoku cloud can provide an alternative (and useful) trading method.

Now one thing I forgot to ask is, have you ever looked at a chart and had a hard time finding key support and resistance levels?

Usually when I look at the price action on a chart, and I find it’s pulling back to areas where there doesn’t appear to be any support or resistance, I often try to see if the market is respecting ‘dynamic’ levels vs horizontal ones. Often times when I do this, the chart becomes more clear as this change in perspective gives me new trading opportunities I was missing before.

If you’d like to learn more about the ichimoku cloud, don’t forget to check out my ichimoku trading course. And if you want to learn more about forex dynamic support and resistance, take a look at my price action course.

Now Your Turn

Have you had this experience of not being able to find key dynamic or static support and resistance levels, or why the market pulled back to where it did? What did you learn about forex dynamic support and resistance levels from this article?

Make sure to leave your comments below, along with ask any questions you have on the subject. And don’t forget to tweet/like this article on your favorite social media so others can benefit from it.

Until then, I’ll look forward to hearing from you.

Now that I have outlined the major components to Ichimoku Time Theory (ichimoku numbers), I want to talk about the 2nd pillar of Ichimok which is the Wave Theory.
Remember, the main pillars of Ichimoku are not the Tenkan, Kijun, Chikou and Kumo.  These are components of Ichimoku to help you read the main aspects of what is going on with the trend, support and resistance, and price action – all within a glance.
But…..these are NOT the pillars of Ichimoku.  This led Hosada to state the following when he realized everyone was getting stuck believing the Tenkan, Kijun, Chikou and Kumo were all Ichimoku was about;
“Of the 10,000 or so people who are practicing and trading ichimoku, only about 10 really understand it.”
The 3 main pillars of Ichimoku are;
1) Ichimoku Time Theory
2) Ichimoku Wave Theory
3) Ichimoku Price Theory
I have discussed Ichimoku time theory which is the basis for all the other pillars and all of the ichimoku components you use when you look at any ichimoku chart.  Now I would like to get into the 2nd pillar which is Ichimoku Wave Theory.  I will get into the basic components or waves only as there are several types of waves (basic, mid-term, etc.) so to give an introduction without confusing anyone, I will write about the basic waves in today’s article.
3 Basic Waves
There are 3 basic waves which are the most important ones to learn because they are the basis of the ichimoku wave theory and will always be a part of your wave counts.  They are;
1)  I Wave
2) V Wave
3) N Wave
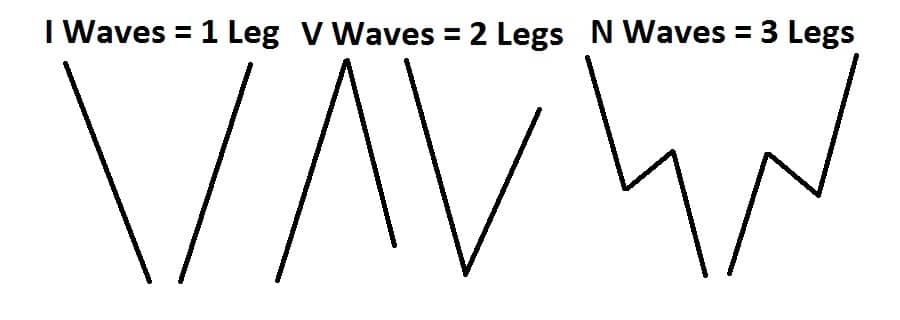
Ironically, an I Wave is 1 leg, a V Wave is 2 legs and a N Wave is 3 legs.  Just like all the basic ichimoku numbers are building blocks for all the other numbers, it is the same with the waves.  But let me show you a picture below to help give you a needed visual.
basic ichimoku waves ichimoku cloud chris capre 2ndskiestrading.com
Looking at the image above, you can see how the one, two and three legs form the individual waves.  I, V and N waves can all be up or down so that does not matter.  Generally, I waves are impulsive price action moves, but they can be corrective.  V waves are usually one impulsive and one corrective move, but can be two impulsive moves back to back.  Whereas an N wave is usually an impulsive leg, followed by a corrective leg, and then another impulsive leg in the same direction as the original leg.
Being the most complex of the three, the N wave can have variations of this, but the first leg of the N wave should be impulsive with the other two having variations between them.  Generally, most N waves will end with a higher high for an up wave, and a lower low on a down wave.
So the wave should end up lower or higher than where it started.  If this is not the case, then it usually means a breakdown of the wave structure, but lets look at a few examples.
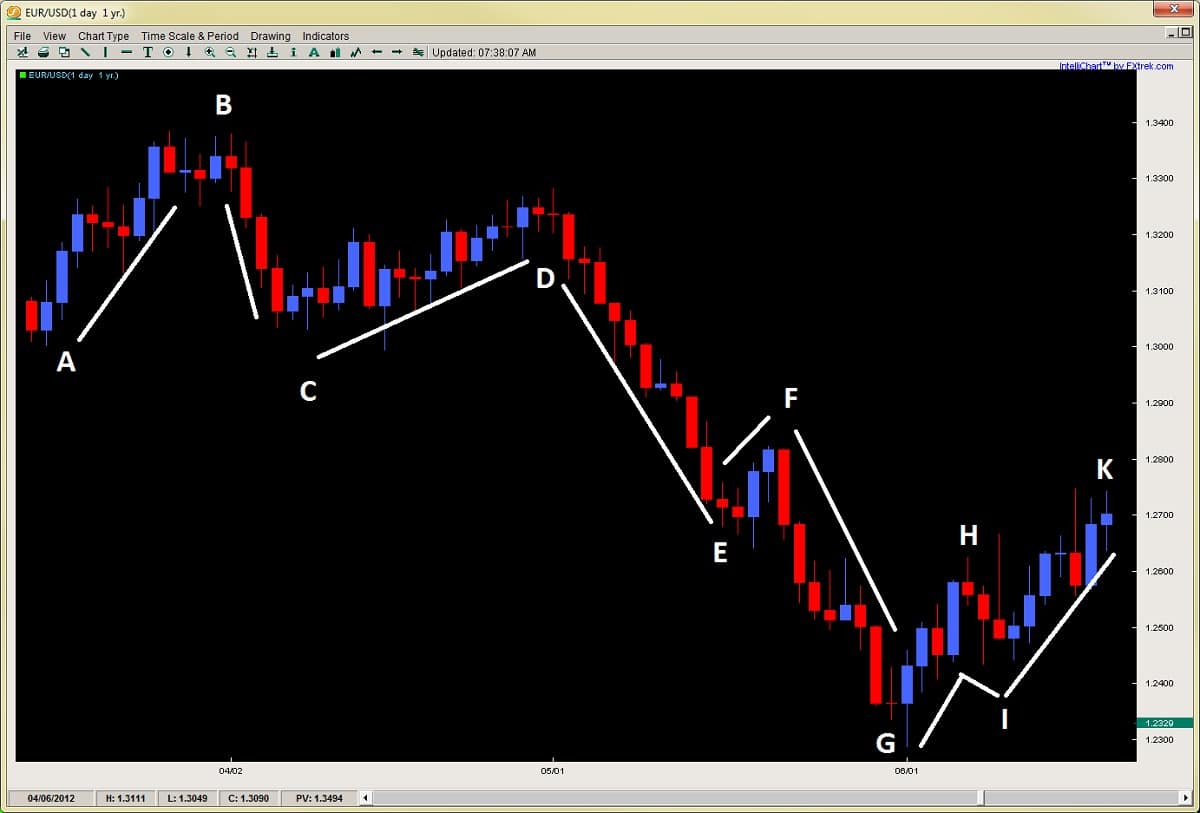
basic ichimoku wave examples chris capre ichimoku cloud 2ndskiestrading.com
Using the chart above, I have labeled several lines, all of which individually are I Waves.  As I said before, they all are components of each other, so a V Wave is really two I Waves put together, while an N Wave is either three I Waves, or one V Wave and one I Wave.  But lets break this down in the chart above.
Starting at the top left of the chart, the first movement from A-B is an I Wave.  Now by that token, the move from A-B-C is a downward V Wave.  A-B-C-D would be therefore an N Wave, but also composed of two V waves (one up and one down).  As a general rule, it’s better to look at the wave structure from a macro perspective then a micro one, so breaking say four N Waves up into 16 I waves is unnecessary.  Look for the larger macro structure (gestalt) of the wave structure and you got the trick.
Now, as I stated, even though A-B-C-D is an N Wave, it doesn’t end with D being higher than B.  When this happens, it generally means a range bound market at a minimum or a breakdown into a downward N wave, but rarely ever do these end up with higher prices above B, especially if C is breached.
Since this did happen, we actually have an downward N Wave starting at B-C-D-E.  We can also count a downward N Wave from D-E-F-G.  This brings me to the point that N Waves generally continue in their original direction until the ideal structure of the waves gets broken or disrupted.  It also means N Waves can continue and parts or legs (ends) of them can start new N Waves in the same direction.
So if we were counting a new N Wave from F-G-H-I, since the wave structure is being disrupted, we would expect a likely reversal, and this is supported by the upward N Wave starting at G-H-I-K.  This may seem like a lot, but this should give you some starting ideas of how to use these basic waves when reading an ichimoku cloud chart and will get easier with practice.
Usage in Trading
There are many ichimoku trading strategies we can use with these basic waves in trading, and if you were paying attention, I already gave away one idea.  One example is how the wave structure generally performs (particularly N Waves).  If the structure breaks down from its ideal formation, then watch for trend change – minimally a consolidation, but definitely not a trend continuation.
Another way this can be useful is if the number count (using ichimoku numbers) in a particular move is getting long, such as a two section, one period or a combined-6 move.  These common turning points, combined with wave structure changes often bring a confluence of signals together which can mark major turning points in a move.
For example, in the chart above, the move from D-G is actually 1 day short of a one period move (a common turning point).
Additionally, you can combine forex price action strategies with these moves, especially reversal setups, so when you see (for example) pin bar setup happening at a major resistance, along with an N Wave structural change, this can increase the probability of a reversal.
Other ways to do this is if the V Wave is not a traditional impulsive move followed by a corrective move.  For example, if it is an impulsive move followed by another one counter-direction, this could also be suggesting trend change or a range bound market, depending upon how it started the V Wave.
As you can see, there are many ways, too many to discuss here, but hopefully this gives you something to work with.
In Summary
Although there are other waves that we have not discussed, this is a good introduction and start to understanding Ichimoku Wave Theory and gives you the foundational theory to start practicing with the basic waves.  But it is important to understand this is one of the key pillars underlying all of Ichimoku Kinko Hyo theory, so understanding the basic waves is a gate towards understanding ichimoku trading strategy as a whole.
Best is to practice forex wave theory by itself so you learn it as an individual component.  Then after building some experience, combining it with ichimoku time theory.  But hopefully for now, this gives you a nice introduction to Ichimoku Wave Theory as there is very little information about it available, nor discussed openly.
For those wanting to learn how to trade the Ichimoku Cloud, time, wave and price theory, along with lifetime access to the Ichimoku traders forum, discussing ichimoku setups using rule-based systems, make sure to visit my Advanced Ichimoku Course.

For all those traders interested or currently trading Ichimoku, you will not want to miss this article.

Although I am heading out in a few hours with my girlfriend to Harbin Hot Springs, I wanted to write a brief introduction to Ichimoku Number Theory as there has been a lot of questions (and confusion) about Ichimoku settings, time frames, etc.

The basis of Ichimoku as known to most is the 5 lines;

  1. Tenkan Line
  2. Kijun Line
  3. Senkou Span A (part of the Kumo)
  4. Senkou Span B (other part of the Kumo)
  5. Chikou Line

Almost 95% of the commentary, traders, educators and understanding of the ichimoku kinko hyo view this as the basis of Ichimoku.

This is actually incorrect.

The basis of Ichimoku are the three pillars which are listed below;

  1. Ichimoku Number Theory (also has to do with time)
  2. Ichimoku Wave Theory
  3. Ichimoku Price Theory

These are the three pillars of Ichimoku, but the root of all them is based on the Ichimokunumber theory.

4.5yrs

Goichi Hosada (founder of Ichimoku)  in his development of Ichimoku, spent 4.5yrs of his study just on number theory.  He studied pretty much every Eastern and Western theory under the sun, and eventually settled upon 3 basis numbers that he not only made the basis of Ichimoku theory, but underlined all of reality.

NOTE: I have an interesting follow up story to tell about this so remind me to discuss it later.

The three numbers he made as the basis for Ichimoku were 9, 17 and 26.

So the idea that the reason why the Kijun was set to 26 periods had to do with the former 6 day Japanese trading week is false.
The kijun was set to this measurement, along with the tenkan – based on his findings.

What this means is, for those who are asking the question about should we adjust the settings since we are not working with a full trading week, or are trading an intraday time frame, is in effect answered. Regardless of the trading week or time frame, we are best served from an Ichimoku perspective keeping the original settings.  So hopefully this puts that one to rest and the kabbash on all the alternative theories.

The 10 Numbers
Although there were 3 basic numbers which underlie the entire set of Ichimoku numbers, there were 10 in all.  They are listed below;
9
17
26
*These three represent the basic or simple numbers
33
42
65
76
129
172
200-257 
Now if you do a quick calculation, 9+17 = 26.  26+17 = 42+1.  33+9 = 42.  33×2 = 65+1. 42+33 = 76-1. 65×2 = 129+1. 129+42 = 172-1.  So all these numbers are interrelated and all comprised of the basic numbers in some way.

There are names for these numbers like one section, two sections, one period, etc. which I will get into a later date, but the basic three names are;
one section (9)
two sections (17)
1 period (26)
So if you see me using this terminology in my future Ichimoku posts, you will know what I am talking about.

Use in Practice

Ideally, Ichimoku number/time theory should be used in combination with the price and wave theories.  So by itself, it is limited.  But we can start the introduction with the basic concept.  This is, the market is more likely to have a turning point or strong price action reaction around these numbers.  They are not meant to be treated as fixed in stone numbers, but moreso higher probability turning or reaction points.  An example of this is below;

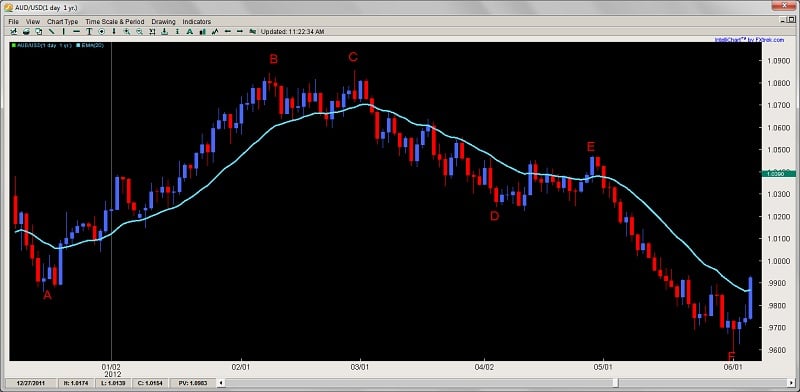
AUDUSD Daily Chart
ichimoku number theory ichimoku trading 2ndskiestrading.com july 26th
Now using the chart above, lets make some observations:
A-B = 41 (1 short of 42 bar move)
B-C = 16 (1 short of two section move/17)
C-D = 26 bars exactly or one period
D-E = 18 bars (1 short of two sections move)
E-F = 26 bars exactly or one period

Now this is just one chart and there will be many that are not so accurate upon first glance, and others that are.  JPY pairs tend to move and respond more to the Ichimoku paramters and numbers since a great amount of Japanese traders are primarily trading Ichimoku strategies, and therefore are making trades based on it.

However, from my experience, this works on most pairs, commodities, and indices across the board, so quite potent and relevant.  Keep in mind, it is important to understand we do not just apply the Ichimoku number/time theory in isolation, but mate it with Ichimoku price and wave theory.  When combined, they become very highly predictive tools for catching major turning points, finding precise targets and determining future support and resistance levels, so powerful tools when yielded properly.

In Summary

Although this is just an introduction, I hope this gives you a better understanding of Ichimoku and how not to relate to it in just its basic form, but understand there is more going on than just the 5 lines.  Anyone just teaching and professing the 5 lines as the be all end all of Ichimoku have very little understanding of it.

Goichi Hosada once said about this in the mid 80’s;

“Of the 10,000 or so people who are practicing and trading Ichimoku, only about 10 really understand it.”

Keep in mind, when he was saying it, he was including himself and his grandson, so not many.  This is because people get too fascinated with the 5 lines and relate to that only without ever taking the time to understand what it is all about.  Although the 5 lines are potent and informative by themselves, they are a small fraction of the Ichimoku picture and information contained in the Ichimokukinko hyo chart, so keep this in perspective.

I’ll be doing further introductory articles about these additional elements in the future over the next several months, but hopefully this sparks your curiosity and imagination for now.

For those wanting to learn how to trade the Ichimoku Cloud, Ichimoku time, Ichimoku price and Ichimoku wave theory, along with lifetime access to the Ichimoku traders forum, using rule-based systems, make sure to check out my Advanced Ichimoku Course.

This Ichimoku forex trading video is designed to provide an introduction to the Ichimoku Cloud, a popular Japanese trending indicator with high accuracy in all global markets. The video focuses on key elements that can enhance Kumo Break trades and show you how to spot them.

This video focuses on some key elements which can enhance Kumo Break trades and how to spot them.

Introduction

Still growing amongst the Western and European traders, the Ichimoku Cloud (or Ichimoku Kinko Hyo = One Glance Balance Cloud Chart) was originally developed pre-WWII by a man named Goichi Hosada.  Because of the war, his research was halted and then later finished in 1968 whereby he published a 1,000 page, 4 volume body of work releasing the Ichimoku Cloud to the world under the pen-name Ichimoku Sanjin.

Originally built for the Japanese stock markets, the Ichimoku cloud indicator has made its way out of the land of the Eastern sun and into the trading world at large, being applied and used widely in the Commodities, Futures, Options and Forex markets. Part of the Ichimoku Cloud trading system’s success is its ability to find trends and reversals well before they begin.


The Indicator

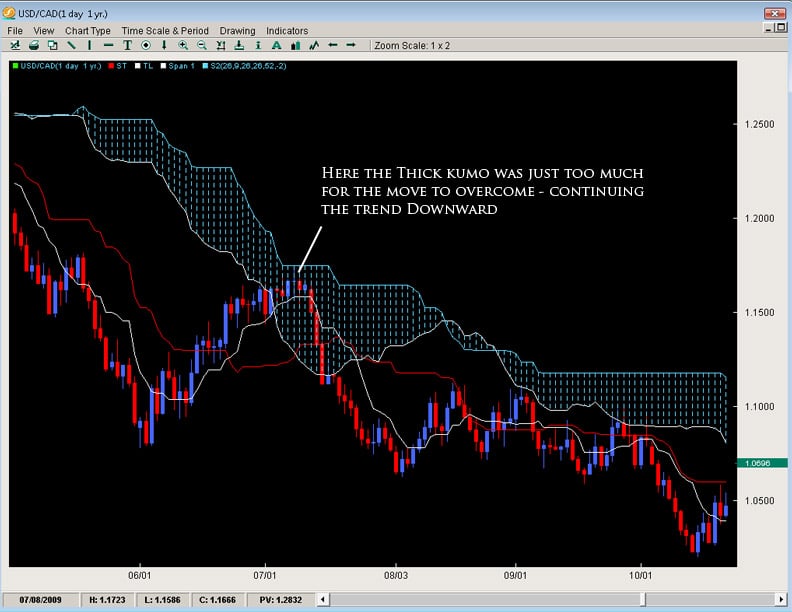
The Ichimoku Cloud has several components which give it a lot of versatility and uses.  The most unique aspect of the indicator is its ‘Kumo’ or cloud which offers a unique perspective of support and resistance.  Most western methods look at support and resistance in a linear fashion or as straight lines in the sand (e.g. Fibonacci, Pivots, Channel Lines, Trend Lines).  However the Kumo or cloud is an ever evolving object which was designed to represent support and resistance based upon price action.  Generally, when you are in a strong upward trend, the support is strong as the price levels below have been accepted.  The same goes for a strong downtrend and having more layers of resistance.  Below are two examples of up and downtrends – showing how the Kumo was quite thick in nature.

ichimoku-cloud

ichimoku-cloud2

The most important way to look at the Kumo is as support and resistance – meaning if it is thick, then the support/resistance (depending upon where price is in relationship to the cloud) is strong.  If price is above the Kumo, we are in a general uptrend or would want to look for more buying opportunities.  If price is below the cloud, it is below resistance (the Kumo) and we want to be searching for more shorts than longs.  The longer price stays below/above the cloud, the stronger the trend we are in and the more support/resistance the Kumo will offer.


Kumo Composition

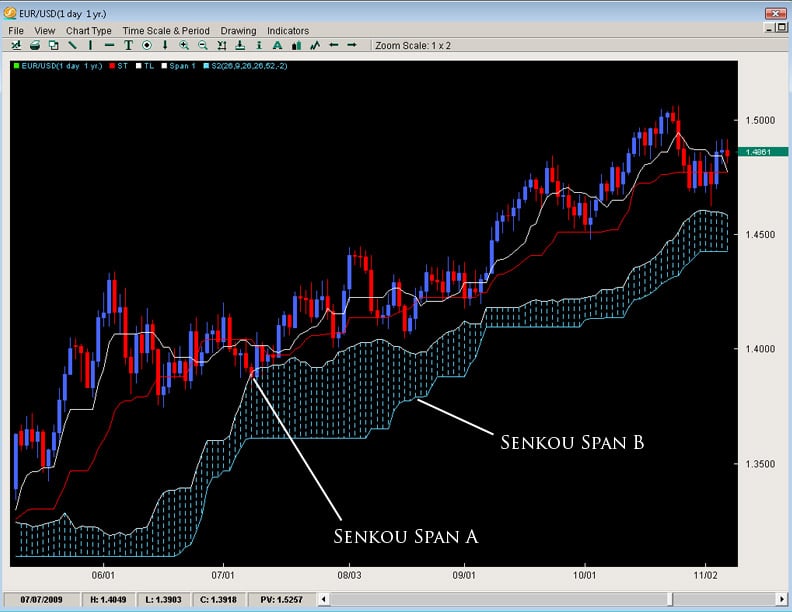
There are two main lines of the Kumo which are referred to as Senkou Span A and Senkou Span B.  For the purposes of efficiency, we will refer to them as Span A and Span B.  The space or value in between these two lines is what forms the Kumo.

Span A is formed by taking the Tenkan Line and adding it to the Kijun Line (white and red lines respectively from chart above), then dividing that value by 2 and plotting it 26 periods ahead.  The formula is;

(Tenkan Line + Kijun Line) / 2 placed 26 periods ahead

Span B is formed by taking the highest high (over the last 52 periods), adding to it the lowest low (over the last 52 periods), dividing that by 2 and plotting that 26 time periods ahead.  The formula is;

(Highest High + Lowest Low for the last 52 periods) / 2 and plotted 26 time periods ahead.

kumo-chart-1

We will talk about some important points regarding the construction of the Kumo later.


Other Ichimoku Components

(Tenkan, Kijun and Chikou Span Lines)

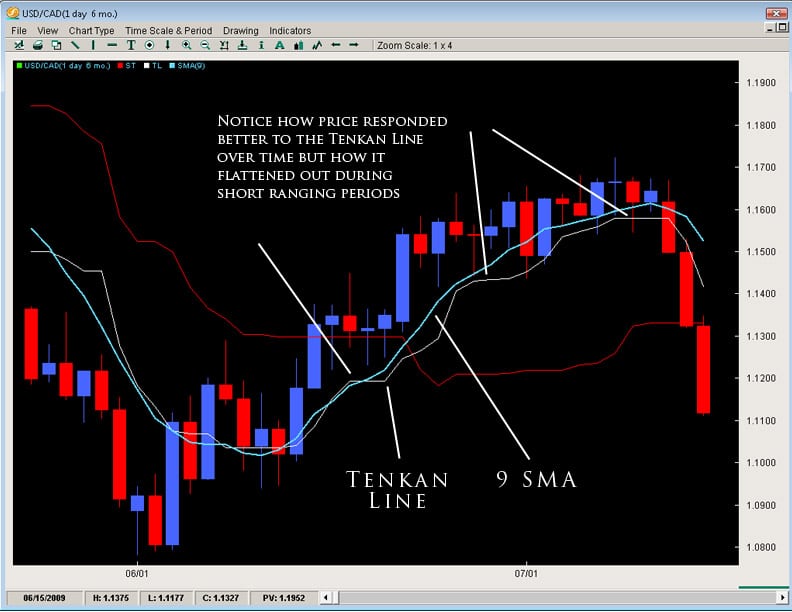
The Tenkan Line or Tenkan Sen (Sen means line in Japanese) is known as the conversion line or turning line is similar to a 9SMA but actually is quite different.  Remember a SMA (simple moving average) will smooth out all the data and make it equal but the Tenkan Line will take the highest high and lowest low over the last 9 periods.  The explanation for this is Hosada felt price action and its extremes were more important than smoothing any data because price action represented where buyers/sellers entered and directed the market, thus being more important than averaging or smoothing the data out.  As you can see by the chart below, the Tenkan Line is quite different than a 9SMA.  Because the TL (Tenkan Line) uses price instead of an averaging or the closing prices, it mirrors price better and is more representative of it.  You can see this when the TL flattens in small portions to move with price and its moments of ranging.

tenkan-line

Akin to all moving averages, the angle of the Tenkan line is very important as the sharper the angle, the stronger the trend while the flatter the Tenkan, the flatter or lesser the momentum of the move is.  However, it is important to not use the Tenkan line as a gauge of the trend but more so the momentum of the move.  However, it can act as the first line of defense in a trend and a breaking of it in the opposite direction of the move can often be a sign of the defenses weakening.

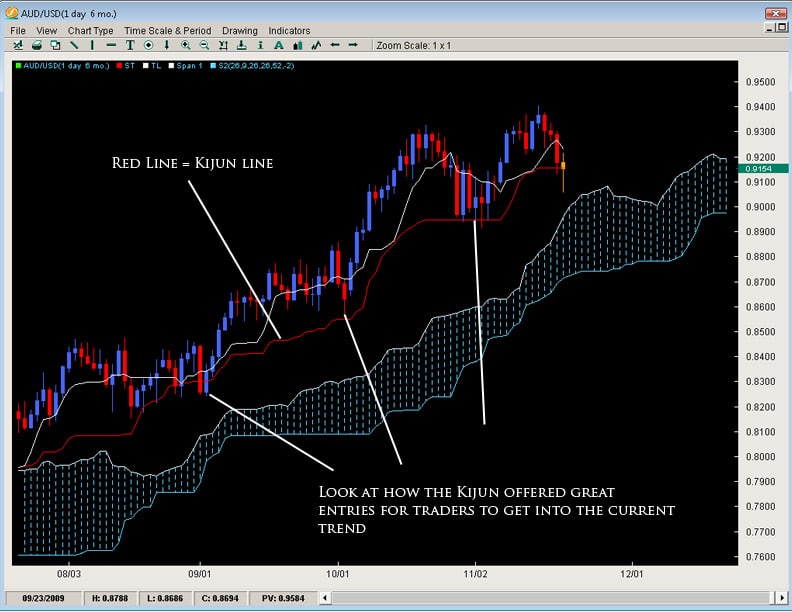
The Kijun Line (or Kijun Sen) is known as the datum line, standard line or trend line designed to indicate the overall trend for the instrument or pair.  The formula behind it is the same as the Tenkan line using price action and the highest high + lowest low with the only change being in the periods as it does it over the last 26 periods.

Why 26 periods?  The answer to that is a matter of history.  When the Ichimoku cloud was first created, the Japanese markets were open 6 days a week on Saturdays. If the markets are open 6 days a week, this generally results in 26 trading days for the month – hence 26 periods for the Kijun.  In essence, what it was meant to be was a measure of the highest high + lowest low for the last month of price action.  If the Kijun has been climbing – it means price has been gaining ground for the last month.  If it is flat, then it will be the midpoint of the range of price for the last month of price action (or representative of the price equilibrium).

kijun-line

Also like the Tenkan Line, the angle of the Kijun is reflective of the overall trend in place.  Price breaking the Kijun after being in an up/down trend often has serious consequences for that trend and can many times lead to a reversal of sorts.  Ultimately because it uses a longer period to measure price action, its a more stable method for determining the direction of the trend than the Tenkan Line.  Because of price to respect this line during a strong trend, it can potentially be used as a stop loss for traders already in the correct direction of the trend.  Hence, when price breaks or closes below it by a significant amount, the trend is often over.

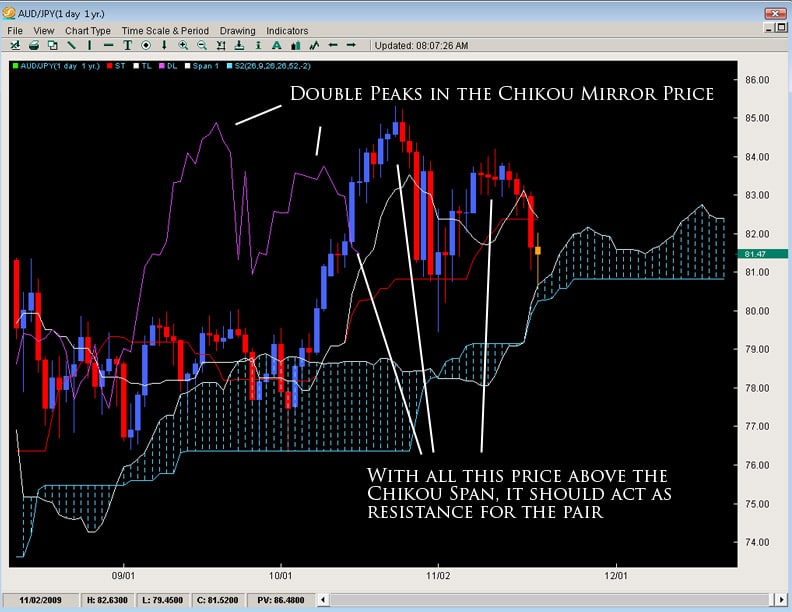
The Chikou Span or lagging line is created by taking the current closing price for the instrument and shifted 26 time periods back, hence why it is a lagging line.  This is a strange concept and not something usually seen in technical indicators which makes the Ichimoku Cloud even more unique.  The purpose is simply to gain perspective in regards to how the current price action is in relationship to previous price action.

The main application for giving perspective to the trader is how does the Chikou Span relate to price 26 periods ago.  If the Chikou Span is lower than price 26 periods ago, then there is resistance for the current upmove or pressure which could force price down into a bearish move.  However if the Chikou Span is above price from 26 periods ago, then it would mean there is little or no resistance ahead since price is in the process of making new highs and there is no recent price above it – thus paving the way for a strong trend.

chikou-span


Applications for the Tenkan and Kijun

The most common usage of the Tenkan and Kijun are the ‘cross’ or what we call the TKx (Tenkan-Kijun Cross).  Similar to how a MACD uses a cross of its two lines, the Ichimoku Cloud does the same.  It is interesting to note that the Ichimoku cloud uses the same periods as the MACD, however it was created over a decade earlier.

One of the main signals for Ichimoku cloud traders, the TKx can often indicate when a trend is about to begin by forming a cross (upward cross = possible upward trend while downward cross = possible down trend). A generic upward cross can be used as a bullish signal (or exit for people already short) and a generic downward cross can be used as a generic bearish signal (and vice versa for current bulls).  However, notice we used the term ‘generic’ meaning there is more to the cross.

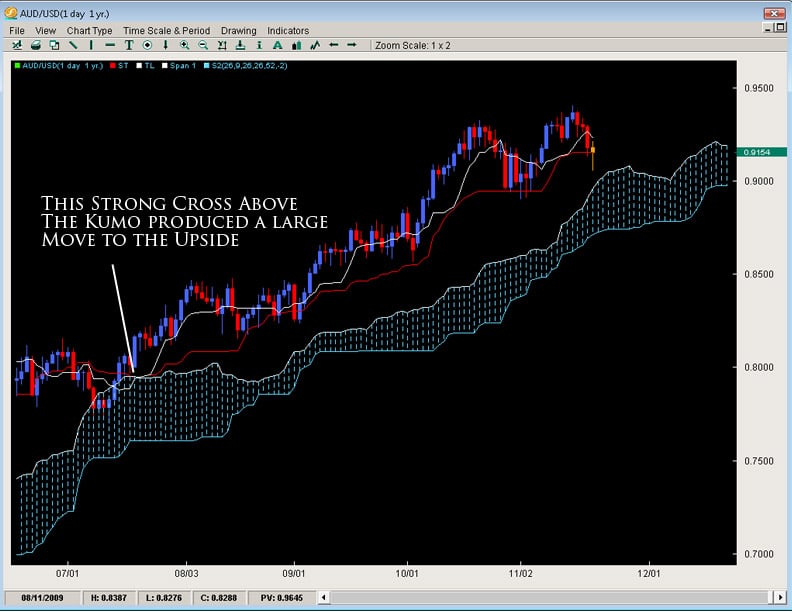
Hosada was able to give a further definition to the cross based upon its position to the Kumo or cloud.  If the cross was below the Kumo, then it was considered a ‘weak’ signal since the cross was below the Kumo or below resistance.  A medium signal was when a cross happened inside the Kumo as it was occurring within the field of support/resistance.  A strong signal was when the bullish cross happened above the Kumo as it was happening after clearing resistance.  The opposite is true for bearish signals whereby a weak signal is a cross above the Kumo, while a medium signal is inside the Kumo and a strong signal below the Kumo.  One important reminder to all this is to make sure you reference the Chikou Span to see how current price is in relationship to previous price action.

tkx

The nature of the cross usually indicates the overall strength or potential for the move but it should be noted strong trends have developed from weak crosses.  It is always also important you reference the construction of the Kumo when trading the typical TKx signals.


Some Important Final Notes on the Kumo

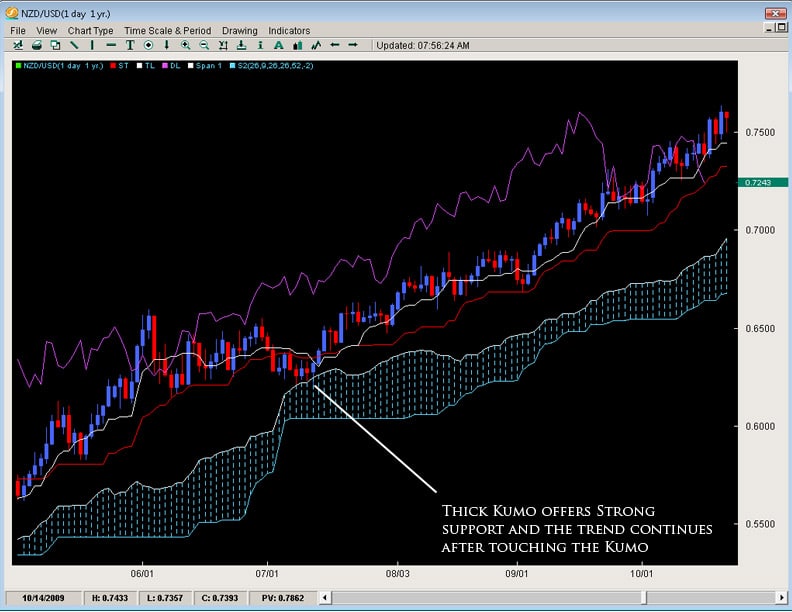
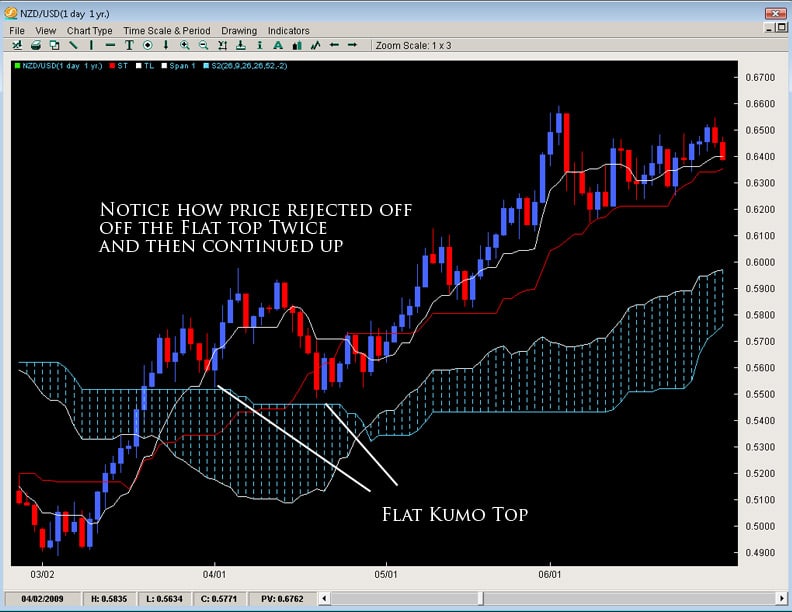
As we talked about before, the Kumo is designed to represent support and resistance but it has a host of implications in doing such.  To review, the thicker the Kumo, the stronger the support/resistance it will offer.  Price will often reject off of the Kumo only to resume the current trend as depicted below by a few examples.

What this also means is if the Kumo is exceptionally thin, in a ranging market it likely means the range will continue as their is neither enough support or resistance to hold a single direction for the pair.  What it also means is if we are in a current trend and price is approaching a thin Kumo, the chances increase for a trend reversal since the support/resistance offered by the Kumo is not significant.  This is why Kumo analysis is important as it can often lead to reversals and inform us in the future of pending trend changes.

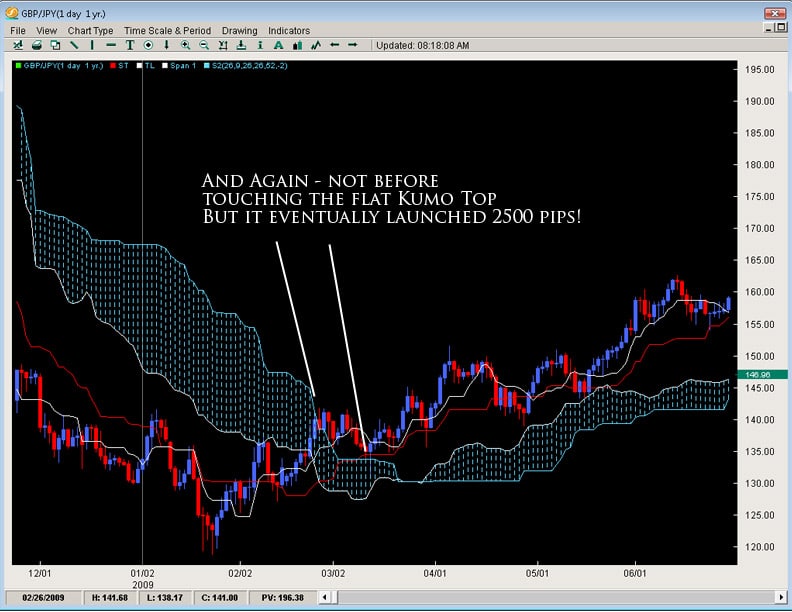
Also, there is a common formation in the Kumo called the ‘flat top or bottom’.  This refers to when the Span B becomes flat.  Remember the Span B is composed of the last 52 candles absolute highest high and lowest low – thus referring to price action over the last 52 periods.  If Span B is flat, the only way it can do that is if price has not extended to make any new significant highs or lows.  This means we are in a range and the tendency of a range is to move towards equilibrium or towards the center of the range – also known as the value area for price.  The end result is during a ranging environment, the Span B is the virtual 50% fibonacci retracement level for that range and is the ever changing 50% fib level for a trending environment, dividing the last 52 candles into two halves, the upper and lower half.

What does this mean for traders?  If price is inside the Kumo, it will have a tendency to gravitate towards the flat top/bottom.  If price is above it, the tendency of price will be to gravitate towards the flat top/bottom, often using it as a springboard for a rejection off of it.

flat-top

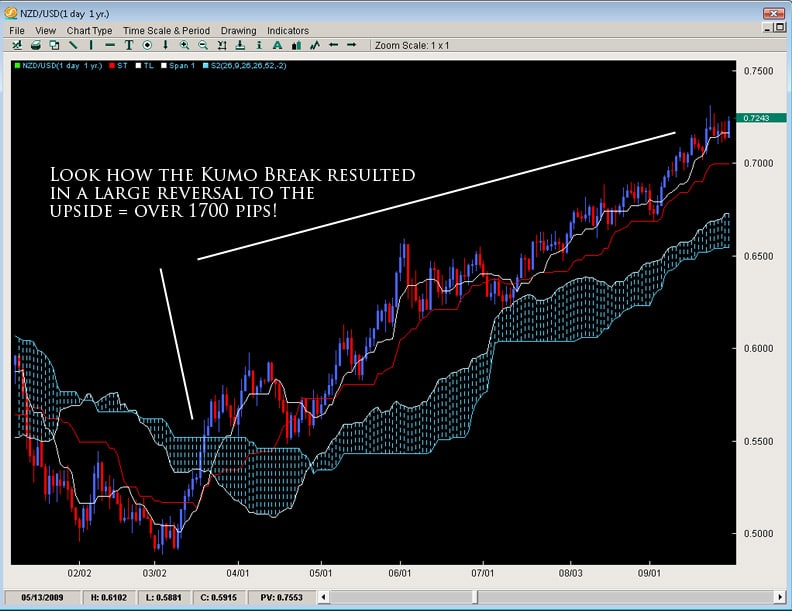
Lastly, one of the most important things about the Kumo is what happens when price breaks it.  If we have been in a strong trend for sometime and price then breaks the Kumo, it usually represents a trend change and the likelihood of a large move about to begin in the direction of the break as you can see by the examples below.

kumo-break-1

kumo-break-2

It is because the Kumo is always changing shape that it can represent a much better perspective of support and resistance.  It is essentially based upon price action and changing shape based upon previous price moves.  This makes it a little more sensitive and representational to price unlike static forms of support and resistance (fibonacci retracement levels, pivots, trend lines, etc) which do not move at all once they are in place.  It is its unique construction which allows the Kumo to be both Static and Dynamic in giving support/resistance levels to the trader.


In Closing

This is just the beginning of the Ichimoku Cloud and designed to give the trader an introduction to the key elements around such a fascinating indicator and method for trading the markets.  The Ichimoku Cloud has the ability to detect trends, reversals, support/resistance levels, trend strength/weakness and momentum for a pair.  It is due to its ability to be used in multiple environments, along with its unique perspective upon price and support/resistance levels that Institutional and retail traders have gravitated towards using this method.