This video focuses on some key elements which can enhance Kumo Break trades and how to spot them.
Tag Archive for: Ichimoku
Using the Ichimoku Cloud to discover Reversals
One of the amazing things about the Ichimoku Cloud is the actual Cloud or ‘Kumo’ which is something unique wherein nothing like it was created before and nothing sense has come after.The Ichimoku Cloud or Kumo is designed to represent support or resistance but in a different form the western world has seen – to view support and resistance as evolving or dynamic and not static like pivot lines, Fibonacci lines, support lines or trend lines.
To the creator (Goichi Hosada), support and resistance was evolving and really based upon previous price action.Particularly, the highs and lows of previous price action was of great concern to Hosada (along with the opens and closes) which showed levels of rejection where the market would not accept price.The previous highs and lows would also give traders the range where the market was accepting price.
So the real question is ‘how’ does the Forex Ichimoku Cloud or Kumo represent support and resistance? The answer lies in the construction of the forex Ichimoku Cloud or Kumo.
Kumo Composition
There are two main lines of the Kumo which are referred to as Senkou Span A and Senkou Span B. For the purposes of efficiency, we will refer to them as Span A and Span B. The space or value in between these two lines is what forms the Kumo.
Span A is formed by taking the Tenkan Line and adding it to the Kijun Line (white and red lines respectively from chart above), then dividing that value by 2 and plotting it 26 periods ahead. The formula is;
(Tenkan Line + Kijun Line) / 2 placed 26 periods ahead
Span B is formed by taking the highest high (over the last 52 periods), adding to it the lowest low (over the last 52 periods), dividing that by 2 and plotting that 26 time periods ahead. The formula is;
(Highest High + Lowest Low for the last 52 periods) / 2 and plotted 26 time periods ahead.
Now, before we fully get into the construction of the Kumo, we have to talk about what the Tenkan and Kijun lines are which help to form the ever changing Senkou Span A.
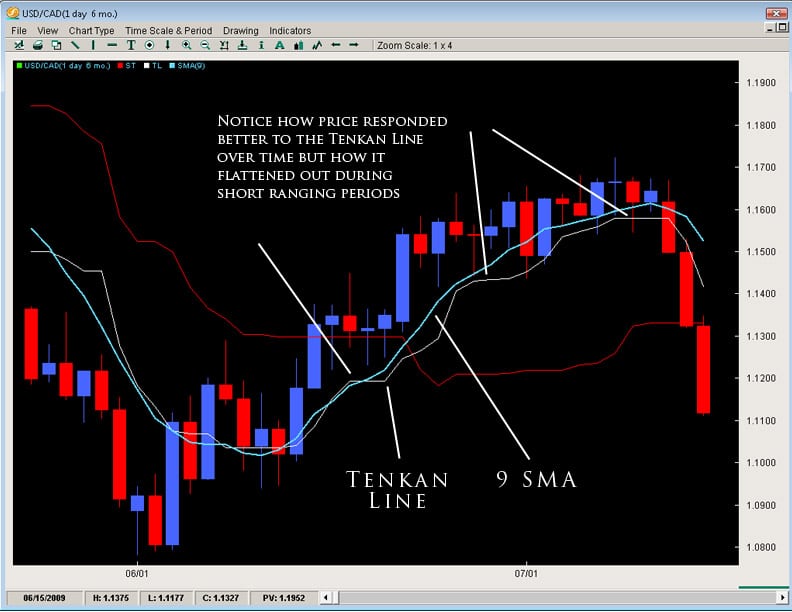
The Tenkan Line or Tenkan Sen (Sen means line in Japanese) is known as the conversion line or turning line is similar to a 9SMA but actually is quite different. Remember a SMA (simple moving average) will smooth out all the data and make it equal but the Tenkan Line will take the highest high and lowest low over the last 9 periods. The explanation for this is Hosada felt price action and its extremes were more important than smoothing any data because price action represented where buyers/sellers entered and directed the market, thus being more important than averaging or smoothing the data out.
As you can see by the chart below, the Tenkan Line is quite different than a 9SMA. Because the TL (Tenkan Line) uses price instead of an averaging or the closing prices, it mirrors price better and is more representative of it. You can see this when the TL flattens in small portions to move with price and its moments of ranging.
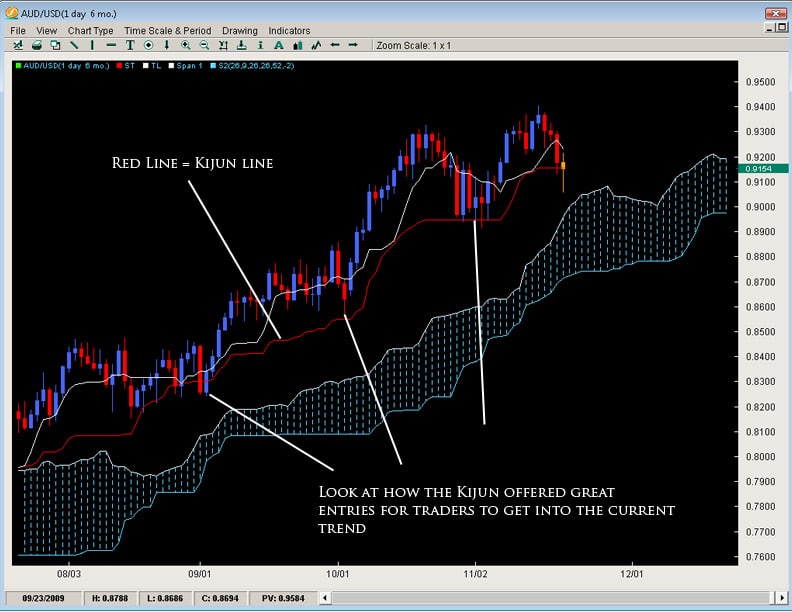
The Kijun Line (or Kijun Sen) is known as the datum line, standard line or trend line designed to indicate the overall trend for the instrument or pair. The formula behind it is the same as the Tenkan line using price action and the highest high + lowest low with the only change being in the periods as it does it over the last 26 periods.
Other Notes About the Tenkan and Kijun
As a whole, if the Kijun has been climbing – it means price has been gaining ground for the last month. If it is flat, then it will be the midpoint of the range of price for the last month of price action (or representative of the price equilibrium).
Now that we have uncovered the composition of the Tenkan and the Kijun lines, lets talk about how they form the Senkou Span A.
Going back to its construction:
Span A is formed by taking the Tenkan Line and adding it to the Kijun Line (white and red lines respectively from chart above), then dividing that value by 2 and plotting it 26 periods ahead. The formula is;
(Tenkan Line + Kijun Line) / 2 placed 26 periods ahead
So the Tenkan line (which is the momentum line) and the Kijun line (which is the trend line) that are based upon price action are moving.Their valued added together, divided by 2 and sent 26periods ahead is what forms the Senkou Span A or Span A.So the first portion of the Ichimoku Cloud or Kumo is based upon evolving price action lines which are half momentum, half trend monitoring.When you put these two together, you get the Span A which is always changing based upon the acceleration or deceleration of price based upon how they effect the Tenkan/Kijun lines (and in turn, the Senkou Span A).
The second line is the Senkou Span B which is a little different.Its based solely upon price action, particularly the last 52 candles of whatever time period you are on.If you are working with a daily chart, we are talking about the last 52 days, for a 1hr chart, the last 52 hours of price action.After taking the high and low for the last 52 candle range, it takes their values, divides them in half, and shoots them 26 time periods ahead.
The shading in between is called the Cloud or Kumo.
If the Ichimoku Cloud or Kumo represents support and resistance, then the thicker the Cloud, the thicker the S/R it offers.If price is below the Kumo, it will act as resistance, if price is above the Kumo, it will act as support.The Cloud can take many forms and shapes (virtually infinite) which is what makes it tricky but thick Kumo’s often will reject price and the longer the time frame (4hr, Daily, Weekly), the more powerful the Kumo will act as support or resistance.
Take a look at some examples below.
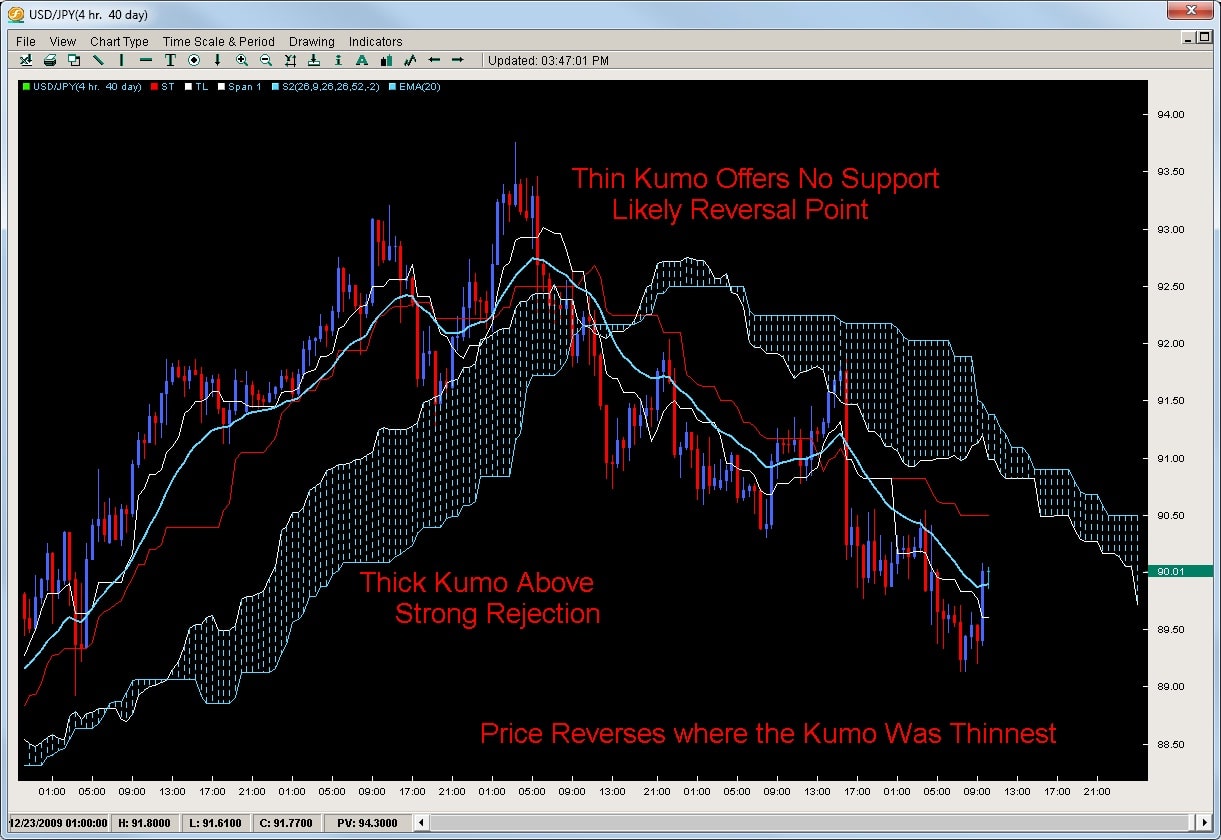
USDJPY 4hr Charts
Notice how the pair rejects off the really thick Cloud but when it reverses is where the Cloud was the weakest or most thin.
USDCAD 4HR Charts
Taking a look at another example, the USDCAD after its initial fall, rejected off a really thick Kumo twice telling us a reversal was less likely.However the Kumo starts to thin out giving us a window to break through the Kumo and likely reversal point.
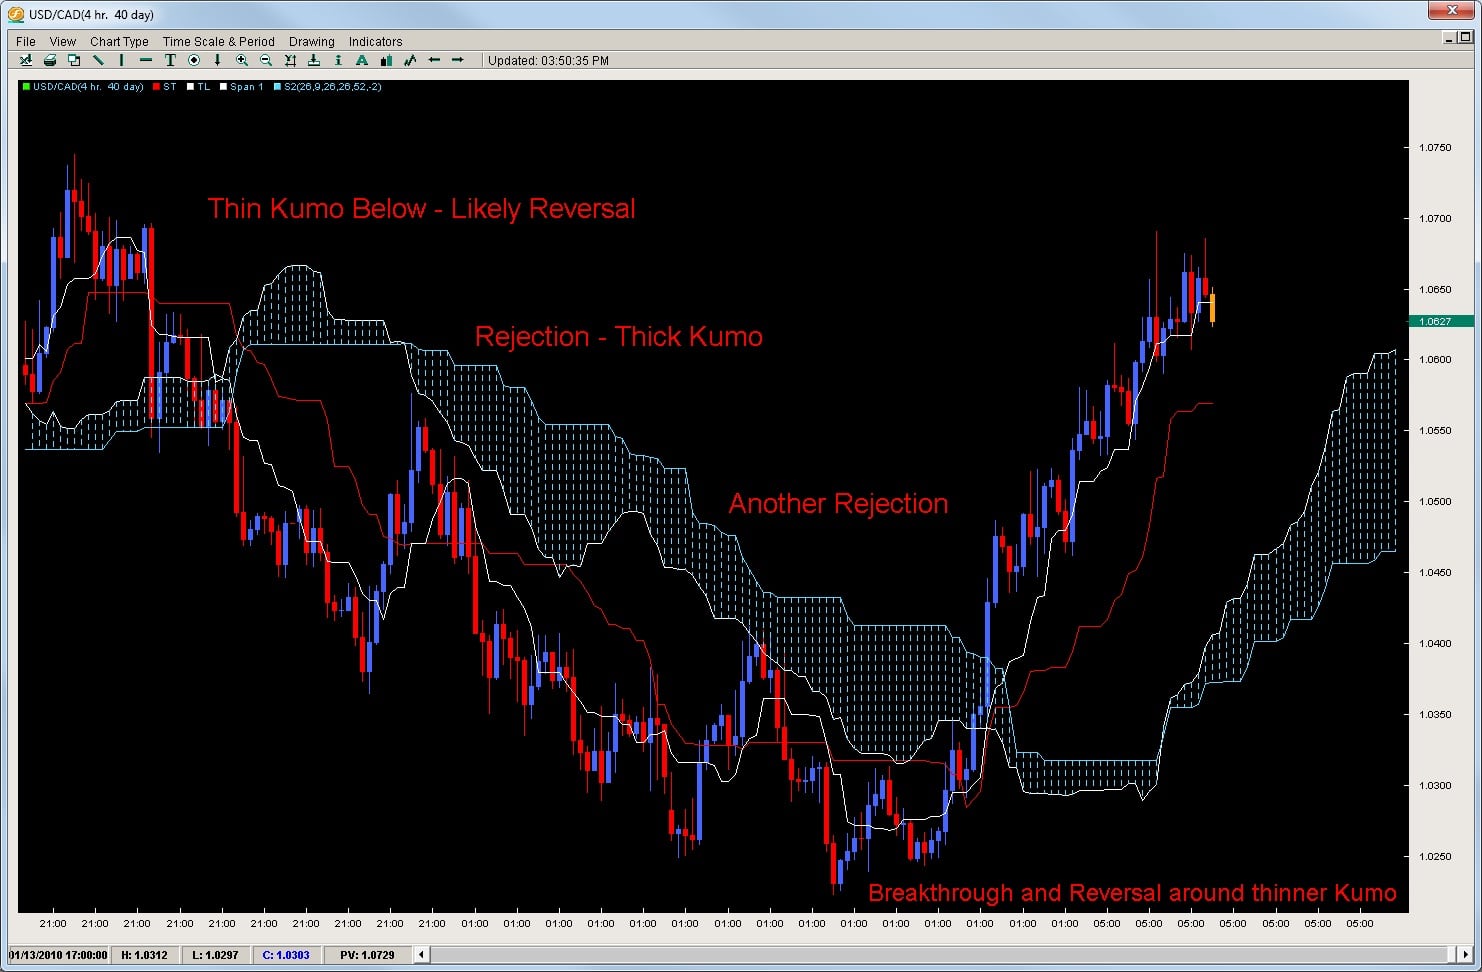
So the key tactic in both is to look for thinner Cloud formations which offer a window or glimpse into an upcoming reversal.Remember the Kumo is sent 26time periods ahead so you have plenty of warning when the window is opening.If you are in the current trend, the window in the Kumo could be a warning to take some profits or if you are looking for a reversal, then the Cloud offers you a good location and method to time a reversal which is one of the hardest things to do in trading.
Another clue hidden in the Cloud can be the flipping of the Senkou Span A and B which can indicate a reversal but do not always.The other main point is price does not always reject off a thick Kumo so its important to watch price action as well but the Ichimoku Cloud is excellent at spotting and timing reversals.
To learn more about the Ichimoku Cloud for reversals, or proprietary quantitative based strategies on the Ichimoku Cloud, check out the Advanced Ichimoku Course.
Traditionally, the Ichimoku Cloud is known for its ability to pick up trends and keep traders in them until they are over.It should be noted that any system or method which is good at finding trends is also good at finding reversals because if you are finding the times/locations when trends are ending, then you are finding consequently a reversal.
There are several components inside the Ichimoku Cloud which give it a unique capacity to find trends, establish if we are in a trend, which direction and when it is over.One of them is the Kumo or Cloud which is one of the most unique technical indicators out there.
Kumo Composition
There are two main lines of the Kumo which are referred to as Senkou Span A and Senkou Span B. For the purposes of efficiency, we will refer to them as Span A and Span B. The space or value in between these two lines is what forms the Kumo.
Span A is formed by taking the Tenkan Line and adding it to the Kijun Line (white and red lines respectively from chart above), then dividing that value by 2 and plotting it 26 periods ahead. The formula is;
(Tenkan Line + Kijun Line) / 2 placed 26 periods ahead
Span B is formed by taking the highest high (over the last 52 periods), adding to it the lowest low (over the last 52 periods), dividing that by 2 and plotting that 26 time periods ahead. The formula is;
(Highest High + Lowest Low for the last 52 periods) / 2 and plotted 26 time periods ahead.
What is it used for?
The most important way to look at the Kumo is as support and resistance – meaning if it is thick, then the support/resistance (depending upon where price is in relationship to the cloud) is strong. If price is above the Kumo, we are in a general uptrend or would want to look for more buying opportunities. If price is below the cloud, it is below resistance (the Kumo) and we want to be searching for more shorts than longs. The longer price stays below/above the cloud, the stronger the trend we are in and the more support/resistance the Kumo will offer.
These are generic ways to look at it but effective.What is important to note is in trends, price will stay on one side of the Kumo.The farther price is from it, the stronger the trend and more volatile it is.Thus, the Kumo can be a very effective tool for option traders as well as trend/momentum traders.
How can we use it for Reversals?
Because the Kumo will often hold price on one side of it, when price breaks it, such a move can often signal a reversal.There are various factors which will increase the likelihood of a reversal such as:
- Thickness of the kumo when broken
- How long price has been on one side of it
- How far price has moved before touching/piercing the kumo
- What time frame you are working on
These are all critical when assessing whether a Kumo break is signifying a reversal or not.
A few examples
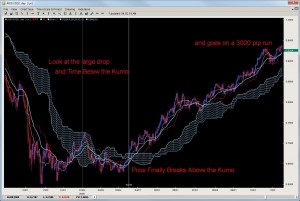
Take a look a the AUDUSD below.It was below the Kumo for a long period of time and had a massive fall.Then after a couple of attempts on the daily chart, broke above the Kumo.Now remember the Kumo represents support and resistance so the pair breaking above it, then coming back to the Kumo to treat it as support was a great role-reversal play.After retouching the Kumo, it went on a 3000 pip run!
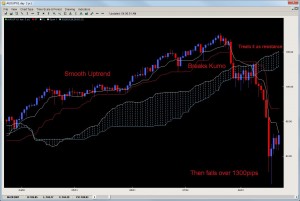
Another example is on the AUDJPY on the daily chart which was on a smooth consistent uptrend.Look what happened when it broke the kumo.It took a few days, but then after attempting to break back above, treated the Kumo as resistance, and the pair then fell over 1300 pips in a few months.
Final Notes
The Kumo breakout strategy is one of the key systems used by Ichimoku traders for spotting key reversals, qualifying them and giving traders a unique opportunity to either take profits or reverse positions.Its great for timing trends, reversals and trading key reversals when they are in play.Because of its unique ability to measure support and resistance, the Ichimoku Cloud and its Kumo construction offer the trader some unique trade opportunities.
It should be noted there are other key elements needed to trade the Kumo Breaks with precision.We have analyzed Kumo breaks on Forex, Futures, Commodities and Indices over the last 10 years and with our proprietary indicators and analytical programs, are able to give precise measurements for how far and long a Kumo break should travel which gives you a precision edge when trading them.
To learn more about our proprietary Ichimoku trading strategies and systems, visit our Advanced Ichimoku Course where you will get access to 10 years of proprietary quantitative data on how to trade Ichimoku Clouds.
EURUSD
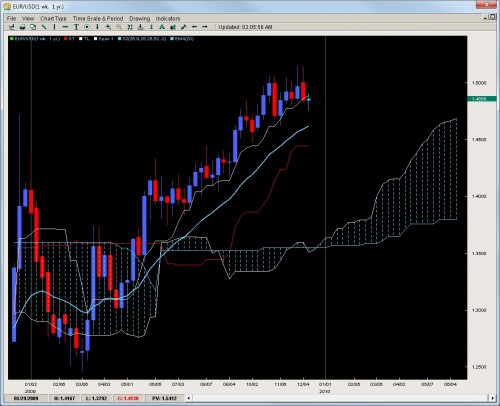
Finally breaking stride, the EURUSD has done something it has not been able to do for the last 7 months…have a weekly close below the Tenkan line. This line has held on dips and been quite a play in terms of getting into this trend. With the line being broken, there are two likely scenarios and a third unlikely one.
Scenario 1: The pair goes sideways into a consolidation or channel holding between 1.4615 (20EMA) and 1.5130 (basically the yearly high). This is the least exciting scenario but probably the most likely as heavy positions are probably not coming into the pair anytime soon. The pair simply struggled to make any new ground above 1.5000 and failed every time to have a weekly close above it. Does this mean the bulls are headed for the exit? No – but they are less confident in the short term and will likely not consider adding positions until the pair touches the 20ema.
Scenario 2: The pair starts a sell off as bulls take profits for the year and exit out of the pair. The failure to close on a weekly basis above 1.51 caused them to lose confidence short term and look for a lower/cheaper entry. If this plays out, the pair should move within 1-2 weeks towards the 20ema. However with liquidity drying up by the end of next week, unless the pair starts getting aggressive today or tomorrow, this scenario fades in likelihood as santa comes closer to visiting us through our chimneys.
Scenario 3: The least likely is the pair gets really bullish and makes new highs. We feel this is rather unlikely so if you are thinking of throwing on massive longs, caution is advised as we do not feel this is the time, environment or overall location to be putting on heavy longs. Best to wait till new year with fresh eyes and hopefully a lower price.
GBPUSD
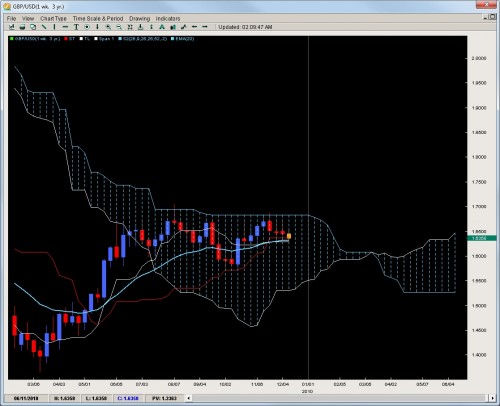
Failing once again to make a run for the Kumo Flat top and break it, the pair has now posted 3 straight weekly closes and is threatening an important base in price at the 6300 region along with the Kijun, Tenkan and 20ema. If we were to get a weekly close below this, we feel the pair would make a strong move towards 1.5700 which was the October low and launching pad for a 1300pip run. Keep in mind this was a perfect bounce off the Kijun which is not as stable now so any breakdowns this week likely lead to strong price moves once clear of 1.6200. It is becoming more likely GBPUSD will remain between 1.5700 and 1.6827 which is the flat Kumo top for the rest of the year so do not expect wild upside thrusts to end the year.
AUDUSD
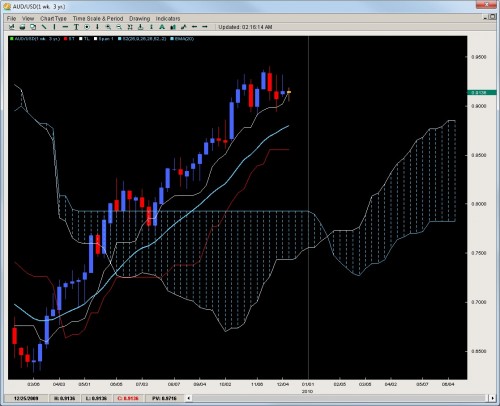
Virtually but a cigar short of closing below the weekly Tenkan, the pair is threatening a break below the white line which has held since July (only below for 1 week) and essentially since March. A weekly close below this will likely target the 20ema which is down at 8800 where the longer term bulls will be tested and tempted to add positions. Keep in mind a break of this line would likely start a drop towards 8500 and perhaps down to 8200 where there is a good price base and likely where the kumo would be in such a venture. Overall, we feel the pair is showing signs of being over-valued and may need to unwind a bit before another push up towards parity is attempted but its unlikely bulls have the gusto right now for an attack on the yearly highs or 9500 so we expect at best a sideways consolidation between 9000 and 9400 but would not be surprised if a strong sell-off occurs as there is not much to prop the pair up except for a small 3 week price base at 9000.
USDCAD
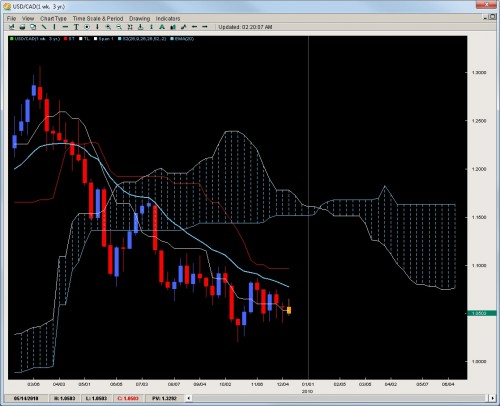
The drifter of the pairs, price action is getting less enticing every week as we are seeing multiple inside bars with little breakouts and a lot of wicks on the weekly charts communicating a lot of rejections and un-clarity about where price should be for this pair. Its forming a wedge and a rather small one so these are generally environments to be avoided. There is a small base which we mentioned last week in the 1.04’s and we mentioned if you wanted to get long, that was the place to do it. It definitely yielded some profit bouncing about 100+pips off that figure but each week such a move becomes more dangerous and less recommended. The only other base to go long is at 1.0200 (yearly low). Beyond this, we do not feel any other longs will enter until a break of the 20ema which has not happened since April.
NZDUSD
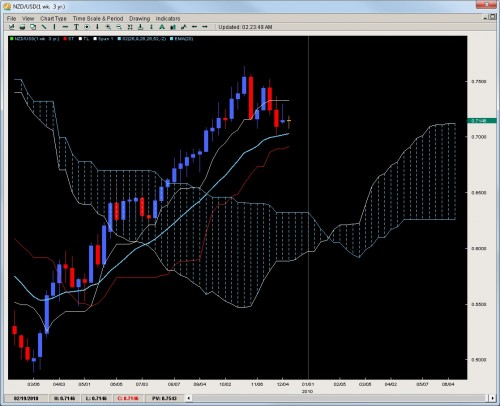
The underperformer of the trend pairs against the greenback, the pair has now formed a short term range of price action between the Tenkan and 20ema with two rejections at the Tenkan and one at the 20ema. The good thing about this price action is it gives us clear plays on both sides of the market and out of all the pairs, we feel this is one of the better ones to trade with the established rejections. The lines in the sand are more clear here than any of the others so plays (light ones) could be made on both sides. With all the lines starting to go flat, the chances of this range holding (at least to the upside) are solid. A downside break is the more likely scenario but the jury is still out on that one. Any aggressive selling today or tomorrow would bolster the downside argument. Ultimately, we feel any strong dips will likely lead to price basing around 6500 which we feel is a good value area to establish longs for another run up to 7500.
Chris Capre specializes in using Ichimoku, Momentum, Bollinger Band, Pivot and Price Action models to trade the markets. He is considered to be at the cutting edge of Ichimoku analysis along with building trading systems and Risk Reduction in trading applications. For more information about his services or his company, visit https://2ndskiestrading.com
