Tag Archive for: pin bar setup

The Rosy Picture
I know the idea of being a professional trader will seem like a rosy picture, but the fact of the matter is you are going to face some tough times as a trader. You will have to do many things to be a successful and professional trader (or successful/professional anything for that matter), but the most crucial things you do will be the little things in the big moments of time.

Bottom line is – you will have to deal with making mistakes that cost you money, and a lot of it. You will have to deal with some really tough losses, whether they be 4, 5 or 6 figures. Yes, you can make 5, 6 or 7 figures, but that will be totally dependent upon you remaining completely focused, confident and disciplined while you are going through the good times, as well as the really tough ones.
roadmap to success forex trading 2ndskiestrading.com you will have to do this trading
In Trading…
You will have flat periods, draw-downs, losses (perhaps several in a row), but regardless of what you face mentally, emotionally, or physically, you will have to keep proper money management.
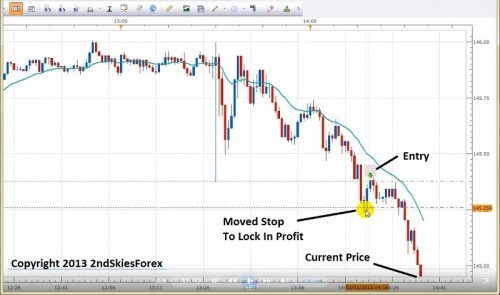
You will likely have to take a trade shortly after getting hit by the market only minutes before. You will have to deal with getting stopped out by a pip or two, only to see the market move 100+ pips towards your target. You will have to be patient and sit on your ass, even though you want to get in.
And you will have to do all of this while the market is moving in real time, while there are large profits to be made, while your emotions are working completely against you, while you are experiencing fear, or worry, or impatience, or frustration, or absolute un-clarity.
making tough decisions in real time forex trading 2ndskiestrading.com
You will have to make tough decisions in real time that may not be so evident as they unfold before you in a live trading environment.  It is very easy and completely common to miss the best setups happening in real time, that follow your rules, or your price action system, because in real time all of the toughest things about trading are present.
The Mountain
I know it may seem like you are pushing up against something larger than yourself, like you are moving a large boulder up a mountain, but you are actually pushing up against yourself – not the market. There is a powerful, self-reflective & insightful quote from Sir Edmund Hillary (1st to ever reach the summit of Mt. Everest) which goes;

“It is not the mountain that we are conquering, but ourselves”

 
This is exactly what trading is, as you are not conquering the market – but yourself.
climbing mt everest conquering the market 2ndskiestrading.com you will have to do this trading
Safe Distance & The Monday Morning Quarterback
Hindsight is a free zone, a safe distance to evaluate things as there is no emotion involved, with no live triggers to activate your unconscious or limiting beliefs. When you look at a trade after the fact, there is always clarity, and it looks like the setup was literally put on a golf tee just waiting for you tee off.

golf tee price action setup hindsight 2ndskiestrading.com you will have to do this trading

However, the reality in trading is, the clarity so available in hindsight is often barely present when trading in real time.
You wouldn’t believe how many ‘authorities‘ or ‘masters of all things price action‘ (ironic considering no peer calls them that), talk about all these great setups after the fact.
They boast how it was ‘widely discussed in their members forum’ only to find out it never was & they never traded it themselves.  This is despite the fact it was an ‘obvious’ pin bar setup, or engulfing bar setup, or some other ‘obvious‘ thing they didn’t trade, but lauded after the fact.
Anyone can be a Monday morning quarterback, but can they be a trader in real time is the question. This is why lately I have been almost weekly posting my actual setups herehere, here, here, here, and here of how I traded them in real time.
This is with all the success and mistakes made while managing that live trade, with my actual entry and exit from the brokers chart, based on all the thoughts, emotions and decisions that are involved in them.
Actual Trades
If they’ve only shown you one trade in the last year, or a few in the last few months, without actually even showing you the entry and exit from their broker chart – then run away as they are hiding from the fact they do not trade. They should also be showing you successful trades from their students which you can find here, here, here, here, and a ton more here.
live price action trade gbpjpy chris capre 2ndskiestrading.com
But make no mistake, there are many things you will have to do while trading, particularly managing, and managing two things which require practice and precision to do well.  They are;
1) Managing Risk
2) Managing Your Emotions
Hopefully you already have a set of rule based systems that you follow to get in and out of a trade, so there is little management in that part. It is the two listed above that require most of your mental/emotional/psychological management and capital.
In Summary
To repeat, you will have to endure tough times as a trader, with some tough losses, flat periods, draw-downs, making expensive mistakes.  And you will have to do this while not investing all of yourself and success / failure in the last trade.  You always have to be trading and thinking in probabilities.
Losses are inevitable, but how you deal with them is not. If you can learn to remain focused, confident and disciplined – regardless of what just happened in the last few minutes, hours or days, then you can find yourself back towards a winning trade. But more importantly, you can experience first hand a valuable lesson, which can pick you up after you fall, carry you towards winning trades, and feed your trading career for a lifetime.

I recently wrote a controversial article dispelling some of the misconceptions about the ‘Quality vs Quantity‘ argument, the ‘Less is More‘ being better for your trading.  It has already garnered a lot of questions and responses on the web, which was its purpose.

But there are still some lingering and freshman ideas floating around there.  Thus, I wanted to write a brief article to end the week highlighting some of the key takeaways, and what not to be fooled by.
 
High Quality Signals Only Come From Higher Time Frames
The idea that high quality trades, setups and signals only come from higher time frames really comes from an inability to see and read price action.
high quality signal higher time frames trading like a sniper 2ndskiestrading.com
Ask yourself – what constitutes a high quality forex signal?
Some of the main components (regardless of time frame) should be;
1) a pattern that repeats itself with consistency and accuracy
2) a signal that offers low risk and high reward potential
3) a pattern that offers a clear entry and exit pattern
Let’s break down each one here so you fully understand them;
 
1) A pattern that repeats itself with consistency and accuracy
high quality patterns that repeat themselves 2ndskiestrading.com
If you haven’t noticed, the markets are changing with daily ranges contracting massively and currently at 5 year lows.  HFT algos now comprise 28% of the daily volume, but 3 years ago were 10%.  So this would change how the price action unfolds considerably as they are using different techniques, technology, and patterns than traditional human traders would (or could).
Even though the patterns are changing, they are patterns that repeat themselves nonetheless, and for someone who is a real student of price action, you will be able to see these patterns on all time frames.
As long as the price action pattern is relatively consistent with both the formation and outcome, this is a key ingredient for a high quality signal, and thus a tradable event.
 
2) A signal that offers low risk and high reward potential
quality vs quantity which is better 2ndskiestrading.com
The size of my stop in relationship to my target is what constitutes a high quality signal.  The greater this is above 2x reward v. risk, the better the quality of the signal.  I still have to figure accuracy into the equation, as profit is really a measurement of risk, reward and accuracy.
Regardless, a 200 pip winner with a 100 pip stop offers the exact same profit potential as an 60 pip winner with a 30 pip stop.  Assuming you risk the same on each trade in terms of % equity, they offer the exact same profit potential.
Now one thing should be pointed out;
Risking 100 pips, how many times would I be able to grab a 9x, or 11x reward play, meaning I could grab 900 or 1100 pips from that trade?  I’m assuming not many at all, and something you’ve likely never done just risking 100 pips.
But what about risking say 10 pips and gaining 90?  Since 900 pip straight moves are not common on a daily chart (maybe 5-6x a year), but 90 pip moves occur everyday, the latter once again offers more profit potential.
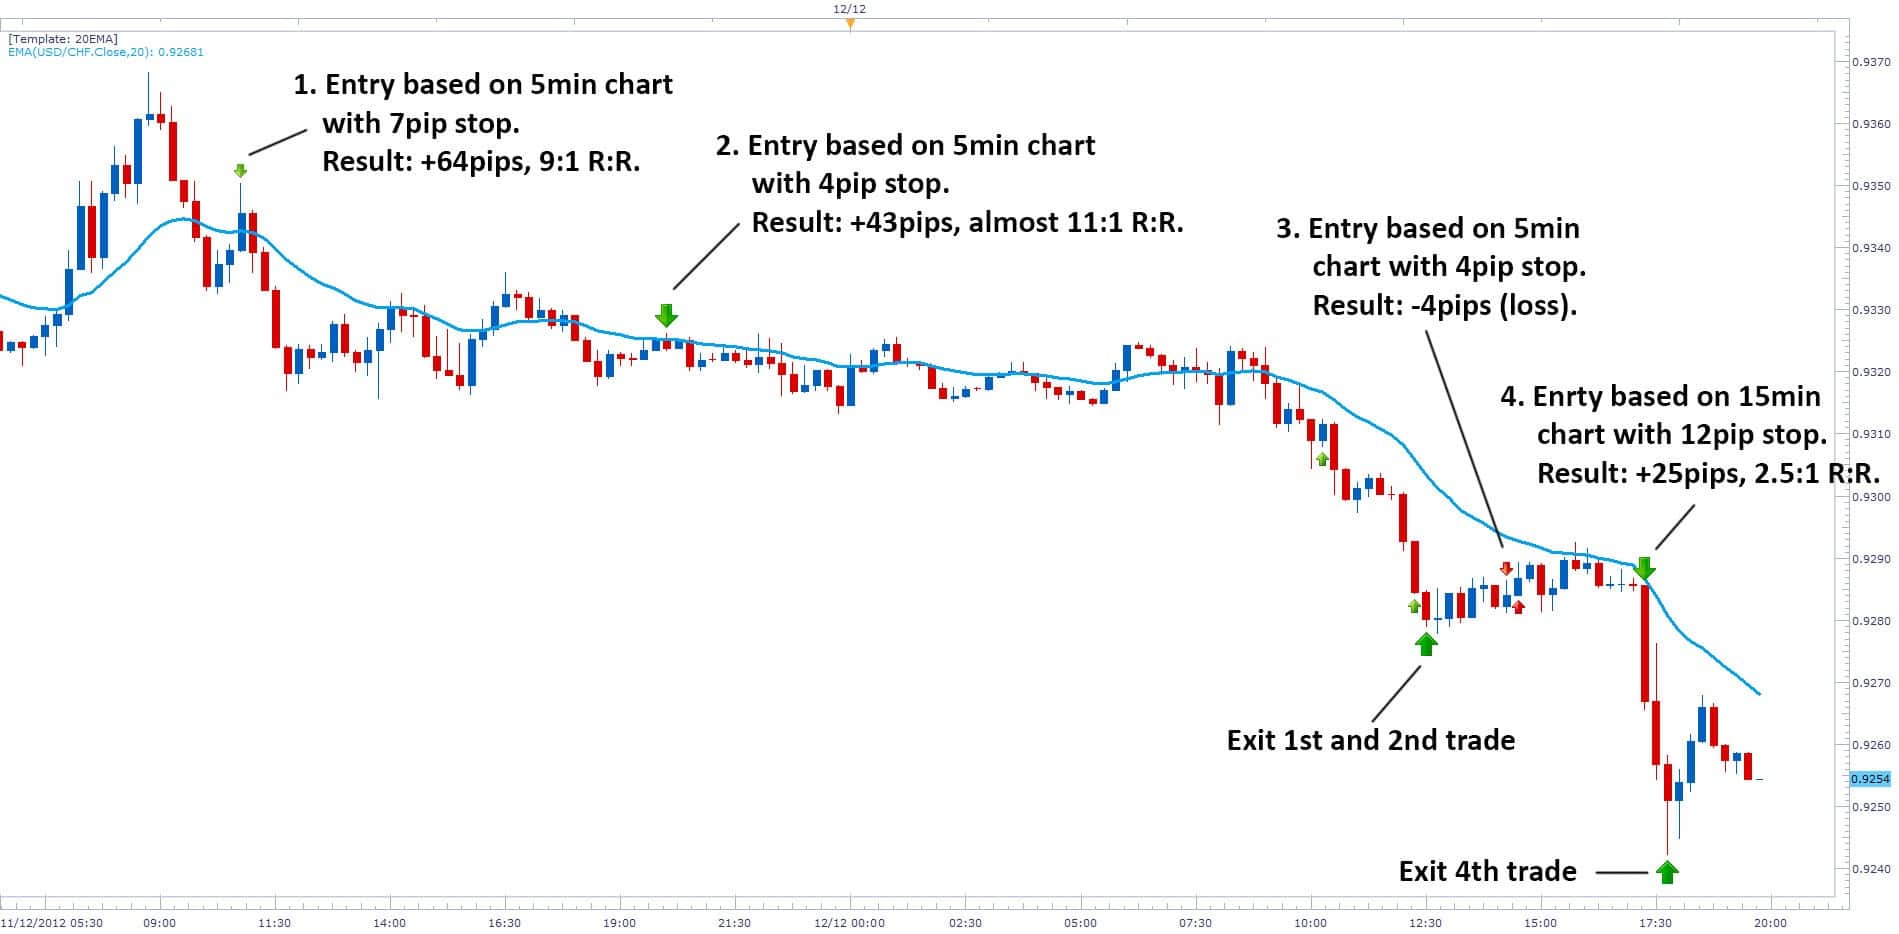
Just the other day, one of my price action course students did just that, snagging 128 pips on the day, grabbing a 9x reward play, an 11x reward play, and a 2+x reward play.
So you trading the daily charts only risking say 100 pips, would have needed to bank a 900 pip runner, an 1100 pip runner, and a 250 pip runner, just to equal what my student did in < 24hrs!
making money trading price action with chris capre 2ndskiestrading.com
Ask yourself Mr. (or Mrs.) Daily Chart Trader Only, how many times will you be able to do that in one single day, let alone a year?
If you are on avg. banking 2x reward plays, and trading 3x per week, you would need an entire month of perfect trading just to equal his half day of trading.  Add 3-4 losses in there, and you are talking 1.5-2 months to achieve what my student did in 24hrs.
Which would you rather do?  Work for an entire month to make what you could in a day?  Wait for months on end to find something  you could achieve almost daily?
Food for thought, but high quality signals happen everyday.  If you are not seeing it, you just haven’t learned how to yet, but with proper training in price action or ichimoku, you could.
 
3) A pattern that offers itself a clear entry and exit pattern
For any signal to be high quality, as discussed earlier, it has to be 1) repeatable and solidly accurate, 2) offer low risk/high reward potential, and 3) offer a clear entry and exit pattern.
For those that have read my article on understanding impulsive and corrective price action, you will remember my key model is to find impulsive moves and trade in that direction, as the next legs are likely to be a corrective move, followed by another impulsive move in the same direction.
Now using the same chart from my student below, look at the 4th trade which is the last one on the day (chart below).
price action trading top student 2ndskiestrading.com usdchf
Notice how he was using my model of following the impulsive and corrective price action, looking to short with trend on a corrective pullback and trade with the institutional money.
His first attempt failed for a small 4pip loss, but his second attempt caught a really opportune moment to get in, and immediately after his entry, the sellers came in with force, bottoming out with a pin bar setup that he recognized as a likely bottom, along with a few other clues from my price action course.
He ended up banking +25 pips on a 12 pip stop for a 2x+ reward to risk play, all in 15 mins.
Notice how he controlled the risk exceptionally well with precision and confidence, almost like a sniper would taking out his targets.  For those with eyes, he had a clear entry and exit pattern, which is needed to have a high quality signal.
This was a high quality A+ setup that was obvious and was begging to be shorted.  You will also notice he had a good strike rate, hitting 3 out of 4 trades for 75% accuracy, all while trading < 1hr charts.
To do this he had to be patient and disciplined.  You don’t have to wait for days to find these trades, as they come daily.  You just need to learn how to spot these high quality intraday price action setups.
He was looking for easy opportunities, acted with complete confidence, swiftness, precision and without hesitation.
less is more trading with precision like a sniper 2ndskiestrading.com
He also avoided any risky situations, and used highly effective risk management, never risking too much per trade or more than necessary.  He never interfered with his trades as you can see on trade 2, he had to be patient for the trade to mature.  When it did, he took profit, but he never exited early.
And if you look at the 2nd and 4th trades, he was looking for the easy prey – the most obvious setups out there.
 
In Summary
As I stated in my prior article on quality vs. quantity – which is better for trading?, the ‘less is more‘ doesn’t apply mathematically and always hold up, as I’ve already demonstrated.  Unless your accuracy is significantly higher, your ‘less is more‘ theory is actually a lot less profit mathematically.
Food for thought.
Now it should be stated I am not saying you should trade intraday only, or abandon the 4hr and daily charts.  For those of you with full time jobs, families, and busy lives (many of you), I recommend trading the daily and 4hr strategies as these will be most suited to your situation and availability.
I always advocate finding what is most natural to you, your mindset and situation.  This will always be the most profitable strategy you could engage in.  For some that will be on the higher time frames and the ‘less is more‘ approach which has some advantages.
But for others, it will not be, as you have the skill set, mental aptitude, and availability to trade intraday. The key is to finding what would work best for you, and then learning that to the best of your abilities.
Just don’t fall prey to the ‘one size fits all‘ or ‘less is more‘ approach, because it may actually be ‘less’ for you.
To argue high quality forex trading setups only manifest on higher time frames is a sophomore understanding of trading price action, or trading as a whole.  They manifest on all time frames, you just have to learn how to see them.  That does not mean you should trade them all – just find a method of trading that fits you best.
Make sure though, you don’t fall for any one sided arguments saying quality is better than quantity, or vice versa, as the answer lies somewhere in between, and in reality – a balance of both!
Kind Regards,
Chris Capre

Today I am going to give a lesson on how to find some of the best support and resistance levels in the market.  If I had to say – I think there are three types which are the best support and resistance levels you could find.  But it would take a long time to go into each type, what are the characteristics of each, what they mean from an order flow perspective, and how to trade each type.

So I am going to cover in today’s lesson, what are some of the most critical variables to look for when evaluating support and resistance levels.  If you can learn to spot these levels, read the price action and key variables before the market reaches these levels, you will greatly enhance your trading, by finding better entries, knowing how the market is likely to react off a level, and how to increase the probability of your trades.

By first learning to read these key variables which I will list below, they will provide you with a lot of information in terms of;
-how the order flow is relating to them
-how these levels will improve the probability your trade or rule based price action system
-how you can trade these key levels 

Note: I want to hear your feedback on this lesson, like what key points stood out for you, what you found useful, how you can apply this to your trading, or…even if you want to throw tomatoes at me, I want to hear your comments 🙂

I will start this lesson by talking about what are some key things to look for when evaluating support and resistance levels.  I will then describe with some details how each variable informs you of the order flow behind the price action.  Then I will go over some basic methods of how you can trade them.  I will also give examples to demonstrate how these elements work, then end with a brief overview of what we covered.


Key Things To Evaluate Support and Resistance Levels

If I had to list what are the key things I use to evaluate support and resistance levels, it would be the following;

1) How price reacted to this level in the past (held, became a breakout – pullback level, bounced violently or timidly off of it)
2) How significant is it (lower time frame, higher time frame, held for how long?)
3) How is price reacting or responding to it now
4) What is the speed or impulsiveness price is approaching it now
5) What is the price action context prior to this level

All of these things communicate information to me about the uniqueness of this level, how the buyers/sellers reacted towards this level in the past, how likely they will respond to it in the future, and what they are most likely to do at this level.


Zones & Areas

It should be noted that I do not consider support and resistance levels to be lines in the sand, but more of a ‘zone‘ or ‘area‘.  That means I do not consider a resistance level to be one price, but likely several pips on either side.  This could be due to differences in price feed, server time, what other traders think of that level, and how they would play it.

A scalper will more likely get as tight to the level as possible, but scalping orders rarely are large in volume or market movers.  However, a swing trader or large institution will likely be getting in at several levels, and the level you might be spotting may be one of them they are placing a large order at.

Because of this and all the different ways institutional players relate to these levels, support and resistance levels for me are zones or areas which could be anywhere from a few pips wide to 10+, maybe more depending upon the time frame the level relates to.

Obviously a level from a weekly time frame over years would have a little more play then an intraday level on the 1hr chart so take this into consideration.


What Each Variable Communicates

Although I could spend an entire treatise writing about all the things each variable above communicates, I will go over the key points here.

1) How Price Reacted To This Level In The Past – this is a big one as it tells me what the major players thought of this level.  Was the pair highly over/under valued here and it produced a violent reaction in the past?  If so, then the first time it comes back to this level, we can expect a strong reaction.  Why?

If the reaction off a level was fast, that translates into heavy buying/selling with some large player initiating the rejection.  This is followed by other players quickly rushing in to get as close to that price as possible, essentially chasing for the best price, but agreeing with the initial rejection.  These levels are defended with a lot of money, and if price does not come back for some time because it traveled fast and furious off this level, then the next time it gets there (especially if it’s the first time back), expect a strong reaction.

Exhibit A – Gold Daily Chart
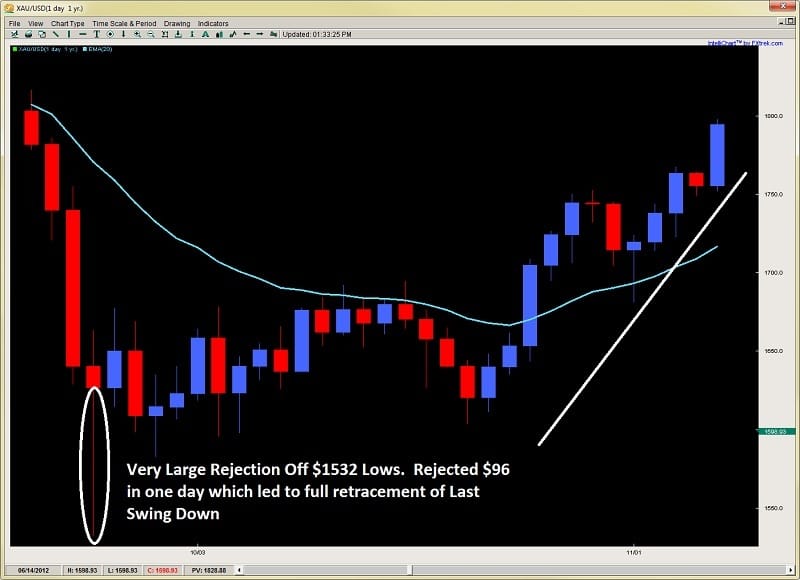
best support and resistance levels gold chart 1 2ndskiestrading.com

When gold sold off massively due to huge margin increases by the metals exchanges, it crumbled hard and everyone was wondering where the bottom was.  It found it eventually at $1532 where in one day, it opened at $1640, jumped up $23, dropped $130, then bounced $96 from the lows which was quite an amazing rejection inside one day.  This is a violent reaction, so traders were definitely taking notice of it the next time it approached this level.  Can you guess what happened when it got there again?


Second Approach Gold Chart
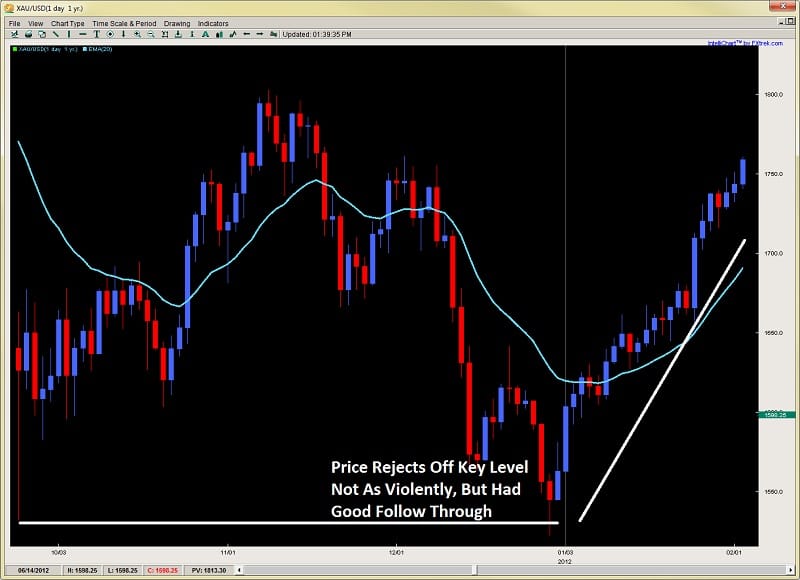
best support and resistance levels gold chart 2 2ndskiestrading.com

As you can see, price held this level with a tiny breach, then bounced the next 4 days in a row, suggesting strong follow up buying on this rejection.  The first time back usually is a slightly lesser bounce since many know of the level, and thus less traders are trapped (or surprised) from a violent rejection the first time around.  But usually, this level will hold.

Remember, this is one scenario of how price has related to it in the past.  All the other types of reactions communicate a different story.

2) How Significant Is It (lower time frame, higher time frame, etc) – this really has to do with time as all support and resistance levels have what I call a ‘time degradation‘ to them.  Simply put, traders have a memory, but they are more inclined to take recent information as more valuable then information a while ago, especially if they are short term traders.  Generally, higher time frame levels will dominate and last longer than lower time frame levels.  Also, when possible, I’m more interested in drawing levels that are more likely to maintain the trend as that is the more probable scenario.  I particularly relate to these when reading the impulsive vs. corrective moves in the market.

For more information about understanding impulsive vs. corrective moves, make sure to watch the video here.

But once you have established the trend according to the impulsive vs. corrective series, look for breakout pullback level where the trend continued, or major swing highs/lows where the trend paused and pulled back to.  These will often present great opportunities to get in with trend.

3) How Price is Reacting To It Now – Is price closing on a support level, and just sitting there, with smaller and smaller bounces off it? If so, a breakout through the level is more likely as there is no strong buyers able to push back, and the sellers continue to squeeze them out of the market.  Was there a strong pin bar reversal off this level?  If so, it could be telling you it will likely hold on a second attempt and start a reversal, hence look for an entry close to the level.  How price reacts to the level in the moment can tell you if it’s likely to hold or not, but this analysis should be done before it reaches the level.

Often times the market will demonstrate a price action reversal signal at these levels.  Keep in mind, this is the ‘effect‘ of how players responded to the level, not the cause.  Order flow was the initial cause, and the level was the location.  Everything else was a response to the initial reaction off this level.  Hence these price action triggers are often ‘secondary entries’ (or sub-optimal) regarding the level.  Sometimes a price action trigger, say a pin bar on a 4hr chart can be an engulfing or piercing bar on a 1hr chart.  So sometimes it helps to look at a lower time frame to see what the more micro responses off this level are, or what the price action context was leading up to it.

But no matter what, there will always be clues as to what the major players are doing at this level, and what the more likely scenario is.  Look for impulsiveness (strength) off the level, or weakness (corrective price action) off this level for initial clues.

4) What Is The Speed Or Impulsiveness Price Is Approaching The Level – this will really tell you a great deal of information whether a level is likely to hold or not.  If you are trading with trend, and with the move when it is approaching a level, how strong the move is heading into it, and what is the underlying characteristics behind the price action (speed, acceleration, etc), will tell you what is more probable.

If a level is an intraday level, or one from only a day ago, a really impulsive move is likely to break through it. If it’s a daily low or high, or a level that held for a week or longer, it will have a better chance of holding. Think of it like a moving object.  Consider the size of the object in relationship to what the obstacle in its way is.  Normally, force x acceleration (& mass) will tell us whether the obstacle ahead will cave or not. Unfortunately, we do not have exact information about the orders at a level, such as the number and size of them which would equate to mass and volume of the object.  Level 2 quotes would help in this fashion, but if you don’t have that, then what?

Why not use the other principles above, such as;
-how did price react there in the past
-how significant is it
-how is price reacting to it on first touch

Weigh those against the force, or impulsiveness of the move, and you’ll be able to get a better idea.


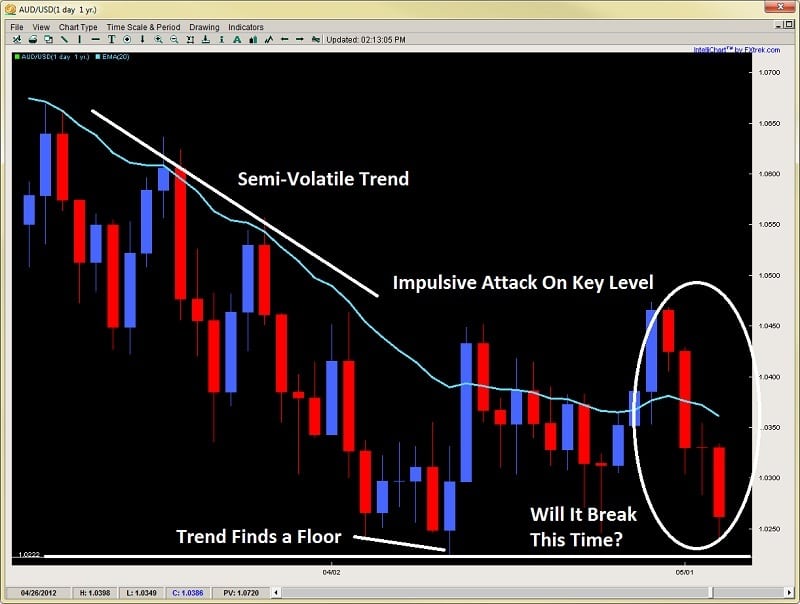
A good example would be the following chart below of the AUD/USD on the daily time frame
best support and resistance levels 2ndskiestrading.com AUDUSD chart 1

Price approaches the level with some volatility, as there are solid moves on both sides of the fence with bears maintaining control on the way down.  Price bounces off the level with a piercing pattern and then a second attempt forming a pin bar reversal.  But then after a small retrace, price attacks the level with vigor, selling off 4 days in a row, taking out the last 13 days gains.  Does this resonate strength to you?  Do you think it will break?  See the chart below

Exhibit B
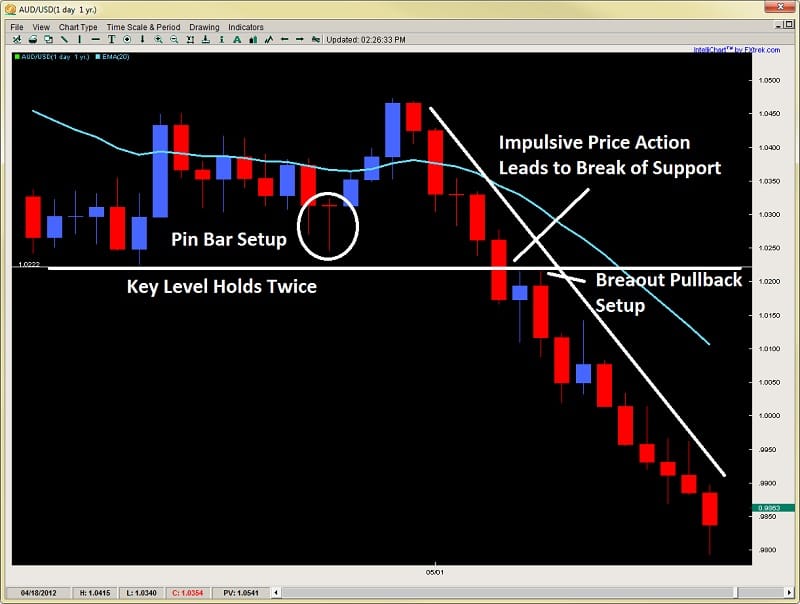
best support and resistance levels 2ndskiestrading.com AUDUSD chart 2

As you can see, price was exhibiting a lot of strength and impulsiveness heading into the support level. There were definitely some clues ahead of time this was going to break.  Such as how price barely lifted off the level each time, and attacked it twice without ever gaining much ground to the upside.

Keep in mind, the trend was already down leading up to it, so with trend traders used these pullbacks to get back in the trend.  The last time they said enough is enough, and went to take out the barriers at this level.  The buyers at the support level likely exhausted themselves on the first two rejections which failed to gain traction.

Putting all these components together would have communicated a breakout was likely, which would have helped your current short, or give you a second opportunity to get back in on a textbook breakout pullback setup for a high probability-low risk trade.


In Summary

So there you have a few key variables to look for in finding the best support and resistance levels. Remember, price action patterns form at these levels and are the ‘effect‘, not the cause of the move. They do communicate information to us as traders, what we are looking for is the price action context before we reach these key support and resistance levels.  Hence, it is these key levels where orders are being placed first.

Thus, by learning how to read the price action and the key variables I listed above, you can greatly improve your ability to spot good setups, improve your entries, placing trades where weak players are getting in, and the stronger players are looking to enter.

Please make sure to comment below, and click on the like buttons to share this article 🙂

For those wanting to learn to trade price action, get access to the traders forum, lifetime membership & more, visit my price action course page here.