Tag Archive for: pin bars

What’s Inside?

A key topic that orbits around price action trading is “how do I trade with candlestick wick patterns in the forex market?” The problem with this question is it comes with some misunderstandings about price action, order flow and what wicks really communicate.

The goal of today’s article is to give you a new perspective on trading price action wicks that most ‘internet gurus‘ won’t tell you. It is to give you an understanding of candlesticks, what they communicate and how to relate and trade them.

Understanding Candlesticks

We’ll give you this understanding and how to trade with candlesticks through 4 key points on forex price action wicks.

But before we get into trading wicks, we have to understand the foundation of where our approach comes from.

Key Point #1: The Difference Between Price Action & Candlestick Trading

I approach trading from a particular perspective that a) order flow is the proximate driver of price action, and b) all activated orders in the market are based upon ‘information‘.

NOTE: If you want to learn more about how I trade price action context, click here.

But to simplify it, trading price action ‘context‘ is trading the overall ‘structures‘ or ‘Gestalt‘ of the market. And you cannot get this through 1, 2 or 3 candles.

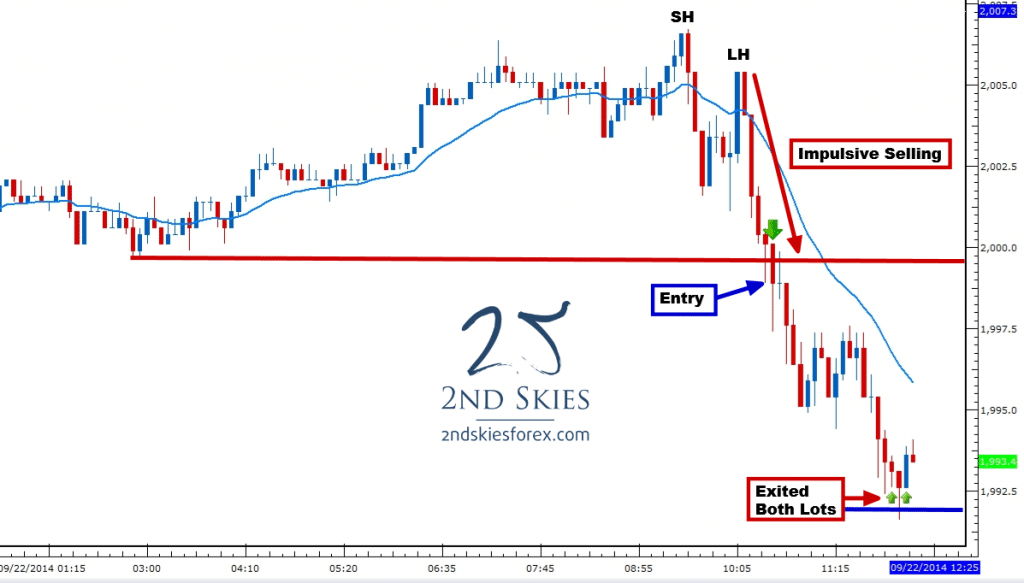
price action trading-sp500-sep-22-2ndskiesforex

People who trade based upon 1, 2 or 3 candlestick patterns, such as pin bars, or fakey’s, or engulfing bars are candlestick traders.

Fun Fact: The fakey pattern or setup, is really called the Hikkake pattern, given that name decades ago, which today many forex ‘gurus’ have renamed to make them sound like their own.

Regardless, candlestick pattern traders are not ‘price action traders‘. They are ‘candlestick traders’. Essentially, candlestick pattern traders believe 1, 2 or 3 candlesticks define the price action context and order flow in the market, and thus give you trade setups.

But ask yourself, why do many key support or resistance levels hold without a pin bar rejection. Why would it do that if the pin bar is such a superior tool for recognizing and ‘confirming‘ whether the key support or resistance level will hold? Why do banks, hedge funds, and prop traders place orders at particular prices well before a pin bar has ever formed, and not based upon the New York close daily charts?

NOTE: If you want to learn why a typical pin bar entry is a retail entry, click here.

When you start to ask these questions, the foundation for trading pin bars and candlestick patterns breaks down. That leaves you with trying to understand the underlying order flow in the market. And you do this by learning to read and trade price action context.

This is how we approach the market.

Now that we have this foundation, we can move on to how do we relate to forex price action wicks (or any wicks)?

Key Point #2: All Wicks Are Rejections of Value

When you look at the essence of what a wick represents in terms of the price action and order flow, you come to the conclusion that all wicks are a communication. They communicate that the order flow was rejecting that pricing and value.

If the market accepted it, it would close there, and remain there.

However, there is a ‘but’ in there. The ‘but’ is while wicks in the forex market = a rejection of value, they are not for defined periods of time or defined moves in pips.

What I mean by ‘not for defined periods of time‘ is a) beyond the close of their candle, and b) they are not going to define how long the market will reject that move or value from that moment forward.

What does give you this information? Price action context.

The goal of price action context is to give you a ‘probabilistic framework‘ for what the market is more likely to do. Wicks will not give you this information, nor give you a probabilistic framework for how to trade this.

Hence you have to come back to price action context.

price action context 2ndskiesforex

The most essential point to understand here is forex price action wicks (or any wicks) = a rejection, but we cannot understand how that rejection will manifest, so we have to take these as a grain of salt.

What this also means is that 1, 2 or 3 candlestick wicks will not ‘confirm’ a rejection of a specific kind (which is what we want if we’re going to trade said ‘confirmation’ or rejection).

If you want to understand why confirmation price action signals will crush your account, click here.

Key Point #3: Opening And Closing Of Candlesticks Do (And Do Not Matter)

Wait a minute, how can the opening and closing of candlesticks ‘matter’ and ‘not matter’? Let me explain.

In very ‘particular’ circumstances, the opening and closing of candlesticks will matter. Such as:

  1. if you are trading some sort of ‘opening’ gap strategy
  2. if you are trading specific types of breakouts
  3. if you are trading specific candlestick patterns
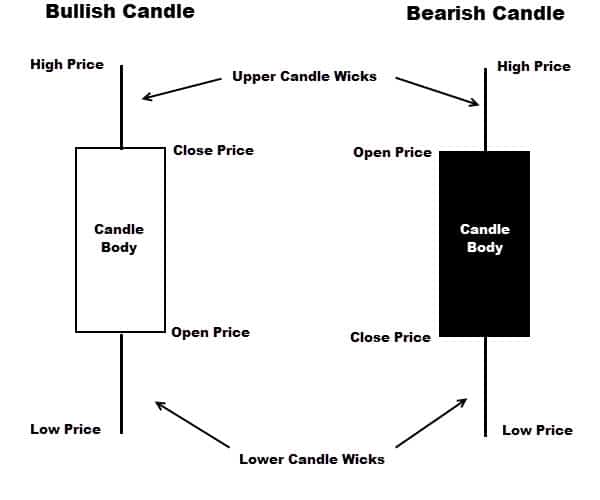
candlstick wicks rejection 2ndskiesforex

There could be a few more circumstances, but by and large, the majority of time, the opening and closing of candlesticks do not matter.

What matters more is order flow and price. This is why most institutions, hedge funds, and prop firms know their price ahead of time, regardless of the close. They know where they want to get in, and where they want to get out, regardless of the candle being open or closed.

Hence the opening and closing of candlesticks matter, but on a limited scale.

Key Point #4: How Do You Trade Forex Price Action Wicks?

There are many ways I relate to forex price action wicks (or any wicks) in my trading, but I’ll give you a couple wick trading strategies below.

Trading Strategy For Wicks #1: With Trend Wicks Will Be More Reliable (or ‘probable’) Trading With Trend vs Counter Trend

If a wick represents on a base level some sort of ‘rejection’, which side is most likely to ‘reject’ the price or value? The with trend players, or counter trend players?

With trend is the answer. With trend players are more often controlling the market and order flow, so they’re more likely to reject a price effectively cause they’re largely in control.

I personally like seeing with trend rejections on pullbacks heading into a level because they are showing a more ‘probabilistic framework’ of order flow in the market.

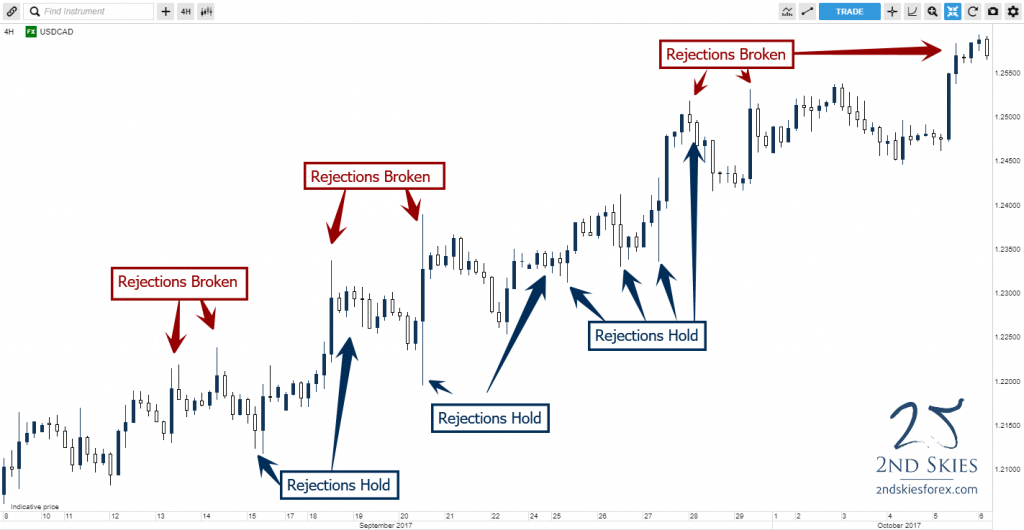
Below is an example of a good chart showing this on the USDCAD 4hr chart.

forex price action wicks holding with trend 2ndskiesforex

Notice how the majority of the wicks and rejections with trend hold, while the counter-trend rejections fail?

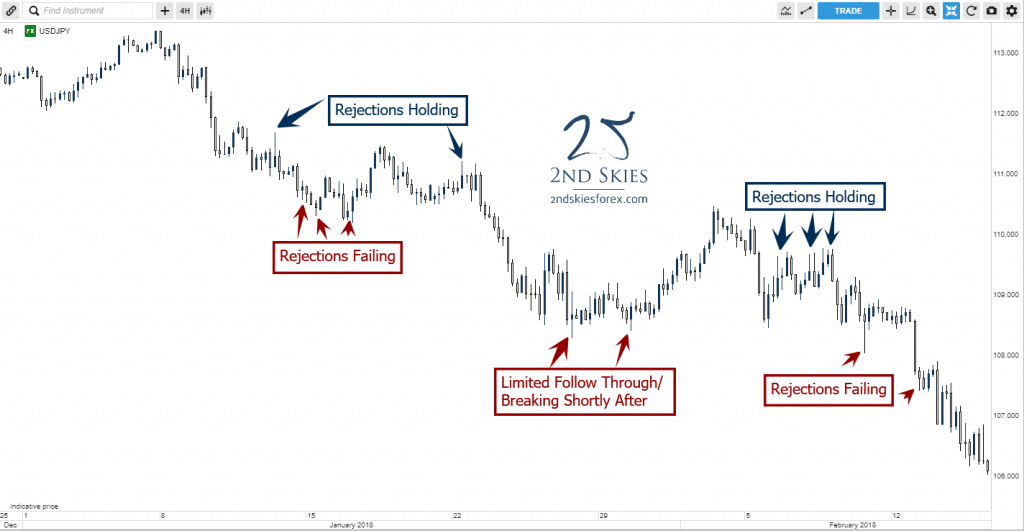
Below is another good example of a chart on the 4hr USDJPY chart.

forex price action wicks holding with trend v2 2ndskiesforex

Hence when trading, if you are trading with trend, wicks rejecting price in your favor make your trade more ‘probable’, while trading counter trend are less ‘probable’.

If you wan to learn more about trading with a probabilistic mindset, click here.

Trading Strategy For Wicks #2: Clean Wick Rejections Off Key Support or Resistance Levels Are Best

What do you mean by a ‘clean’ rejection or wick off of a key support or resistance level?

While I relate to support and resistance as ‘zones‘ of order flow, sometimes they line up super well to where you can clearly see price is rejecting off a very specific price and value.

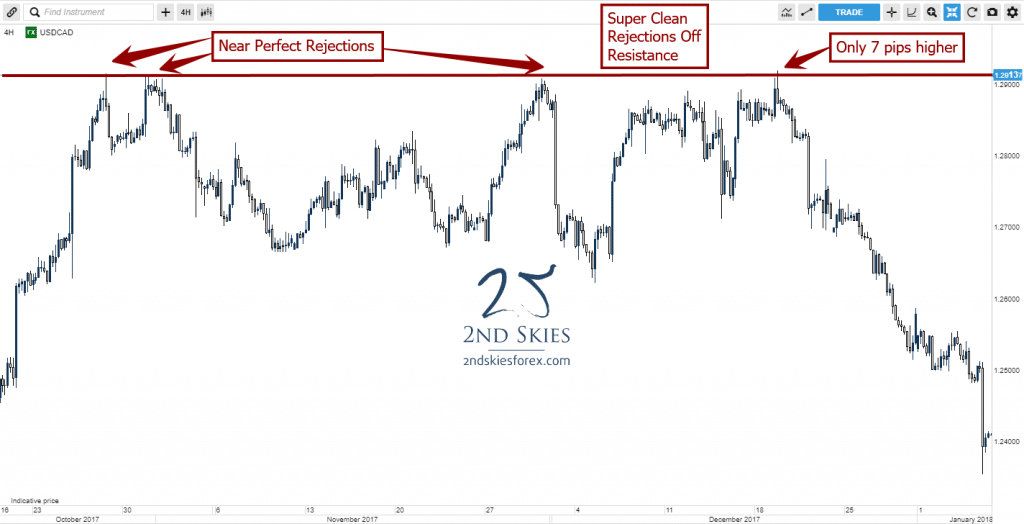
Case in point, take a look at the USDCAD 4hr chart from mid-October last year to mid-Jan this year (~3 mos).

super clean rejections wicks off of resistance 2ndskiesforex

You can see in the chart above, the price action rejected off of the key resistance level near 1.2913 six times in a 3 month period with almost every rejection happening within a few pips of each other, and the biggest break being only 7 pips.

When price rejects very ‘cleanly‘ off of a key support or resistance level, they become more ‘probable‘ of a legitimate rejection.

Not all charts and key levels will look like this, but they do often in many price action structures, and can be good for building your ‘probabilistic framework‘ for understanding price action context and the order flow behind it.

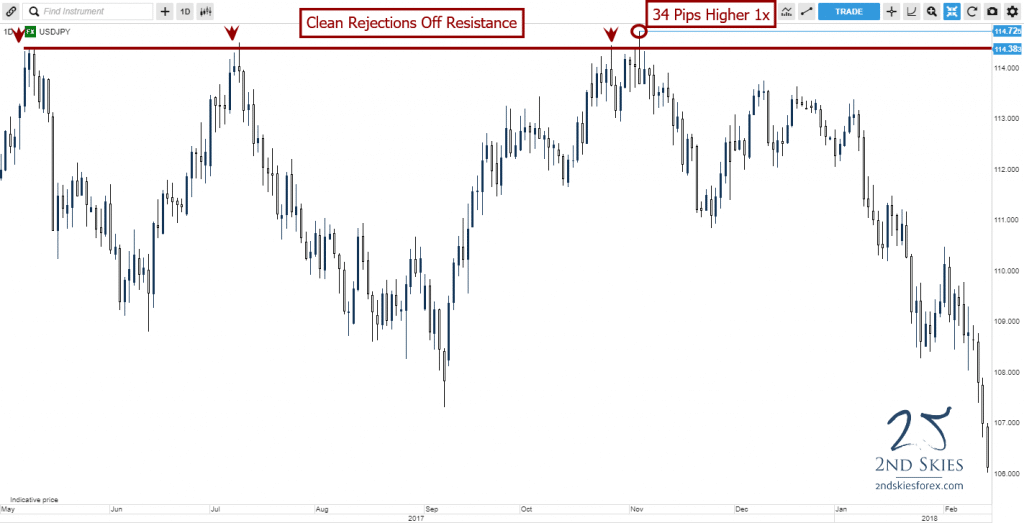
You can see another example of this below with the USDJPY daily chart.

clean rejections wicks off of resistance 2ndskiesforex

Notice how 3 of the 4 rejections were almost at the same price with only one breaking by a small amount?

There are many other ways to understand wicks and rejections in the price action, but these are two good methods to work with that I use personally and trade profitably with my own money.

In Summary

Forex price action trading wicks (or wicks in any market) are important to understand, particularly from the perspective of order flow and price action context. Wicks ‘communicate‘ at a base level ‘rejection‘, but they do not by nature determine any rejection to follow through.

However there are ways you can use wicks in your trading price action, particularly the two methods I mentioned:

  1. with trend wicks add to your ‘probabilistic framework’ better than counter trend wicks
  2. clean wick rejections off of key support and resistance levels also add to your ‘probabilistic framework’ for trading

Now Your Turn

What did you learn from this free trading article? Do you feel you understand candlestick trading wicks, rejections and how they work in forex applications?

Make sure to leave your comment below, along with share this via Twitter or Facebook with those you think can benefit from this.

Key Talking Points:

  • False Breaks Offer Great Price Action Trading Setups
  • You Can Trade the False Break Strategy with Pin Bars and Engulfing Bars
  • Look for False Break Setups Trading With the Trend

Ever tried to enter on a forex false breakout breakout setup, only to have the trade immediately reverse on you? I’m guessing this has happened to you many times (present trader included).
With the market volatility declining over the last several years, false breaks can and will happen all the time. The key to avoid getting stopped out, and actually profit from these false break setups, is to understand the price action context which often precedes them.
In this two part article series, I will begin today’s discussion by defining a false break. Next, I’ll go over a common false break setup, which is trading the false break with trend. Then I will go over a fundamental false breakout strategy, and conclude by recapping the key points.
What is A False Break?
I would prefer to define a false break as one of the following two scenarios: 

  1. A break above/below a prior candle that fails to close above/below that candle
  2. A break above/below a key level, quickly reversing that level, and sparking a counter-trend move

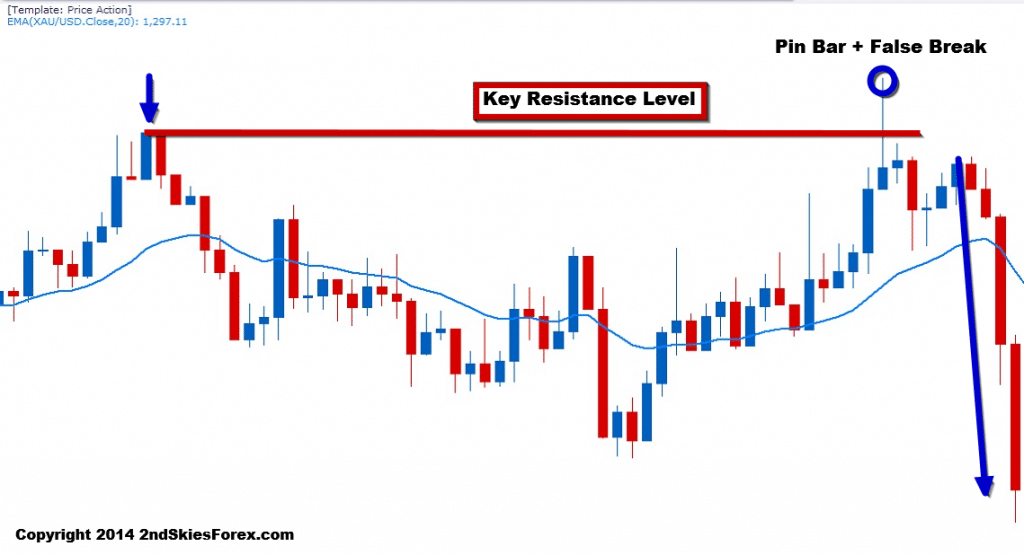
Below is an example of the first type with a pin bar + false break:
trading the false break strategy 2ndskiesforex c1
In the chart above, you can see the arrow to the top left, showing a bullish move running into resistance. The pair then settles back, and makes a second attempt to take out this key level.
But on the top right, you can see it forms a pin bar + false break.
From an Order Flow Perspective
Looking at this from an order flow perspective, the bulls were in control leading up to the level, and were able to push past it. Either there was massive profit taking on their part, or they ran into heavy sellers a few layers deep behind the level.
Regardless, the sellers over-whelmed the buyers, and pushed the pair back below the key resistance level. After a second attempt to regain the level, the sellers realizing they had control, sold even more, pushing the pair down impulsively.
Trapping Traders
In most false breaks, there are ‘trapped traders‘, meaning traders who are caught long when the pair is about to go short, or vice versa. Those trapped traders once the trade goes negative, will likely be stopped out, & further fuel the counter-trend move.
The more savvy traders will exit manually when they realize they are trapped, while the slower traders will likely get hit for the full stop. There are price action clues to tell when you’ve been trapped, but that is for another article.
Trading The False Break Setup With Trend
It should not be surprising, one of the best false break setups occur when trading with the trend. This is because the underlying order flow is heavily imbalanced, meaning it’s heavily bullish or bearish.
When a false break setup forms counter-trend, it usually runs into buyers or sellers who are happy to take the pullback getting a better price. Their overall strength in the market makes it harder for counter-trend false breaks to be maintained.
This is why false breaks present such great trade opportunities.
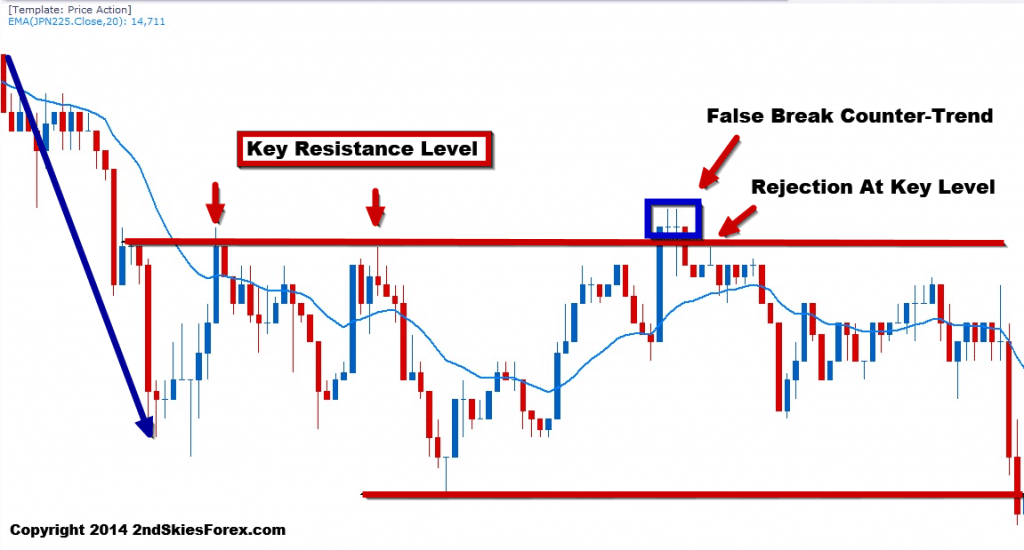
Below is a classic example of trading the false break setup with trend:
trading the false break strategy 2ndskiesforex c3
In the chart above, starting with the top left, we can see the heavy impulsive selling. Eventually this leads to a bounce which hits the key resistance level 2x (marked by two red arrows). After forming a new low (red line at bottom), the pair bounces to retest the bears at the same resistance level.
Now note how the pair breaks above this level with a really large blue bar, closing at the highs. Ask yourself, if the bulls were really in control, how come they did not produce any follow through?
The next two doji candles showed no real strength or follow up buying, which should have been a warning sign to any bulls already long. Bears wanting to trade with trend, should have been looking for the false break and close below which they got on the 3rd candle.
Entry, Stop & Take Profit
With such a clearly defined trend and resistance level, there are two general entry techniques;

  1. Sell on Break back below the key level
  2. Wait for pullback setup to the key level

More aggressive traders who feel confident in their price action skills may sell on the break back below the key level. This may or may not offer the best price, but you may not get a second chance to enter if the sellers came in hard on the false break.
More conservative traders can wait for a pullback setup to the key level. If the false break is real along with the level, then the trade should hold and not go much into the negative.
I generally recommend placing the stop above the high (or below the low) of the false break by a few pips, depending upon the volatility and liquidity of the instrument.
The first target should be the other end of the consolidation. If you want to go for multiple targets, then the next key support or resistance level would be suggested.
To Recap
In today’s forex false breakout article, I talked about the price action and order flow behind a false break setup, and why it can be a powerful trade opportunity. I discussed the two types of false breaks and how to generally define one.
Lastly, I covered why to look for with trend setups trading the false break, giving the entry, stop and take profit methods.
When you learn to read price action in real time, you will begin to spot these false break setups more easily. As you get skilled in identifying them, you will avoid the common traps, and profit heavily from them as they offer great opportunities.
In the second part of this article, I will talk about using a false breakout strategy with pin bars and engulfing bars.

Today I am writing a potent article about pre-qualifying forex breakouts, particularly understanding them from a price action & order flow perspective.  When you pre-qualify a breakout, you put yourself in a position to identify it as a high or low probability breakout. To do this however, you have to understand what makes a successful forex breakout trade both from a price action and order flow perspective.

In my prior article 3 Keys for Identifying Breakouts, I talk about 3 such parameters for pre-qualifying forex breakouts.  They are;

1) Well Defined Support/Resistance Level

2) Pre-Breakout Squeeze/Pressure/Tension

3) 20ema Carry

When you can identify these prior to a potential breakout, you highly increase the probabilities of trading a successful breakout. But let’s dig into this a little deeper as to why from a price action and order flow perspective.

Order Flow Behind Breakouts
From an order flow perspective, breakouts generally start with an initial balance between buyers and sellers.  This usually results in a range of sorts, with two clearly defined support and resistance levels. When you get several touches on these levels, this clearly communicates where both sides of the players are parked (and likely their stops as well).  The more touches on these barriers, the more players are brought in.

Those who are bullish will get in on the bounces off support, while bearish players on rejections off resistance.

However as time goes on, tension starts to build between the two camps as someone will eventually want to take control. In almost all cases, the side with the largest number of orders and money behind their camp, will win this tug of war.

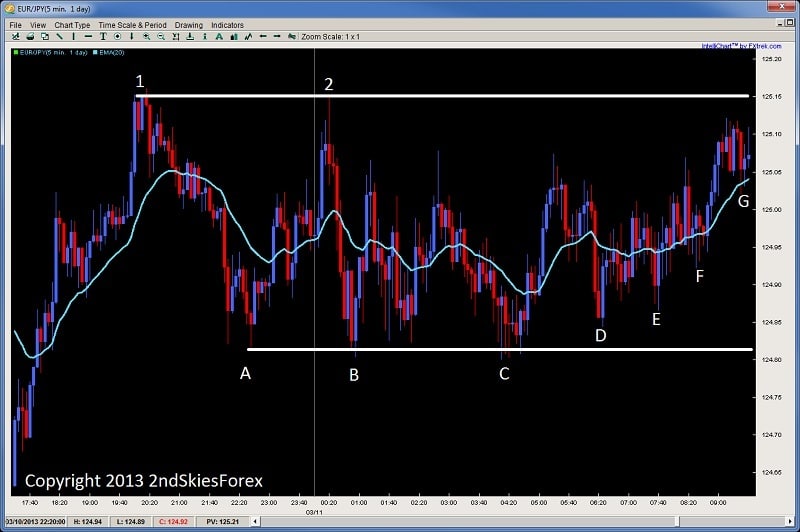
This usually manifests in a higher low (HL) or lower high (LH) being formed inside the range, and more aggressive pushes towards the other line in the sand, while less or no touches on the other side, almost as if the sellers or buyers could not reach the other support or resistance level.  It usually looks something like the chart below.

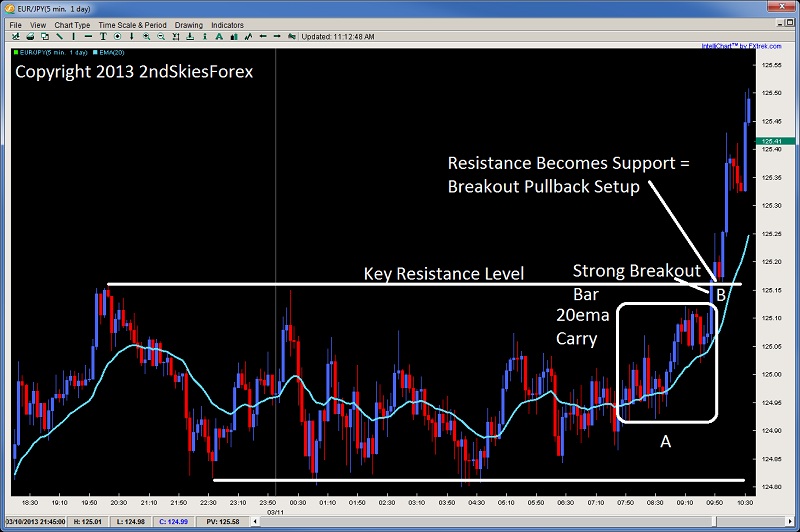
EURJPY 5M Chart
price action breakouts and order flow chris capre 2ndskiestrading.com eurjpy

Looking at the chart above, you’ll see a clearly defined support and resistance level with a minimum of two touches on each side. This tips us off to where the bears and bulls are parked on the chart with stops just above/below the levels.

Now you will notice each rejection at A & B minimally went up to 125.05 before coming back down and touching the same support level at 124.80.

C pushes price back up to 125.05, but this time the rejection fails to reach 124.80, and can only make it to 124.85.  From an order flow perspective, the buyers are starting to get more aggressive and confident their level will hold, so they are buying up higher (at a more expensive price).

The next pullback at E is also higher, so we are seeing a continual change of hands by the bulls buying higher from support (and their defenses at 124.80).

Now notice every push up from B, C, D, and E only makes it to a maximum price of 125.05.  But with F, it goes to 125.10. There were probably some intraday bears shorting at 125.05 (now stopped out), while the rest were still short at 125.15.

Now that price is pushing up towards the resistance without ever touching the support, this communicates the bulls are taking control of the price action with more orders and money, and will likely continue to squeeze the bears out.

This price action squeeze takes out smart sellers early as they recognize they are about to get stopped out if they stay in. The slower players stay in until they are at breakeven, while the slowest and most stubborn bears stay in till they are stopped out.

EURJPY 5M Breakout Chart
price action breakouts and order flow chris capre 2ndskiestrading.com eurjpy 5m breakout chart

Using the chart above, we see the final stage of the breakout which is the 20ema carry in Box A.  This “20ema carry” is a common price action formation prior to a good breakout, as it shows;

a) the mathematical representation of price gaining

and

b) gives bulls who haven’t entered a chance to get in prior to the breakout

This is followed by a strong breakout bar at B. This large bar should be curious, for why would bulls buy up so strongly heading into a resistance level if they were worried about sellers parked there.  Usually, institutional traders can smell an upcoming breakout like this, so will push really hard to take out any stops as they go after the barrier.

A “strong breakout bar” is usually a really good sign the breakout will continue as it means stops were tripped above the resistance level, and price jumped aggressively in one bar.  More ideal is if it has a good “clearing distance“, for if it does, then it increases the chances all the stops were tripped by going further away from the resistance level where most of the stops were near.

Tripping The Stops
It is this latter part – the stops getting tripped, which helps fuel the breakout even further, because those bears who were short now have to buy back, and this buying back to exit out helps further fuel the upside breakout. This is why if you ever watch the prices on your actual platform during a breakout like this, it generally reads (using 4 decimal places);

1.2999
1.3000
1.3001
1.3002
1.3003 (stops tripped)
1.3006!

You can always tell where the stops were parked and tripped, because price then jumps a few pips in a shot. The reason for this is – there were no sellers between 1.3003 and 1.3006, meaning the brokers could not print a price there since there were not enough orders there to hold that price. The stops being tripped at 1.3003 were sellers who now had to buy back, and when they did, they helped to push the next market price up 3 pips in a single tick or print.

When you see this, it usually means the breakout will likely continue – as long as you have done your pre-qualifying ahead of time.

One Final Note
Like all things, we have to pre-qualify a forex breakout using several price action characteristics ahead of time. The ones listed above are just a few of the ones we use in my Course, and there are several others which will clue you off and enhance the probability of the breakout being successful or not.

When you can pre-qualify them correctly, you will find breakouts quite easy to trade and accuracy levels around 60-70% as this is what my more profitable students are doing consistently just trading breakouts.

But, you have to pre-qualify them, like any price action setup.  We never just trade them in isolation, as we are not pattern traders. We are price action traders, and we always trade setups & price action in context.

Any good system can perform badly without the proper context. Pin bars can be a highly effective system, if traded in context. But without understanding the type of trend, or volatility levels, you will likely lose money trading pin bars in isolation, even if you trade them at key chart levels.

Thus, we are never just trading patterns on a chart. We are always trading them in context, and this is exactly the same for breakouts, so always pre-qualify them ahead of time.

Look for the three characteristics above, try to trade them with trend more often then counter-trend, and you’ll find they can offer highly profitable trades, with some of the better reward to risk ratios out there, such as 3, 4, 5, or many reaching 7 or 9:1 reward to risk ratios.

There seems to be some fascination with newer/beginning traders to find this perfect setup, this small set of circumstances that give price action the appearance of a great trade opportunity. You’ve probably heard about these patterns and setups before, often referred to as Pin Bars, Engulfing Bars, Inside Bars, etc.

Beginning traders become hypnotized, thinking these price action patterns are all you need learn to trade the market, as if trading were a fashion contest, and your goal is to find the best dressed setup.

The problem is, this is a really confined view as these patterns are more often the result of order flow – not the cause of it.
 
A Means, Not the Reason
These price action setups discussed above, are a means to get into the market, not the reason why you should be. And it’s often the case, they are the secondary reason why you should be entering the market.
The reason why you should be getting into the market, is because your understanding of the price action & order flow in the overall market, gives you an over-weighted picture as to a clear direction in the market.

This direction could be for 20 minutes, hours, or even days.  The amount of time it will likely maintain that direction is not important.  That the price action gives you an over-weighted picture of the direction IS!

And when this happens, there is a trade opportunity.  If that opportunity offers you a good mathematical reward/risk play, then you should be trading it – not because of some picture perfect setup.

trading is not a beauty contest 2ndskiestrading.com jan 21st

 
Trading is Not A Fashion Contest
How many times have you seen a picture perfect setup that completely failed?  I’m willing to bet dozens of times, and if you trade long enough, hundreds or thousands of times.
Why is that?
Because trading is not a fashion contest where you are looking for the best dressed setup.  Because price action setups can and will fail, which should communicate to you – not to become fascinated with finding the perfect price action setup.
What it should mean, is you want to develop your ability to read the overall picture of the market, understand the order flow behind it, learn to read the impulsive and corrective price action.  Then, look for an over-weighted scenario.  Once you find it, check the math to see if it’s favorable.  If so, then take the trade.
 
Missing High Quality Signals
If you are always on the hunt for the perfect setup or trade, you will likely be completely missing high quality signals passing by right in front of you.
The greatest mistake of higher time frame traders is they often do not take great trades that are right in front of them, because they are waiting for the ‘perfect‘ setup – one that will hit them over the head.
The problem is in passing up these trades, they are also passing up high quality signals that offer a mathematical edge and profits.

missing good trade opportunities

Ironically, the greatest fallacy of intraday traders is they will often take trades that are not there, or not of high quality.  Although it may seem like the former is better than the latter, both are the same!
The higher time frame trader makes a lot less profit because they pass up really high quality signals, looking for their perfect match.
Meanwhile, the intraday trader while often having more profits, generally has slightly more losses, because they are taking trades that are not there.  Their upside is higher for executing their edge more, but the extra losses pull them back.
Thus, when you really see this clearly, these are two sides of the same coin!  The trick is to find the balance and wisdom of the two, not to stay on one side of it.  This is the knot of trading you have to untie.
 
A Fantasy World
Spending your time looking for the perfect setup is living in a fantasy world.  It’s like looking for the perfect partner – how many people have you really met that have one? How many people have you met thought they found one, & were completely wrong? Food for thought – but trading is not a fashion contest, and it’s not about looking for the perfect setup.
 
Same Setup – Different Result
There are many times several of my price action traders spot the same exact setup, yet end up with completely different results.
How could that be?

same setup different results 2ndskiestrading.com

Because they managed the trade differently. One took profits a little early (but still ended up profitable), while the other caught a huge portion of the move.
Although it may seem like this one trade may not mean much – it means a lot if its repeated.
When trader A encounters a series of losses (and you will, regardless of your strategy), their downside will be more severe and they will take more time to recover.  However when trader B encounters the same downside period, their recovering will be faster, because they padded on more alpha to their trading account.  For them, it only takes a few large wins to erase a lot of losses.
Keep in mind, they both spotted the ‘perfect price action setup‘, yet they both had different levels of profits.
What was the difference?  In how they managed the trade.
This should be communicating to you, what is far more important than finding the ‘perfect’ price action setup, is learning how to manage the trade.  And this really comes down to three things;
1) Understanding Risk Management
2) Learning to Read Price Action In Real Time
3) Managing Your Emotions/Mental State
bells ringing in your head 2ndskiestrading.com
Perhaps you can find the perfect setup, but fail to do the three above, & your perfect setup is powerless to deliver consistent profits.  Bells should be going off in your head now about what you should be spending your time studying.  It’s not how to spot a pin bar, or engulfing bar, or some other magical bar.  It’s about setups, price action and context.
These pin bars, engulfing bars, or any bars are easy to find, and take little mental effort.  The learning process for this should be short.
But the learning process for the three things I listed above prior, should be never-ending.
I understand why many of you have made this mistake.  There are these so called ‘authorities‘ and ‘masters‘ (notice self-labeled as no peer will call them that), who claim you only need 3 of these ‘setups’ to understand the market.  That these great setups only occur on higher time frames, that intraday price action trading is to be loathed, that accuracy and profitability has a linear relationship with time frames.
Ah yes, and don’t forget the three golden setups – how convenient!  As if a market with over a million participants, composed of retail & institutional traders, hedge funds, banks/brokers, pension funds, HFTs, intraday traders, swing traders, long term position traders, etc. are all subdued by these overlords of price action patterns.
High quality signals occur on every time frame, and there are profitable traders across the world trading on almost every time frame.  Intraday price action trading is not to be loathed – that is just a personal feeling of some, while a ATM machine for others.
Who is right?  Neither – thus don’t hate intraday trading because it doesn’t work for you. The greatest mistake a trader can do, is to think their world and thoughts about reality – ARE REALITY!  As if your wisdom and insight is so brilliant, so total, so complete, that it has a monopoly on the truth about trading.
Does that sound reasonable to you?  Or does it seem more likely there are many ways to trade successfully, and the best way is what’s comfortable for you.
Just remember, what may be comfortable for you, may not be for another, and neither one individually is reality by itself.

obi wan kenobi 2ndskiestrading.com

Heed the wisdom of Obi-Wan Kenobi who once said, ‘Only a Sith sees in absolutes‘. Don’t be the Sith in trading, or follow a Sith.
Find wisdom in things, then find what is most comfortable for you, while constantly challenging yourself to take things to the next level.  Rarely ever where you start this journey (both in trading and in life) is where you end up.  Thus remember, trading is not a fashion contest, but it is about managing risk, your mental state, and learning how to read and trade price action in real time.
 

If you think this article is going to be about learning a price action setup, you’re wrong, but it will be about something more powerful.  For your future, for your learning process, and for your sanity, keep reading this article if you are not consistently profitable.

Of all my articles, the most popular and commented ones are always on some specific setup or system.

Why?
hunting for the one system setups, price action and context 2ndskiestrading.com

Because almost all of you have been hunting for the one system, that edge which will turn your trading around.  That edge which will print money into your account day after day, week after week without much effort.  You’ve probably amassed dozens of patterns and systems, yet still aren’t making money.

Sound familiar?

If so, don’t worry – that was me 12 years ago.

But I think it points to a problem for those hunting through forums, websites and videos looking for your pot of gold.  All of your focus and energy has been on finding a ‘system‘ or ‘price action setup‘ that makes money.

Sure, everyone wants their own ATM machine – who doesn’t?  But what is also going on is you want the market de-mystified.  You want trading to be simple and easy, i.e. thinking three simple setups will solve all your trading problems and help you understand the market.

Regardless, this underlies two things which will trip you up in trading;

1) The fallacy three simple price action setups will consistently make you money if you have good money management.

2) Being uncomfortable with uncertainty.

Today’s article will be focused on the first point, and the next article will be focused on the latter.

Three Simple Setups?  Really?
To begin, it is a complete fallacy that if you learn what a pin bar, inside bar and a fakeout system is + good money management = making money…that you understand and can trade price action.

How convenient that a market which has brought traders to its knees, crying, jumping out of windows after losing fortunes, that three simple setups and good money management (plus a little psychology) is all you need to be a profitable trader.

If that was the case, why isn’t everyone doing it?

Why are banks spending thousands of dollars, and months, if not years on end, training their traders, when there is such a conveniently packaged solution available?

My programmer was recently at a algo conference with some of the top hedge funds.  He told me they are spending hundreds of thousands of dollars re-programming their algos every 12-24 months to keep a competitive edge.

Why would they do this if they could just learn what a pin bar was, inside bar and fakeout setup is? Wouldn’t that be easier?

Newbie traders want to hear the market can be simplified into three price action setups, that trading with the trend and good money management is all you need.  It perpetuates a dream which is actually a false reality.

dreaming of money 2ndskiestrading.com
This is why I have always talked about learning to read the price action in real time, that you cannot rely upon systems alone.  Yes, a pin bar can be a highly effective method for trading various price action situations.  But it always has to be taken in Context.

Two Scenarios
To demonstrate this point, lets take two scenarios;

1)  A bullish pin bar forms after a long trending move.  This trending move ended with an exhaustive candle which then proceeded to form a double bottom off a key support level.  The pin bar closed bullish and formed on the 2nd bottom also creating a 3 pip breakout below the lows.  Am I going to buy that pin bar if I get a corrective pullback towards the double bottom?

Absolutely!

I see that – I’m going to buy that.  The pin bar was a very good setup and price action cue for me.  But remember, pin bars can be both cause and the result of order flow.

However, we have the other pin bar scenario….

2) Price action has dropped 1000pips in the last two days.  Then in the middle of the Tokyo session forms a tiny pin bar on the 4hr time frame that closes bearish.  Am I going to buy that pin bar expecting the price to reverse?  NO!

Why???

Context!

You have to understand, there is nothing wrong with the pin bar by itself.  It can be a highly effective signal, or it can lead to losses.

What is the difference?

It’s not money management, or trading with the trend, or your psychology.

It’s the context with which it forms.  But to understand these differences, you have to learn to read price action in real time, and what it has done in the past around those levels.  That is the context you have to learn how to read.

Passive vs. Active Learning
To be sitting there passively, waiting for days on end for your three simple price action setups is trading in passive mode and flat out boring.  And boredom will actually interfere with your learning process.

boredom interferes with learning process 2ndskiestrading.com

If you can only find one setup a week, you’re not looking hard enough because there are plenty.

There is no active learning, and active learning is what you need.  In active learning, you are engaging your resources, your current level of knowledge and applying it.  In passive learning, you are not engaging any of your knowledge and seeing how it works in real time, learning from the feedback loop called the markets.

If you are sitting on the sidelines for days on end, just waiting for your three simple setups, you’re wasting your time.  You could be learning, trying, studying, and participating in the market which is what facilitates learning.

I didn’t just learn what an inside bar was and then trade it based on what it should do.  I spent dozens of hours studying 1000’s of inside bars and pin bars, to see what was different between them all, and how did price action form after each unique one.

I have pages of notes about pin bars, how each one forms, its size in relation to the prior bar, where it forms in relation to the prior bar, in the trend, near the 20ema, in relation to the surrounding price action, support/resistance levels, etc, etc, etc.

I don’t just trade pin bars like a robot.  I trade them in context, and that is what gives me an edge, to be able to read the price action in real time, and what the market has done around current levels.

A Student
One of my students wrote just yesterday on this subject:

I am at that point where I know I want to be a full time trader. I absolutely believe that the strategies, models and methods we are taught in this course can lead to profitability, because I’m using them everyday and they lead to good profitable trades.

However, I have moved away from just seeing a pin bar or some other signal and just pulling the trigger, because I have moved toward understanding price action the way Chris talks about in his lessons, like he has done on breakouts, the aussie price action, the USDX, etc.

I believe that as traders we can trade these strategies and make some money, but we will not evolve as traders if we don’t begin to read and understand the price action that is occurring around these different setups.

trading ideas 2ndskiestrading.com

When I read this, I was nothing but smiles as the light went on.  This student gets it, and gets what I have been teaching.  He understands that pin bars, inside bars, and all the other methods have a purpose – but they are not the road and vehicle towards profitable trading.

Although they are highly informative about what the order flow is behind the price action, he understands they are both cause and result.  This means he understands sometimes they are the cause of order flow, and other times, they are the ‘result’ of order flow.  They are not simply just one or the other.

It also means he is spending his time learning to read the price action in real time, to understand what kinds of order flow would create such price action.  He is not passively waiting for setups, and then pulling the trigger like an automaton.  He understands that these setups have to be taken in context.

In Summary
Don’t waste your days on end in waiting mode for your simple three setups to occur.  Understand three simple setups will not lead you to profitable trading, nor understanding price action.  If it did, everyone would be doing it and that is all they would be teaching at banks and hedge funds.

Understand trading price action means learning to read price action in real time.  It means being an active and deliberate learner.

Understand that price action setups are highly valuable tools – but they have to be taken in context.  You have to learn to read what kind of order flow would create such price action, and how to trade this flow.

I hope this helps and that it changes the way you look at price action and your learning process.

Please make sure to leave your comment, like and share this post.

Kind Regards,
Chris

This lesson is focused on one of the least discussed topics in trading – price action. In this forex price action training video we teach you how to identify a critical component of price action – Impulsive vs. Corrective moves.