Tag Archive for: price action trading

Earlier this week I had a private skype call with a profitable student of mine (we’ll call him ‘Joe‘ for the purposes of privacy & this article). One of the major benefits of becoming a member of our price action course is you get a free skype call with me whereby I analyze your trading performance across a baseline of trades, and give you direct feedback across 20+ metrics to find leaks, patterns of your behavior that are hurting/helping your performance, and how we can refine your trading plan to make more money.

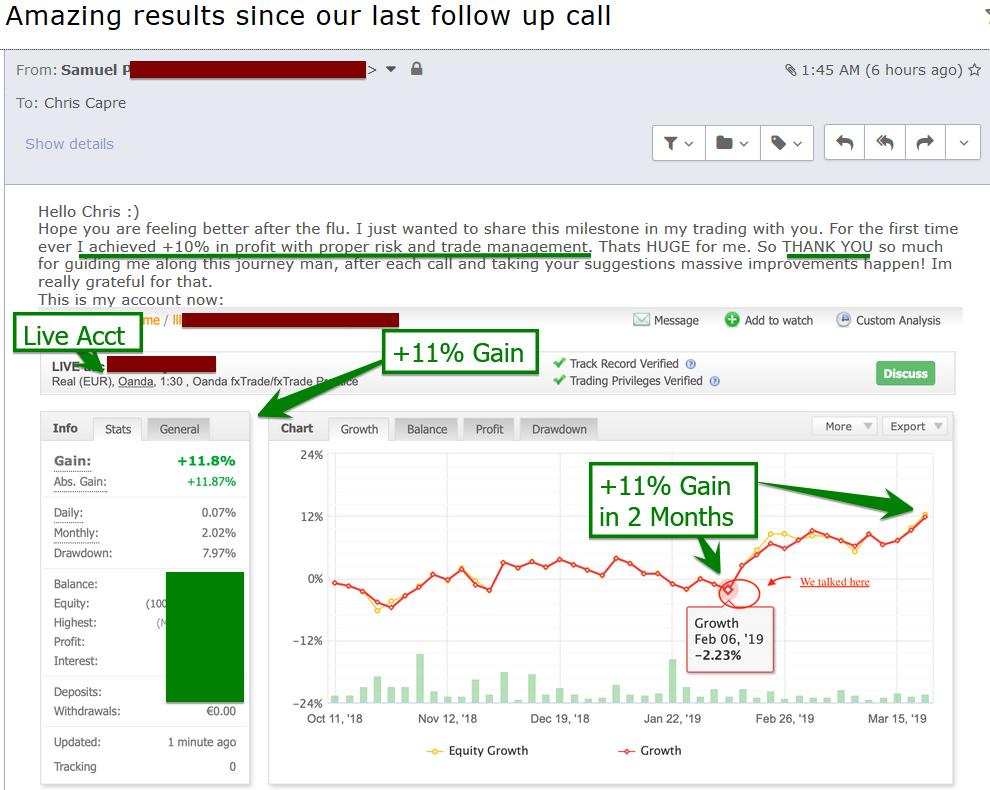
I recently highlighted one profitable student (Sam) who made +11% profit over 2 months using exceptional risk management (see image below):
sam-profitable-student-2ndskiesforex

Now if you look at the performance and equity graph above, Sam was a consistently break even trader until we did our skype call analyzing his performance and giving concrete recommendations for how to improve his trading. Two months later, he had a breakout performance with his most profitable months of trading to date.

Meet Joe Black – The Profitable Trader

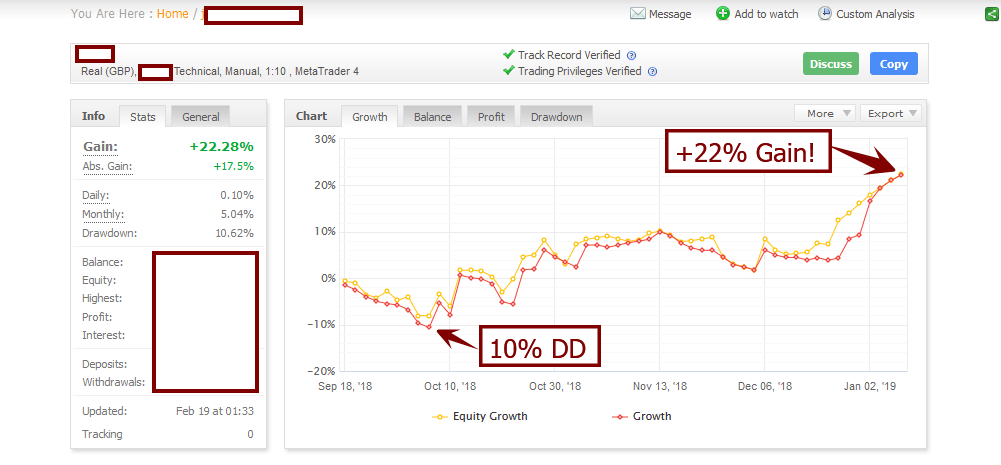
Joe, whom we talked about earlier, is also a profitable student of mine who had performed exceptionally well from mid-September till the end of the year, making +22% profit over 4 months, even while having a 10% draw-down!

Here is a snapshot of his equity graph during that time period.
joe-profitable-trader-2ndskiesforex-equity-graph

Now before we analyze his performance since then, I’d like to point out the stats and highlights:

Total Profit/Loss: +22.25% (shown above in equity graph)
Avg. +R Per Trade: +3.23 (image below)
Total # of Trades: 149 trades (image below)
NOTE: 149 trades over 4 mos = 37 trades per month – try getting that many trades and feedback trading pin bars and confirmation price action signals)
% Accuracy: 33.6% (image below)
Profit Factor: 1.63 (image below)
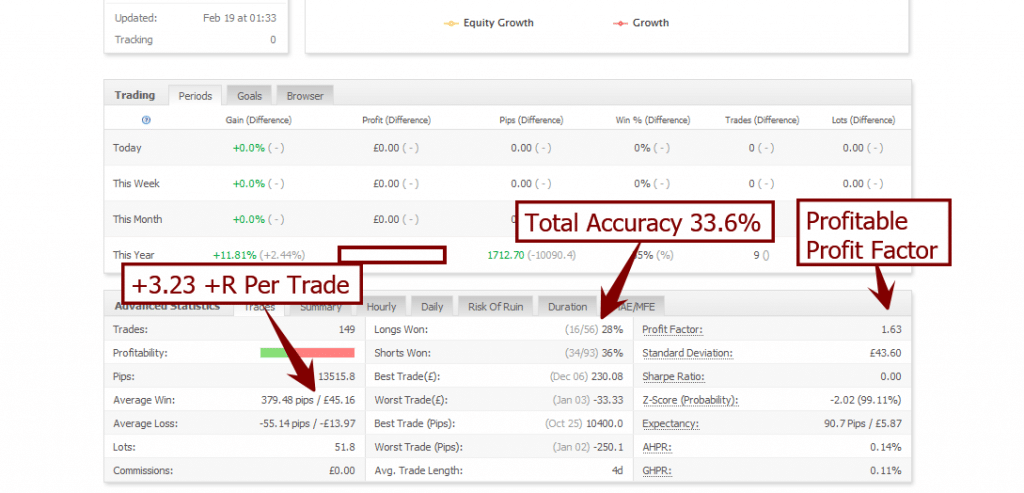
joe-profitable-trader-2ndskiesforex-avg-r-per-trade
Risk of Ruin: ZERO (image below) NOTE: If you do not understand what the risk of ruin statistic means, click here.
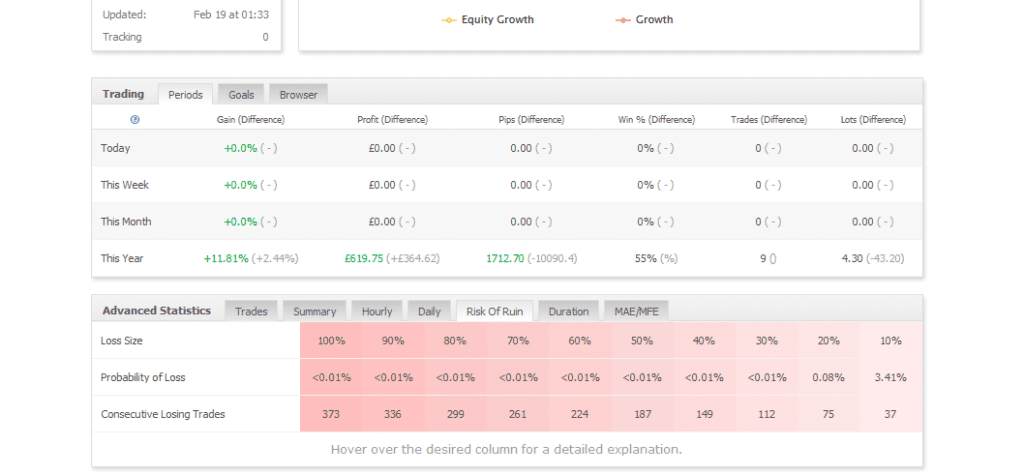
joe-profitable-trader-2ndskiesforex-risk-of-ruin

Instrument Performance: Total of 5 instruments that gained +2-5% profit, while only 1 instrument with a 2% dd (image below)
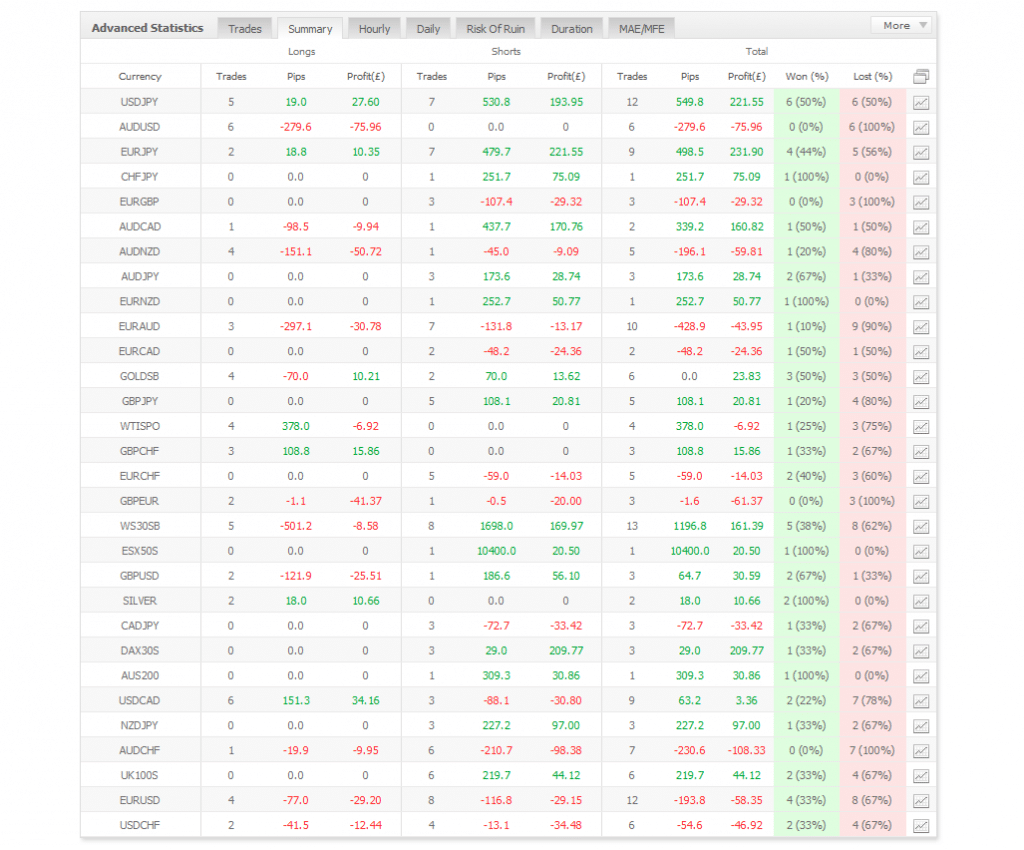
joe-profitable-trader-2ndskiesforex-instrument-summary

Risk Management:  .5% risk per trade (which showed excellent discipline here)
Total Return: +44R!

Summarizing Joe’s Trading Performance

When you examine the above statistics, Joe performed exceptionally well and had a fantastic quarter to end the year. In fact, his +22% gain over this time period would have beaten out most hedge funds yearly performance, so kudos to Joe.

And Then…The Drawdown

While Joe beat out most hedge funds last year, this year has started on a different note. Since Jan. 17th, he’s down about 11% (see below).
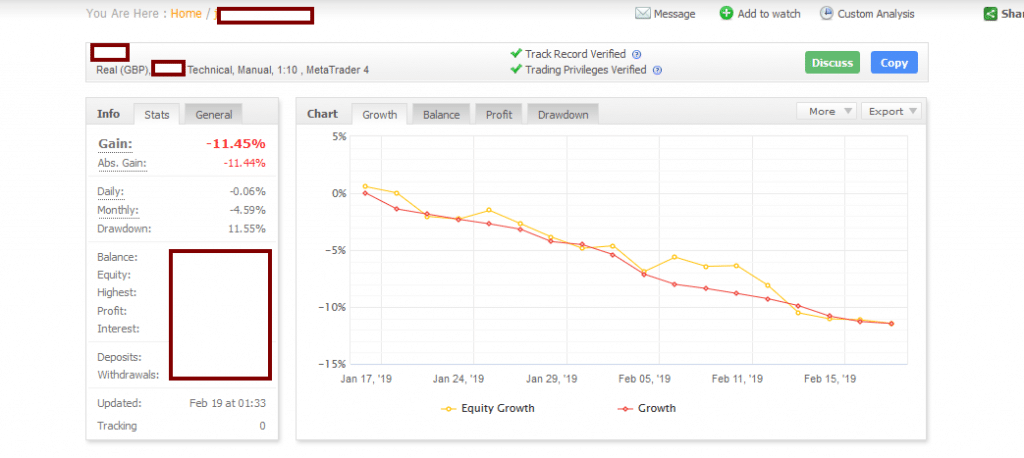
While some things in Joe’s life has changed, and had some negative effects upon his trading mindset and performance, something else seemed amiss behind the night and day change. Joe reached out to me to see if we could do another Skype session and analyze his performance, so we dug into the numbers.

Now tell me what seems out of whack below with the stats:

Total Profit/Loss: -11.45%
Accuracy: 13.9% (image below)
Avg. +R Per Trade: .99R (image below)
Profit Factor: .16


As you can see, all the stats are down, but which ones stand out the most? The accuracy being down isn’t helpful, but what is more damaging is his Avg. +R per trade went from +3.23 to .99! That is a drastic difference.

Regardless, accuracy is always in flux when it comes to performance. % accuracy usually operates within a range for traders. It never stays fixed from year to year. So if you’re 54% accurate in one year, the chances of you ending up 54% accurate in the next year is slim to none – don’t bet on it happening!
When I saw Joe’s Avg.+R per trade was down, I immediately started to wonder ‘why‘? If accuracy goes down (it happens) it will obviously affect your overall performance. But why would Joe’s Avg. +R per trade go down? Why would a trader be getting less per trade then their past 149 trades?

There could be many reasons ‘why‘, but to name a few:

1) you’re taking profit too early/earlier than you were before
2) you’re not feeling confident, and thus trying to close any trade for profit instead of letting it run

I could honestly list a litany of reasons, but the summary tab (which analyzes performance per instrument) was the most revealing (see below):

First off, his biggest losing instrument was the NZDCAD which accounted for 40% of his total losses! It’s important to note Joe wasn’t even trading the NZDCAD in the prior 4 months. So he was including a new trading instrument into his trading plan.

Upon further questioning, I uncovered another ‘reason‘ why his performance had slipped so much. Joe had developed a bias on the CAD as a whole. He felt the CAD was about to move into a place of strength, so was bearish on any XXX/CAD pair across the board, including the NZDCAD.

Despite losing every trade on the NZDCAD (10 total), and the price action charts continually ranging or climbing, he held onto his bias and was continually shorting. This obviously had a negative affect upon his performance (holding onto a bias, regardless of what the charts are communicating rarely ever works).

Accuracy Gaining/Declining Shouldn’t Affect +R

Accuracy going down shouldn’t translate into you to going for much smaller targets. Your overall +R per trades should remain stable regardless of you performing well or not. If you consistently go for +2R, winning and losing shouldn’t change this.

Now there were a lot of other metrics Joe and I went through on our private skype call, but two things that became evidently clear were:

1) Joe had made some major changes to how he traded, and

2) Joe needed to have that skype call with me.

This is why I cannot over-state the importance of having a trading mentor. And it’s not just about having a trading mentor, but about having one who can look at your individual performance, and help you see what you’re missing that’s causing you to not get the maximum profit out of your skills and price action trading.

This feedback model I have with my students has been a game changer. I’ve turned break even traders to become profitable traders. I’ve turned losing traders into winning traders. I’ve helped students like Joe spot major issues during a draw-down, and help them correct course. If Joe hadn’t reached out to me, he could have easily kept trading and losing more money.

trading mentors 2ndskiesforex

Hence you have to look at what is the feedback model you’re getting from your trading mentor, and how much can that change your performance. If you’re not getting any analysis and feedback from them, then your trading mentor is just an information dispenser. And without analytical feedback, how would you ever know what mistakes you’re making, and how to correct them?

Thus ask yourself – how valuable would such feedback be for your trading to have an analytical session with your trading mentor digging into your performance, and finding patterns in your trading and numbers you didn’t even know existed?

Is that worth a few hundred dollars, let alone being taught the skills and trading strategies to make money?

In Closing

With that being said, if you’d like to learn how to become a member of our price action course, where you’ll get this type of feedback, along with access to our members market commentary & trade ideas, members trade setups forum, and over 60 hours of trading videos and lessons, click here.

Please make sure to leave a comment and share this with anyone you think will benefit from this.

Until then, I hope you’re seeing real change in your trading performance and mindset.

Here is a new trading video on how to spot key elements to enhance your counter-trend setups using price action triggers and reading the key price action elements.
price action, order flow and transitions 2ndskiestrading.com

Here is a new video on trading intraday price action trading.  In this video, I am demonstrating how to read forex price action on an intraday basis for short term price action trading. For those of you wanting to learn advanced price action, make sure to check out my price action course where you learn rule-based systems to trade the forex market using high-probability setups backed by quantitative price action data using simple to learn price action strategies.

To be successful at anything, it requires work and sometimes the work you have to do to build your skillset is not entirely glamorous, sexy or fun.  For example, I am doing competitive archery, and some of my training actually has to do without shooting an actual bow, but working with an elastic band to help work on a specific technique. Sometimes, I am firing the bow, but with no target, and at a distance of 3meters.

Yes, it’s true…my favorite part of the training is shooting from the 18m distance, but I know that all of my training in the other exercises is critical to how I shoot when it really counts.  It is the exact same for trading. There are many things one has to work on to be a successful trader besides just making trading decisions.  Enter Patricia –
Just the other day, I did a follow up session with Patricia.  She is from China and wanting to live off of just trading. She has impressed me as she had very little experience in this market before she took my Price Action Course.  But since she has taken the course, she has been one of the most diligent students, working very hard at every aspect needed to be a successful trader.
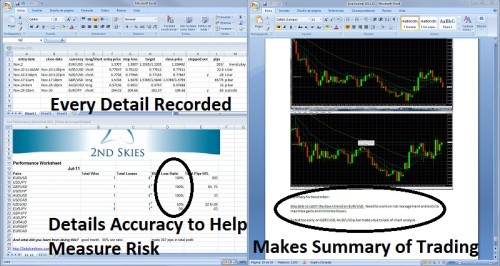
Every month, she emails me all her reports and has worked on them to absolute perfection. Below is a screenshot of her first month of live trading.

This is contrary to many students who when I do the follow up session with them, and ask for their reports, I get the ‘yeah, I never filled those out’.  This tells me how serious they are (or are not) about trading.
To be a professional at anything, there is no cutting corners.  There is no ‘Ill skip practice, or doing free throws, or working on my conditioning for some other day‘.  The path of being a professional is not about skipping anything or putting things off till tomorrow. What you do today either moves your forward, backward, or keeps you treading water, and treading water is really going backwards.
Patricia has discipline, diligence and the right mindset towards trading, and I expect her to be successful at this in a short period of time.  In fact, after a few months of study, she just went live and did quite well as you saw from the image above.  6 trades, 4 profitable, largest winner was over 3x larger than her biggest loser and +307pips of profit.  Not bad for her first month of live trading.
She only wants to trade on the daily time frames so she is not active, but she is effective, and my guess is many of you would be happy with +307pips of profit in November, especially considering how crazy it was, along with a holiday week, so less trading.
Maybe trading off the daily chart is for you – fine.  No problem. The key is to find out what works best for you, what kind of lifestyle you want to live and what is most natural to your mentality.
There have been some people which have stated you are only a pro if you trade the lower time frames. That you are only pro if you make 4-15 trades a day, sit at your computer and crank out trades. This is ridiculous.
What time frame you trade does not make you a professional trader. What makes you a professional trader is if you make your living off of trading, not what time frame you trade, how many trades you make per day, or how many hours you spend at the computer. Tell that to Jesse Livermore who made over $100million dollars mostly viewing the daily closes to make his big trading decisions.
Try telling that to my friend George who only spends 2hrs a day max trading, and does 60% a year. Why 2hrs a day? Because he spent almost 2yrs studying and programming his system that now does most of the work for him, which means he does not have to be at the computer pushing buttons all day to make money.  He can be at the beach or playing golf.
If a short term trader does 60% a year, and so does George, while George makes say 100 trades a year, and the other 500, and George spends only 200hrs at the computer, while the other does 500hrs, does this make the short term trader a professional and George just an amateur? Obviously not, so don’t be poisoned with some idiotic belief you have to trade a certain time frame to be a professional – that is just stupid.  Again, what makes you a professional is if this is how you make your main bread and butter and can repeat your successful performance year in-year out. But I digress.
With all that said, we want to list 3 tools you can use to improve your trading. True, they are not sexy – but they are critical towards your development and success.  Many of you have heard them before, but I’m going to talk about why you need to do them.
chris capre https://2ndskiestrading.com/
The Performance Worksheet
This worksheet has your entire month’s trading on it.  It has all the pairs you traded, your accuracy per pair, your accuracy per system, and total pips gained (or lost) for each pair.  We always recommend doing this at the end of each month.  What does this do for you?
1) Knowing how you did on a pair can tell you a lot of information. You may be good at some pairs you think you are bad at, and bad at some you think you are good at. One year when analyzing my trading, I had traded 9 pairs, but over 80% of my profits came from 2 pairs.  So the next year I traded just those two pairs. And what happened? I almost doubled the amount of pips I made.
By trading the pairs you are most successful at, while eliminating the ones you don’t seem to have a rhythm with, you increase the chances you’ll be most profitable. Each pair has its own patterns and behaviors, and some will simply match with your style and talents better than others, so once a month, I recommend making a worksheet to look at all this data and see where you are with each pair.  My guess is the data will likely surprise you.
Trading Journal
If I had to guess, this is the one thing every trader dreads doing.  Yet it is the one thing which could give the greatest insight into you, your tendencies (good and bad) and help you become your own teacher. Having a trade journal can help you see your own mistakes and learn to correct them. Early on in my career, I noticed a pattern in my trade journal of not letting the trade run to its full target.
Honestly, it took me a while to first find this, and then months to correct it as I was generally going for targets of 100+pips. I would typically take profits on what I thought was an exit signal and really had nothing to do with my system. Once I corrected this, the result was undeniable; 8+years of profitable trading without one losing year. Yes, I had my losing months, but the things which were holding me back were being corrected because of what I learned in my trading journal.
If your not filling out a journal, ask yourself this, ‘how many trades did I make last year, or the last 6mos?‘  What would you say? 100, 500, 1000? Now ask yourself, ‘what are the chances I remember every one of my mistakes, say over 100, 500 or 1000 trades?‘  Not going to happen. So this translates into mistakes and habits which get swept under the rug and never dealt with. They become the weak links in your trading.
Remember, the weakest links in your trading set the height of your success. Whether it is risk management, trading psychology, your equity threshold or trading discipline, any weak links will separate you from your goal of trading successfully month in-month out, year in-year out. Having a journal helps you to be accountable while being your own teacher.
Screen-Recording
This can be a substitute or stand-alone for the journal but it is a highly effective tool. Reviewing your trades via video can reveal all kinds of information about what you saw in the market, how you traded the last play, how you executed your system, and what the price action looked like when you made your trade.
One software program good for this is Camtasia which you can use to record all your trades, make comments, follow the trade, and study how the market looked when you made your trade.  I had one student Marius who not only recorded all his trades, but also took screenshots of every winning and losing trade right at the time of entry. He then studied all the screenshots to see if there were patterns behind the successful and not successful trades.  What was the result?
He increased his accuracy on the system from 64% (which was the base performance of the system) to 78%.  How?  He actually found a pattern/qualifier which would improve the overall system. Very clever on his part and something he would have never found if he wasn’t screen recording his trades.  Well played Marius.
For those of you who are active day traders, I’d recommend this over a typical trading journal as you might not have enough time in between trades to fill your journal out.  Or for the tech lovers, this is also an option.
I use this for all my trades and then review them at the end of each week before I start my next trading week.
Summary
Like all endeavors, trading requires one to be good at many skills. I cannot imagine my archery abilities if I only worked on distance, or only worked on my power, or only worked on my release, or only worked on my stance, or my concentration, or any one thing.  Trading is not just making trades, it’s managing risk, it’s being highly focused, it’s being aware of one’s emotions and not letting them interfere with your trading, it’s finding patterns in the market and then building a system, it’s learning from your mistakes and becoming your own teacher.
If you just focus on your system and making trades, it is highly unlikely you will become a successful trader because there will always be mistakes you will repeat. Mistakes unchecked become habits, and habits are like holes in a bathtub. You cannot fill a bathtub with water while there holes in it as the water will continually leak out.  The more bad habits you have, the more holes in the bathtub. In the beginning and developing stages of your learning process, trading is about plugging the holes.  Once you have them taken care of, then we work on building more profits, but you cannot skip a step, and you have to do the work.
Please remember to leave your comments below and to ‘Like’ / ‘Tweet’ to share the article. 
For another great article on trading psychology, check out Trading Analysis and Gary Kasparov.

Many of you have been asking for specific content on how to do advanced price action trading. So I put together a list of my top articles and videos to help you:

Enjoy!
Chris Capre

This lesson is focused on one of the least discussed topics in trading – price action. In this forex price action training video we teach you how to identify a critical component of price action – Impulsive vs. Corrective moves.

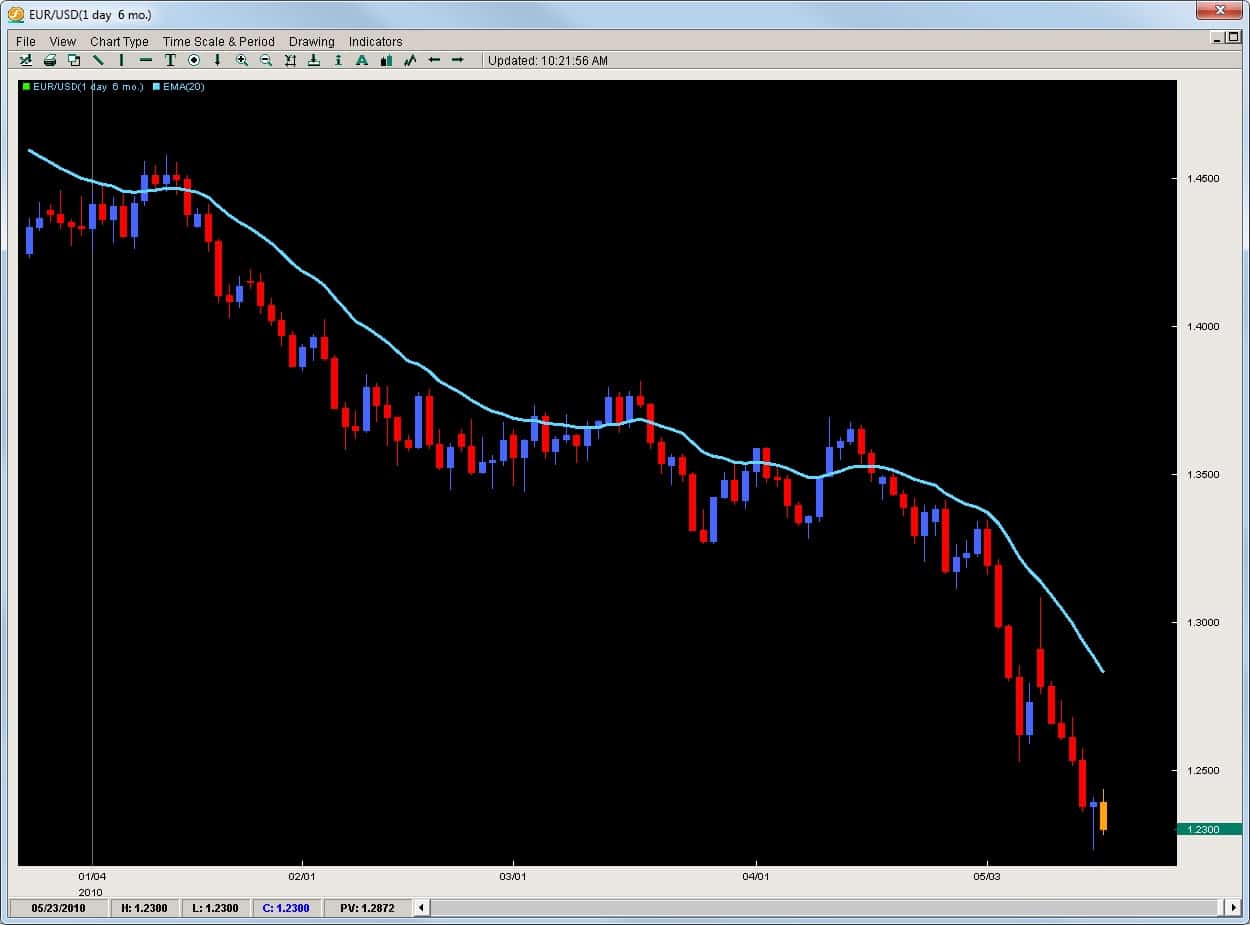
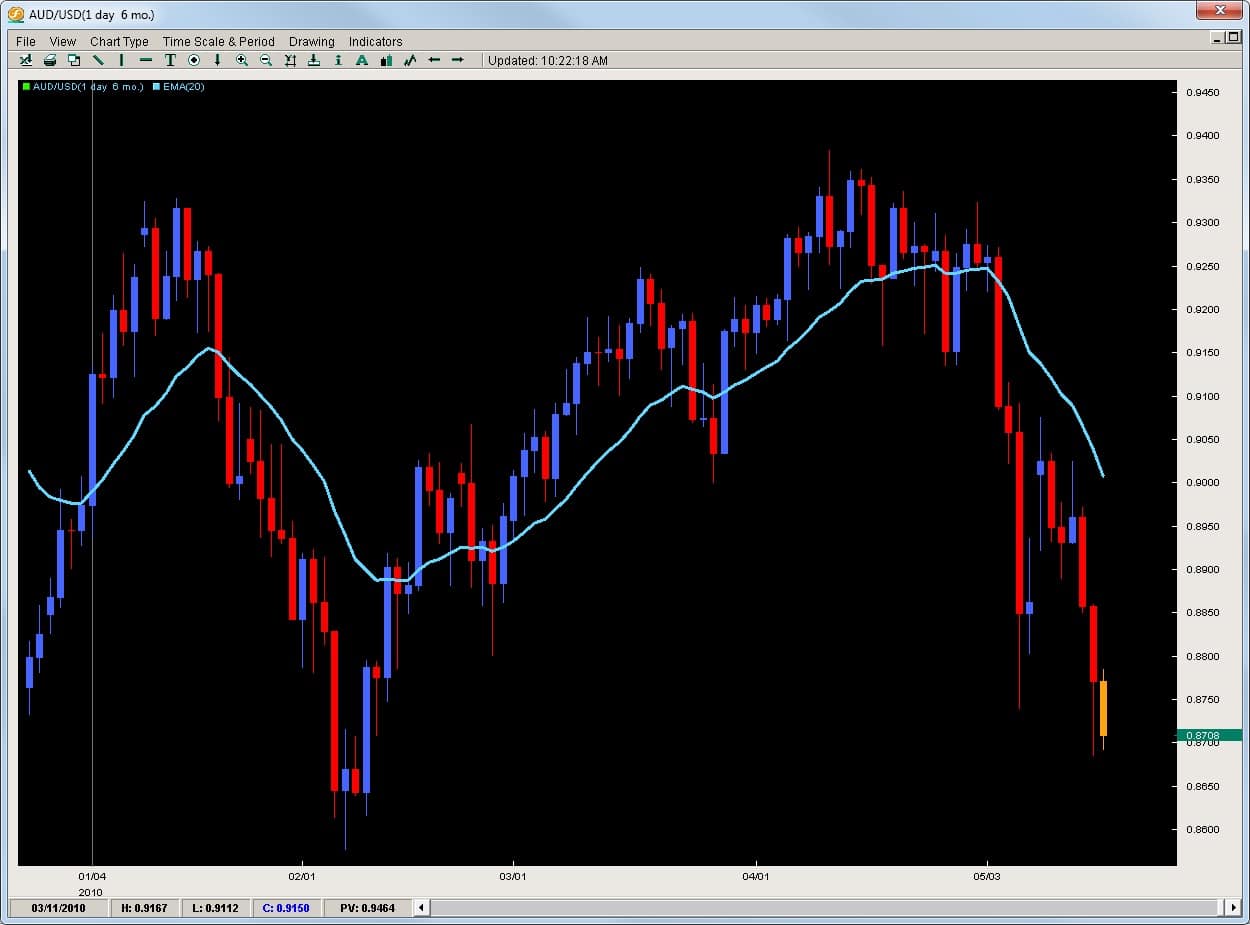
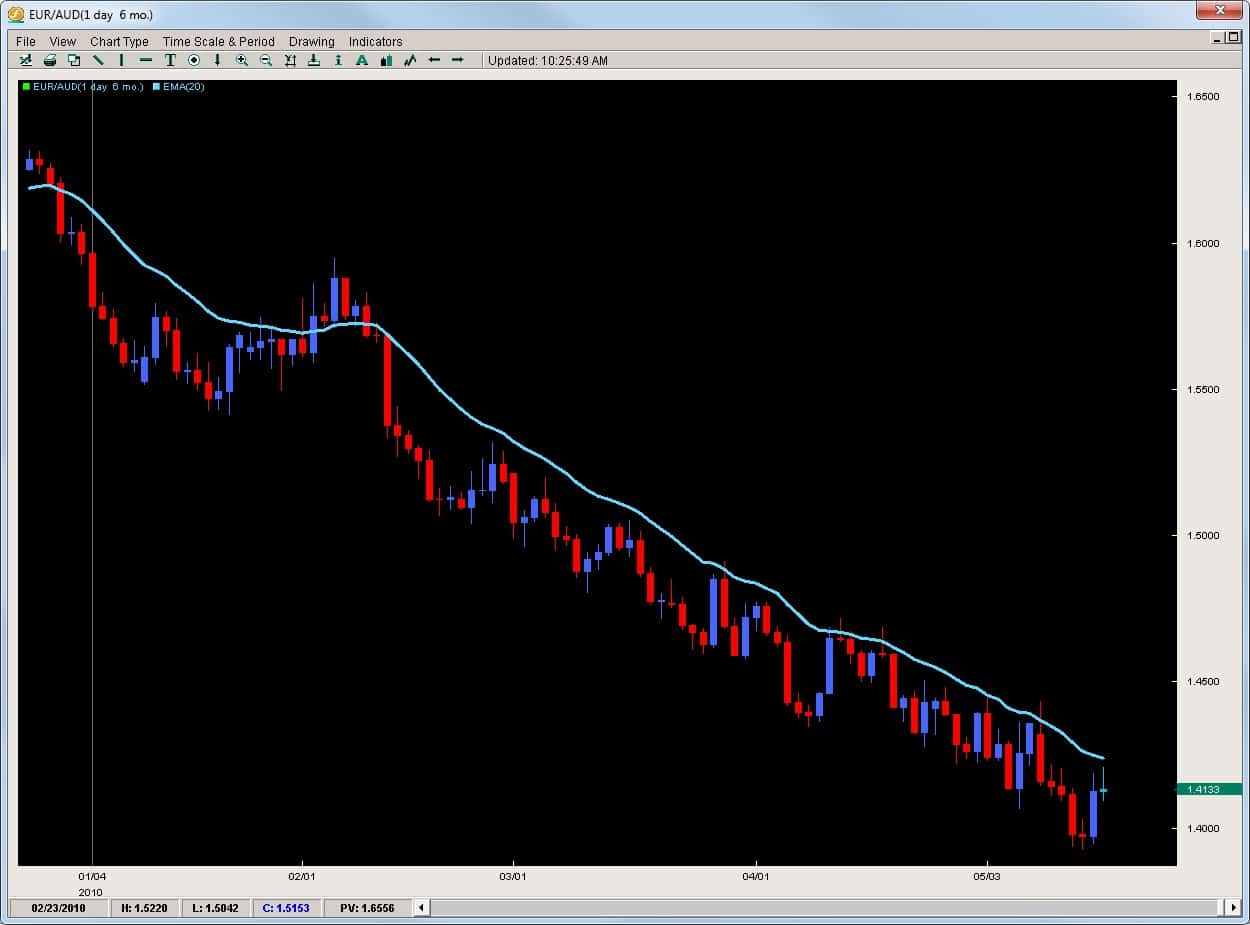
Trading Forex is in many aspects the same as trading any other instruments.  However, there is one crucial way in which trading Forex is completely different than trading other markets. When you are trading any other instrument, you are trading a single instrument based upon its individual strength or weakness.  However, in Forex you are trading two instruments or currencies which have their own individual strengths and weaknesses.  Thus, the equation is a little more complex but actually makes it easier to find trading opportunities. Why? Because when we are trading currencies, we simply are looking for the greatest polarity between the strongest and weakest currencies.  By trading a strong currency against a weak one, we greatly increase the chances the pair will move in our direction as long as we are buying the strong currency and selling the weak one. If you can analyze the price action and isolate the strong vs. weak performing currencies, then you can find some great price action trading setups. How to Find Strong vs. Weak Currencies? The method is actually quite simple.  Since the USD is the most commonly traded currency (either as major or cross) we can see how individual currencies are performing against the greenback. Example #1 EUR vs. AUD If we look at the two charts below, we are seeing the daily charts of the Euro vs. the USD and the AUD vs. the USD.  We can see how the EURUSD has been tumbling opening the year at 1.4330 and is currently sitting at 1.2300 shedding over 2000pips. Contrast this with the AUDUSD which opened the year just under .9000 and has ranged currently only being down 300pips. 300 vs. 2000.  Who is going to win this battle?  The AUD will over the EUR. Thus, how does this lead to a trading opportunity for us?  By buying the strong pair vs. the weak pair, or selling EURAUD. What does that chart look like?  See below. The EURAUD opened the year at 1.6000 and is currently sitting at 1.4130, shaving off 1870pips. Thus, trading does not always have to be complicated requiring lots of indicators to find good trades.  By understanding how to read price action, determine impulsive vs. corrective moves and spot good formations, you can find great trading opportunities.

If you are serious about learning how to trade this market successfully, and find simple high-probability trades using pivots and price action only, you can check out the Trading Masterclass or the Advanced Ichimoku course which will teach you rule-based proprietary price action strategies and systems to trade these profitable setups.

In one of our previous forex tip articles, we wrote about the inside bar and how it is an important price action formation that can offer great trading opportunities.  However it is important to note not all inside bars are created equal. To Review: An inside bar is a bar where the entire price action (including the wicks) are totally inside the previous bar.  Now on lower time frames these are more common and not too important (say on anything less than 1hr chart) but on the 1hr time compressions and above, they have a lot more significance.  In total, Inside bars form approximately 10% of the time (or are approximately 10% of all candles) and are a unique price action formation. When they occur at critical support / resistance levels (prior highs/lows, Fibonacci retracement levels, outer pivots, larger Kumo formations, etc) they have more impact and can often lead to strong price moves. There are several key reasons why an inside bar would form which a few are listed below:

  • Price is consolidating after a large up/down move in price and is about to start another leg in the same direction
  • Price is coming up against a critical support/resistance level which shows some hesitation in the market as to whether it will continue or not
  • Price Action and liquidity is dropping before a critical news announcement so with nobody taking new positions, price will not have enough order flow to move consistently in one direction
  • Profits are being taken

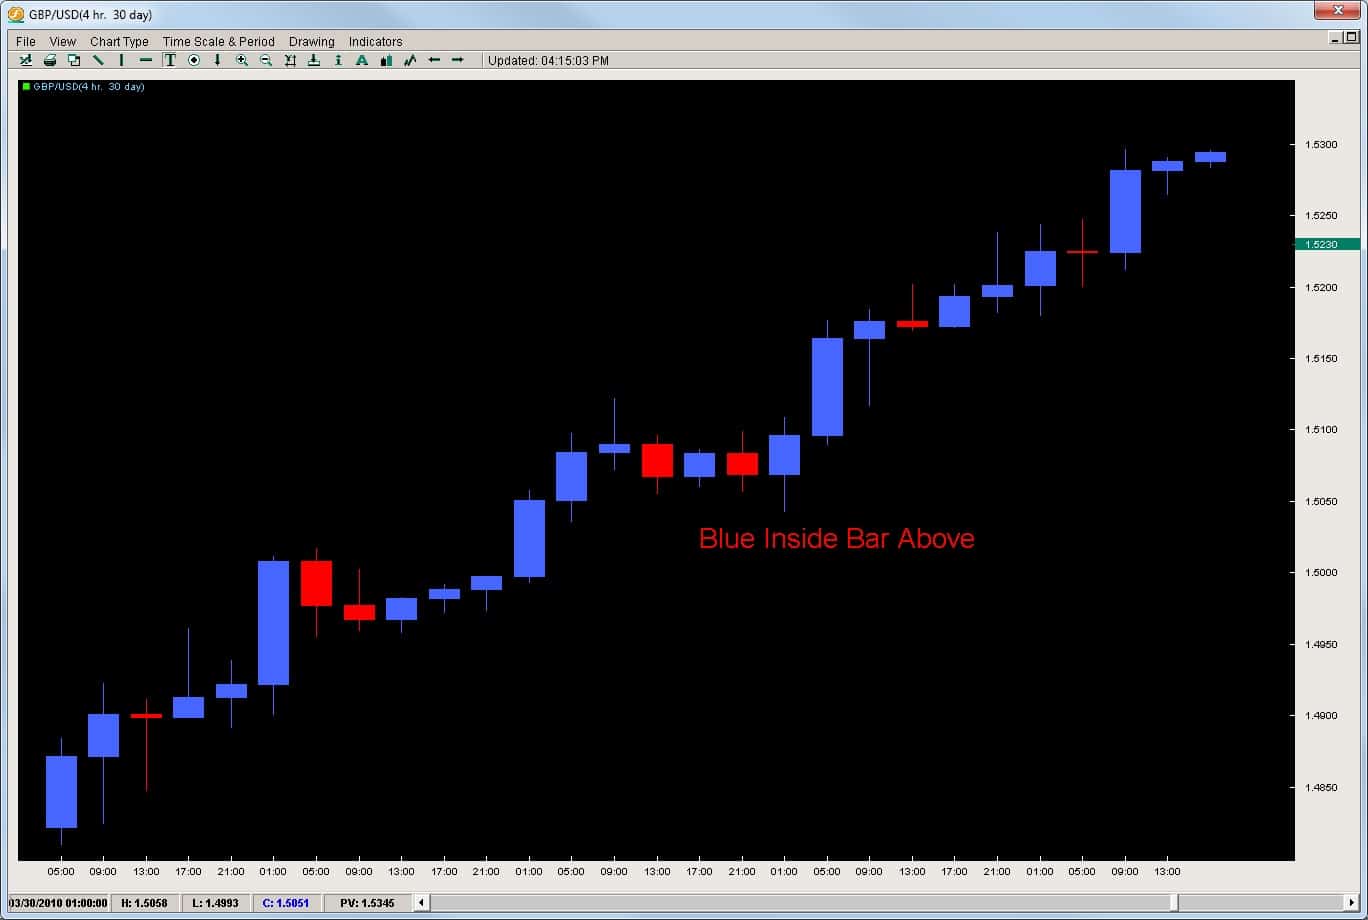
Since news events naturally drain liquidity before the event, they become less important in forming inside bars.  The key things to note is that an inside bar generally forms from a) the consolidation of a large move before starting another leg or b) price is coming up against a critical support/resistance level which shows hesitation in the market. This pause in the price action gives us a great chance to get into trending moves as we can use the inside bar to get into the trend before the next leg starts. However,  you still cannot treat them as equal.  As traders we have to note whether the inside bars are occurring with trend or counter-trend?  If they are occurring counter-trend, then they become much more difficult to trade. Case in point, take a look at the chart below on the GBPUSD 4hr chart.  The trend is clearly to the upside with virtually no red bars and a 300pip climb.  Then we have a red bar in the middle of the chart followed by a blue

inside bar.  This inside blue bar was followed by another 250pip leg up. Even though the pause happened at the 1.5100 barrier and after a decent wick rejection to the upside, the bottom line is the inside bar formed after a down candle.  The translation of this is price hit a resistance, traders took some profits, started to evaluate the move and while doing so, price sold off a little.  An inside bar formed after price sold off a little so this inside bar does not tell us much other than price volatility is contracting.  These are the least informative of the inside bar setups. Thus, you cannot trade every inside bar the same as they signify many different price action situations. With that being said, there are ways to trade them efficiently.  We have actually analyzed inside bars on every pair from the 1hr to weekly time frames.  From this data, we were able to extract the % chance it would; -break with trend -break counter-trend -what the average pip break with trend was -what the average pip break counter-trend was -and several other metrics If you want to get access to this and other proprietary quantitative data on the inside bar strategy or several other price action setups we have tested, then check out our Price Action and Pivot Point course where you get access to this data along with permanent access to our live forum and a follow up private one-on-one session. To learn more about this course, click on the link Price Action and Pivot Point Course or email us directly via the Contact Page

One of the most difficult challenges for traders is finding forex entries and exits.

It’s an important question that needs to be answered and can determine if you are; 1. getting in at the correct location 2. can have your risk defined and as minimal as possible 3. have a clear location to take profit 4. and know how to protect the position If any of these are challenging for you, then you will want to learn how to use pivot points. Created by floor traders decades ago, they were used as a method to mark key levels of support and resistance. It started out with the daily pivot but morphed into other pivot levels the institutions are watching constantly on a daily basis. If I told you about 70-80% of all 1hr candles will touch a pivot level from the London open to the London close and sometimes even the NY close, would you pay attention to them? I’d hope so because price action’s constant contact with them suggests their potency as something that has to be respected. Before we go into examples of them on the charts, we will go over their basic construction.

All the pivots start with the composition of the DP or Daily Pivot. The DP is calculated by adding yesterday’s high, low and close, then dividing them all by 3.

The formula looks like this: DP = (H + L + C) /3 If you think about it, some of the most important pieces of data from a price action perspective are yesterday’s high, low and close. The high and low mark the extremes of price for that day (or how far the market was willing to go) and the close measures the acceptance of price at a particular level, along with how much strength in the buying or selling there was (determined by the closes’ position to the high or low). The remaining pivots are calculated by various multiples of the DP.

The formulas are below:

S1 = DP – (H – DP);

S2 = DP – (H – L);

S3 = L – (H – L);

R1 = DP + (DP – L);

R2 = DP + (H – L);

R3 = H + (H – L);

To briefly define them, the S1, S2 and S3 are what we call support pivots (S = Support) and the R1, R2 and R3 are what we call resistance pivots (R = Resistance). The S1 Pivot is the closest of the support pivots and the R1 the closest of the resistance pivots. The farther we go out (S2, S3, R2, R3) the further the pivots are from the DP.

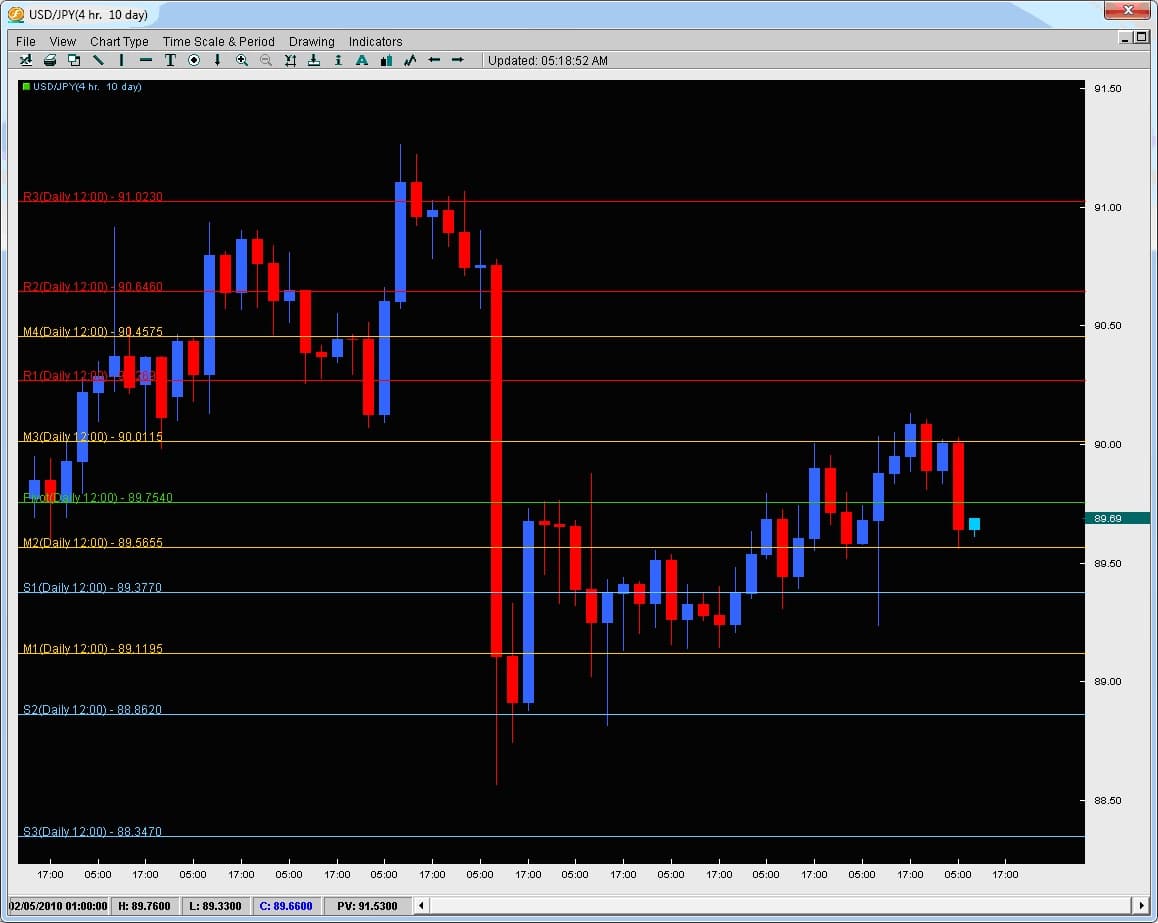
A chart below will show what they are and how they relate to price.

pivot-pic-1

In this chart we are looking at the USDJPY on the 4hr time frame. The red lines are Resistance pivots and the blue lines are Support pivots. The yellow lines are Mid-Pivots and are simply the halfway point between any two pivots.

So how do Pivots help you with Entries and Exits?

Simple. The institutions regard pivots as one of the most important things for placing intraday forex entries and exits. Price actions response to them confirms this but in regards to any other indicator out there, nothing has more contact with price action than pivot points (except a really short moving average which has little meaning to price at that point). There are actually statistics out there which show how price will make contact with pivots 70-80% of the time (on hourly chart). Lets take a look at the GBPUSD on the 30m chart below.

pivot-pic-2

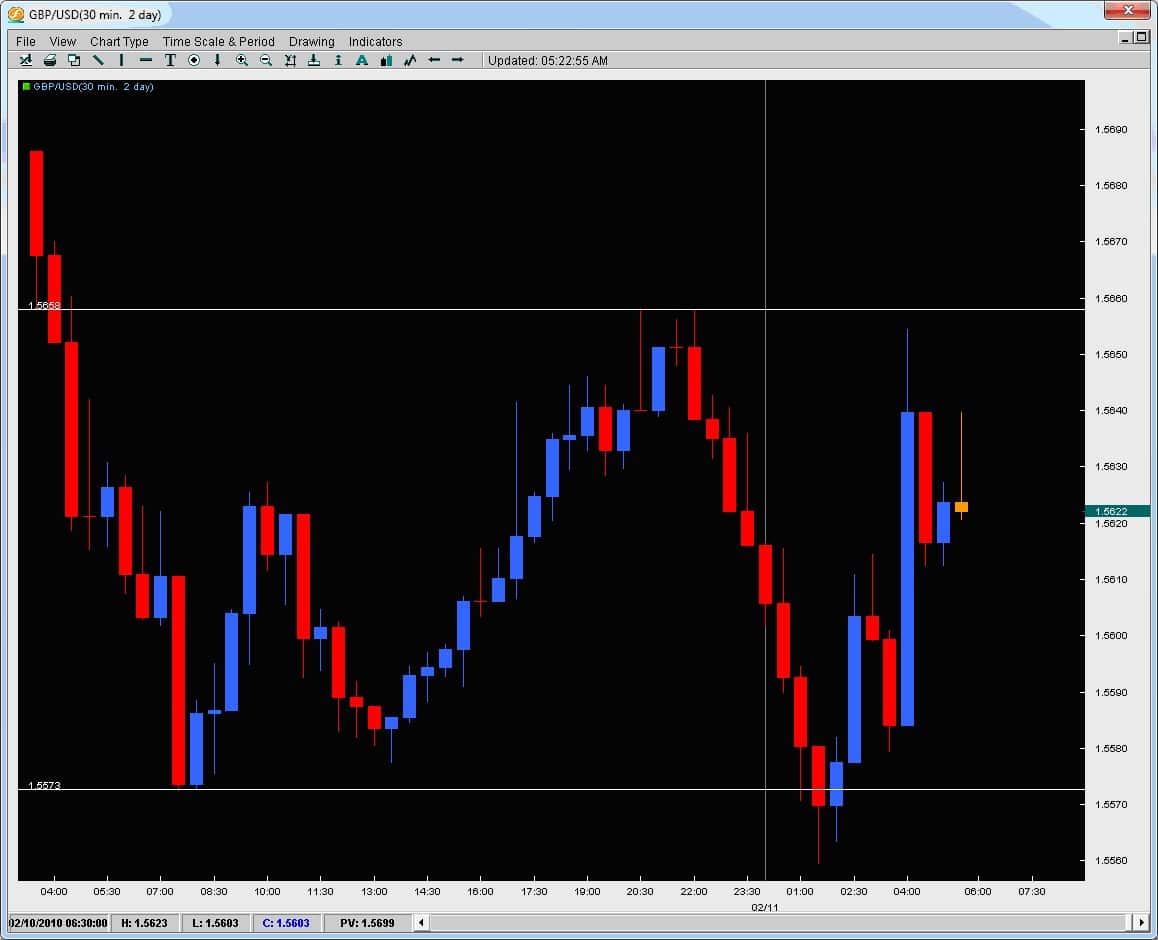
The grey line represents the London open (today Feb. 11th, 2010). We can see from the recent top why price today got rejected up around 1.5650/60 because of the last top there and price’s rejection at this level. But what about the bottom? The previous bottom was 1.5573 which the two candles to the left had touched but today, price went another 15pips past them. Why did the two candles today go past them and why did the market reject or react so sharply to those levels? Also, after bouncing off the bottom, price climbed to 1.5610 where two wicks to the topside formed and caused a small rejection. What was there to reject price in the past? This exact same rejection level became a support level once price had broken it.

Take a look at the chart below and you will have the answer why.

pivot-pic-3

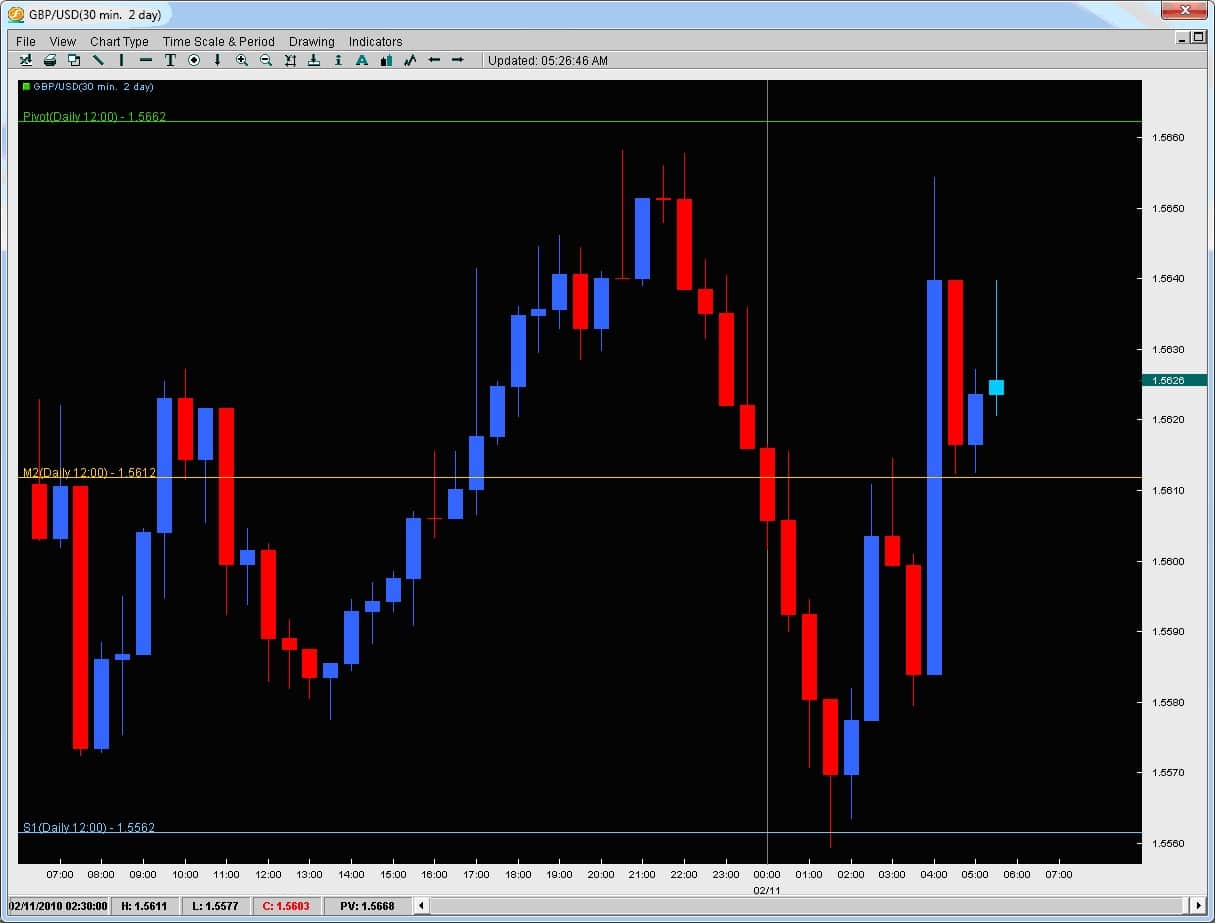
As you can see, price went past the previous support level and touched the S1 (Support 1 Pivot). Treated it as support for two candles, then rejected off of it.

Where did it go to?

The M2 Pivot (Mid2 Pivot) and rejected twice off there. Once price broke this level, it then came back to do what? Treat the Mid-2 Pivot as support. These types of reactions/responses from the market occur all the time on an intraday basis. They give the trader a much more precise level to enter the market for intraday trading while also giving us ideas for precise exits. If you would like to learn how to use them for precise forex entries and exits for your intraday trading, learn what the % chance price will break any given pivot on any given day, learn what the % chance price will touch the next pivot after breaking one pivot, or how to spot key reversal and breakout strategies using pivots, then check out the Price Action and Pivot Point Course.

As forex traders, we have the challenging task of trading to make profit from the price moves in the market. This entails finding the where (price), when (timing), and the direction (trend). Most traders end up searching the savannah of trading systems adding tons of indicators on the charts that end up looking like an italian spaghetti food fight amongst 5 year olds.
What is interesting is that the answers to these three things we have to find as forex traders (where, when and direction) are all written in the price action. With that being said, we should answer the question of what price action is.
What is Price Action?
Price Action is simply the movement of price over time. It can be as simple as one price candle or over 100’s of candles. It is not time specific but it simply refers to the movement of price due to the order flow of the market. The bedrock of it is the forex market moves because of the big players. Whatever the reason (technical or fundamental), the market only moves because the larger players buy and sell. The combination of all the buy and sell orders, along with the volume is what moves the market.
Unfortunately we do not have access to the total aggregate volume in the Forex market and any broker volume we get is just a small lily pad in the pond – not representing much in terms of the overall gestalt of volume. Thus, since we do not have access to order flow and volume, the bottom line is we have to trade the way the big players do. We have to find out the where, the when and the direction they are getting in.
The good thing about this is we have most of this information right in front of us hidden in the price action. Again, the market only moves because of order flow and its closest relative we could ever court is Price Action. By learning how to read price action successfully as forex traders, we give ourselves the most important piece of information about what the big players are doing and thus can profit from these moves.
As the smaller and medium sized traders, we are simply having to learn how to surf the waves of price created by the bigger ships in the ocean of price movement. Learning how to read price action will be the most powerful tool you could ever develop when it comes to learning how to trade because it gives you the three most important things to trading (the where, the when and the direction). It is only until you master all three of these will you see consistent profits with minimal drawdowns over time. Thus, get an education in price action and learn how to trade the markets successfully.