Tag Archive for: price action

Less than two weeks ago, a course member asked me the following question (click to enlarge):

2008 crash

Here was my response:

“You have to be prepared for bigger pullbacks & volatility than usual. You have to keep staying short till you see a broad base of instruments bottoming and showing a transition in the price action and order flow” – from my members coaching session Feb 14th.

This week, we got a taste of this volatility, and there is a decent chance the selling + volatility may just be starting. Hundreds of my clients and friends have been asking me, “Is the stock market about to crash?”

In this trading article, I’m going to discuss the coronavirus, the increase in volatility, what’s happening the financial markets, is the stock market going to crash and how I’m trading it.

So grab the popcorn and a good beer as we’re going to get into the thick and thin of it.

Coronavirus + Volatility = Panic!

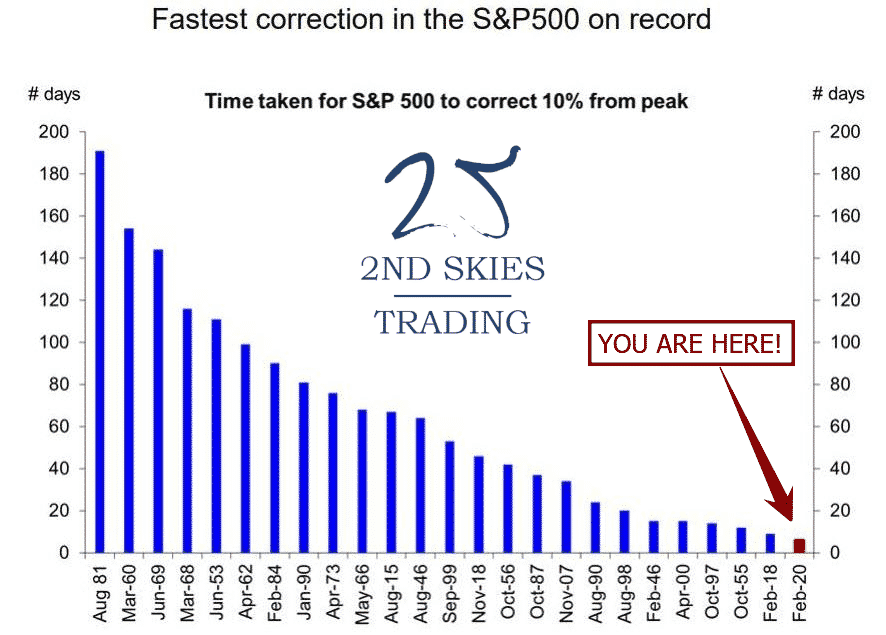
Let’s get into some stats around this week’s incredible sell off in the global markets. This week’s drop in the S&P 500 was the fastest 10%+ drop IN HISTORY!

Exhibit A: The Fastest Correction (10%) in History (S&P 500)

fastest correction S&P 500 in history 2ndskiesforex

In the last 7 trading days starting with February 20 – 28 (from open to close) lost 440 points shedding 12.9% while global markets puked $5 trillion in market cap.

Translation: In the last 7 days, we lost the GDP of the UK & India combined! (source: investopedia)

Also of note, the fastest and second fastest 10% declines (from peak) have happened within this decade.

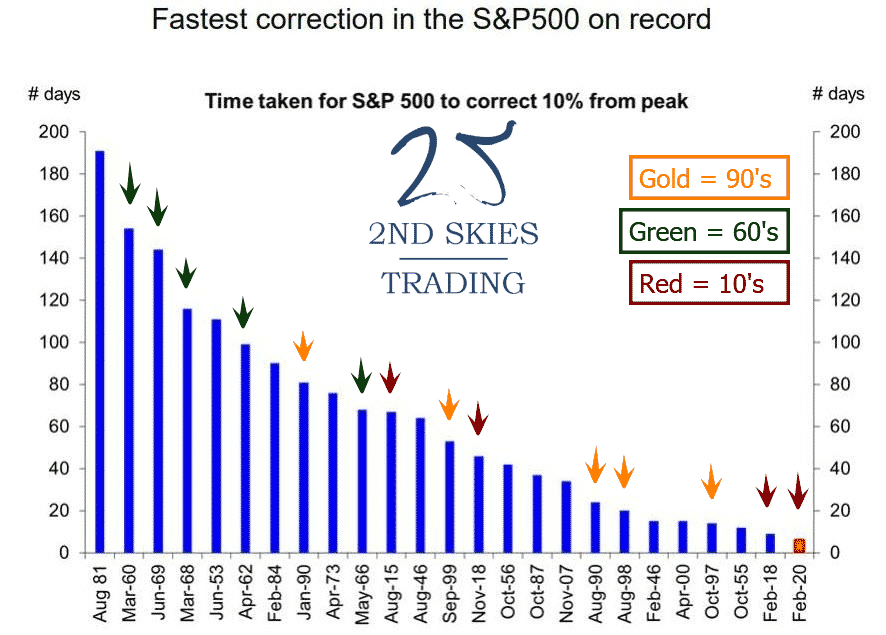
Of all the decades going back to the 40’s, the 60’s and 90’s had 5 of the fastest 10% corrections in history. This decade is in 2nd place with 4 of them (see below)

fastest corrections by decade 2ndskiesforex

Also of note is 3 of the last 5 of these fast 10% corrections have happened in the last two decades and 7 out of 10 in the last 30 years.

Translation: these corrections are happening faster in more recent history than before.

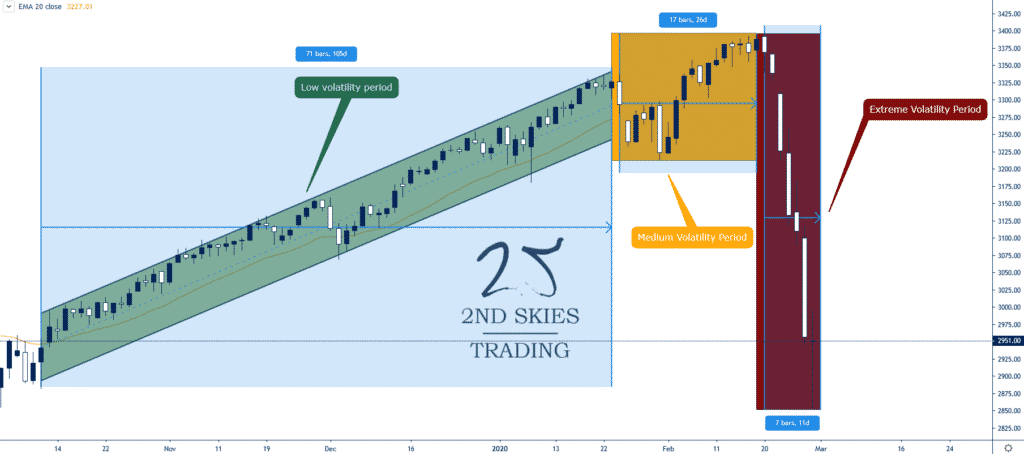
What is also important to note is how low volatility was in the S&P 500 until the corona virus started to become prevalent in the markets (see below).

volatility ranges S&P 500 2ndskiesforex

We had 71 days of super low volatility and many 5 day stretches where the markets never dropped more than .5% (green box)

Then we had a period of 17 days with mildly increasing volatility when the coronavirus was becoming more of an issue.

This culminated in a 7 day explosion of volatility last week erasing months of gains in a flash.

This is one of the most important trading lessons I’ve learned over 20 years. That markets can and often do sell off faster than the run ups.

The reason why this can happen has to do with market psychology and behavioral finance.

In a long bull trend, the general emotions are complacency, confidence and greed. This has to do with simple biology.

We are wired as humans to react more rapidly to stimuli which threaten our existence. Slow non-volatile bull markets don’t threaten us, so we don’t often react with alacrity at a small sell off.

The emotions behind a bear market or extreme selloff is fear, worry and panic. Hence a sharp selloff and quick loss in our portfolio is threatening, thus leading to fast reactions (SELL & SELL EVERYTHING!).

This is why markets can sell off far more quickly then on the way up.

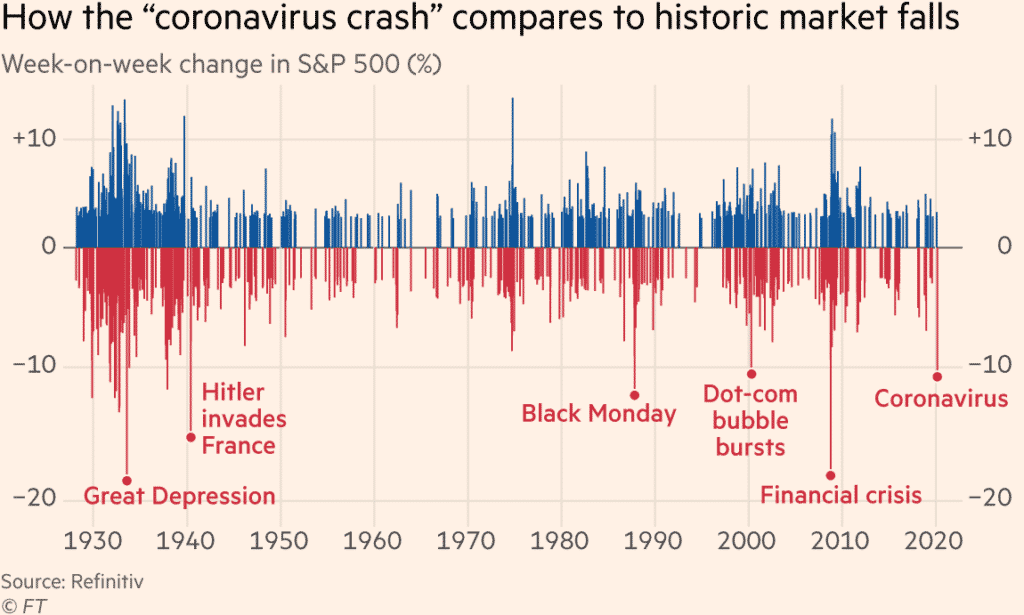
There is a reason why the fastest week-on-week changes in the S&P 500 (%) are during crashes vs bull runs (see below).

fastest week on week moves S&P 500 2ndskiesforex

The big moves to the downside (week-on-week %) are simply larger and more frequent.

This also means big week-on-week changes create a feedback loop for panic selling to continue.

What this means for investors and traders is we make quicker trading decisions during bear vs bull markets.

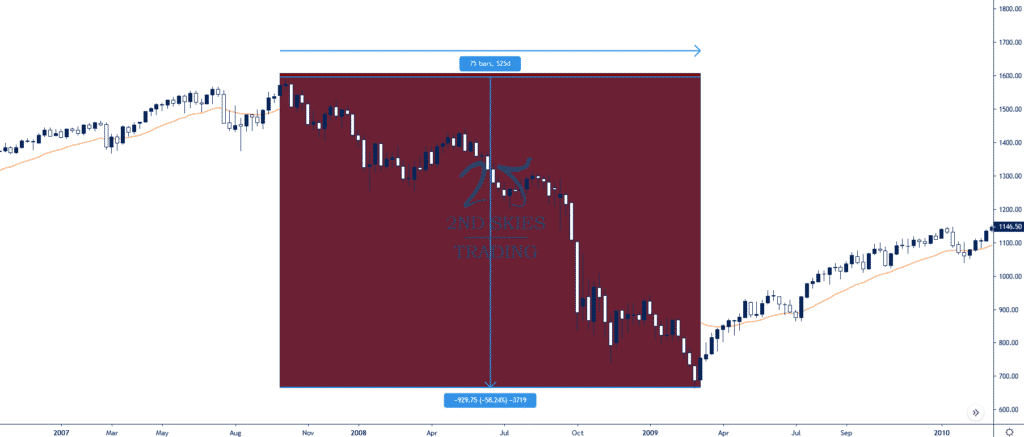
Now in comparison to the 2008 financial crisis, the S&P 500 lost 58% from Oct 07’ – Mar of 09’ over a period of 525 days peak to trough (image below).

2008 sell off S&P 500 2ndskiesforex

We’ve already lost 12.9% (about one-fifth of the 08’ drop) in just 7 days!!!

And if we happen to get another 58% decline, we’ll be looking at an S&P 500 around 1400 by the time this is over.

Translation: this selloff has the potential to be one of the most rapid declines in history. And the speed at which we’ve lost so much so fast last week could create more selling from investors globally.

Going from a low volatility environment to a high one this quickly will create stronger biological reactions, hence the formula Coronavirus + Volatility = Panic!

Is The Stock Market Going to Crash?

Short answer: I don’t know. I don’t think we’re there yet.

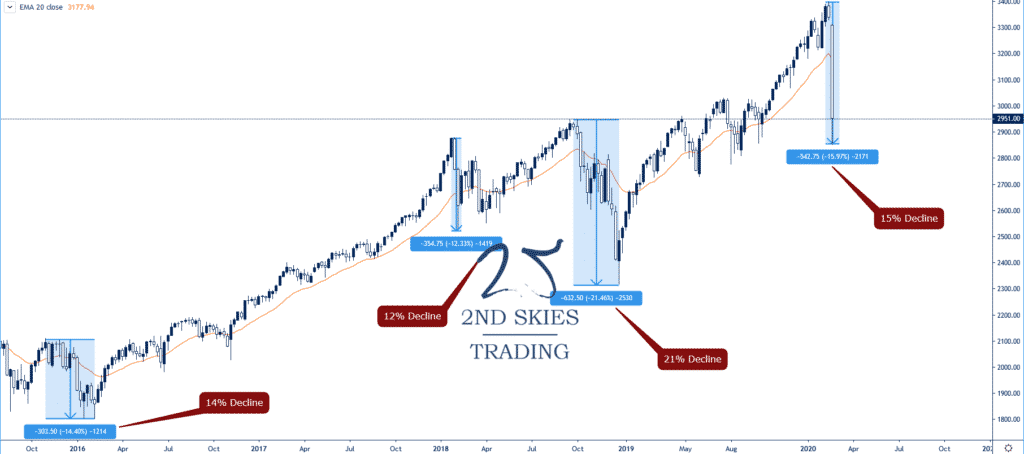
We’ve had many 12+% declines in recent history (4 total) since 2016 with a 12.33% decline (Jan 18’) being the smallest and a 21.46% decline the largest (Nov 18’).

recent declines S&P 500 2ndskiesforex

I think once we start seeing a 25% drop or larger, investors along with major institutions (Fed, Trump Admin) will start to really panic.

Combine this with the fact we’re in an election year and the last thing Trump wants is a stock market collapse.

In some sense, it’s even a bigger issue for Trump as he campaigned on his business skills, and has proudly taken credit many times about this being the “Greatest Economy Ever” pretty much anytime we’ve posted all time highs over the last few years.

Should we get a strong selloff next week and start reaching the -20% levels, expect a govt stimulus to come which (depending upon how its setup) could create a short term strong bounce.

But here’s the kicker…

Let’s say the coronavirus continues to spread from country to country with more and more population centers becoming infected.

Is a Fed rate cut going to inspire you to travel? No.

Will a Fed rate cut give you the confidence to go out in public and risk getting infected with a potentially deadly disease? No.

And this is how this threat to the markets is different than the 2008 great financial crisis.

The 08’ crisis was an economic one (over-leveraged exposure to housing) which was able to spread globally.

The coronavirus isn’t an economic issue, it’s a biological and containment issue.

Economic policies will be more effective (like in 08’) simply because it was more of a 1-1 relationship (economic problem & an economic solution).

However, economic stimulus isn’t going to change a biological health scare because the relationship isn’t a 1-1 match.

My sense tells me economic stimulus packages will be far less effective vs the actual biological and crisis management of the issue.

That is where IMO traders and investors globally should be looking for signs of a turnaround should this selloff get worse.

We haven’t gotten to the ‘Oh-Sh!t’ levels yet. Once we start to get into a 20-25% decline, then I think you’ll start to see real panic in the markets.

How to Trade & Protect Your Long Term Investments During This Time?

I wouldn’t think of buying anything till at least we see the market open this week.

How the Asian markets open will likely give a strong tell as to how the week will go.

Hence before you go rushing into what you think might be ‘cheap’ prices compared to recent history, wait to see how the market opens.

We’ve only had a few instances of the markets selling off for 3 weeks in a row since Dec 15’ (5 total) and none of them shed this much value.

For now, there are various ways you can protect your long term long term plays if you think there is more downside:

Trading Options

1) collect premium by selling calls on stocks you are holding long term

2) bear put spreads

3) buy outright puts on your long stock positions

Trading Forex

The currencies which have most benefited from this 7 day decline are JPY, CHF, EUR & USD while EM currencies suffered heavily (MXN, RUB, ZAR).

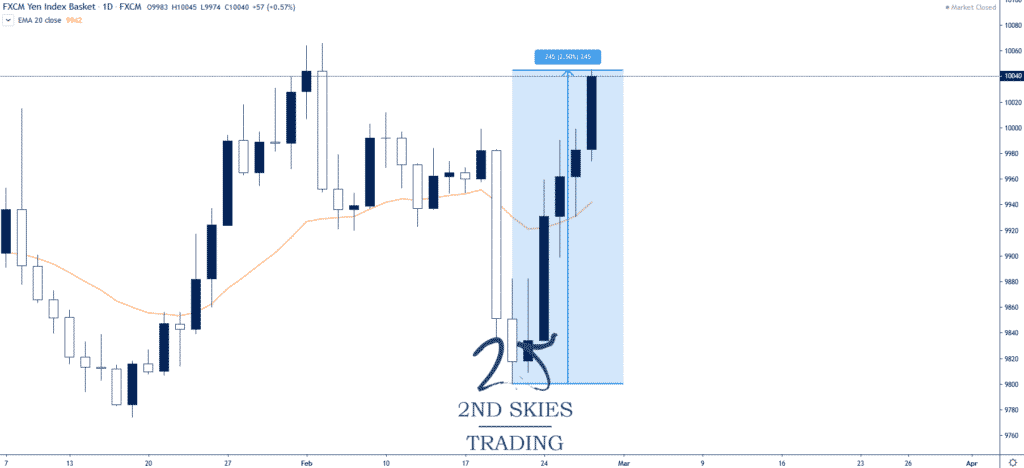
The JPY basket (JPY vs USD, EUR, GBP, CAD & AUD) gained 2.5% last week (image below).

jpy basket 2ndskiesforex

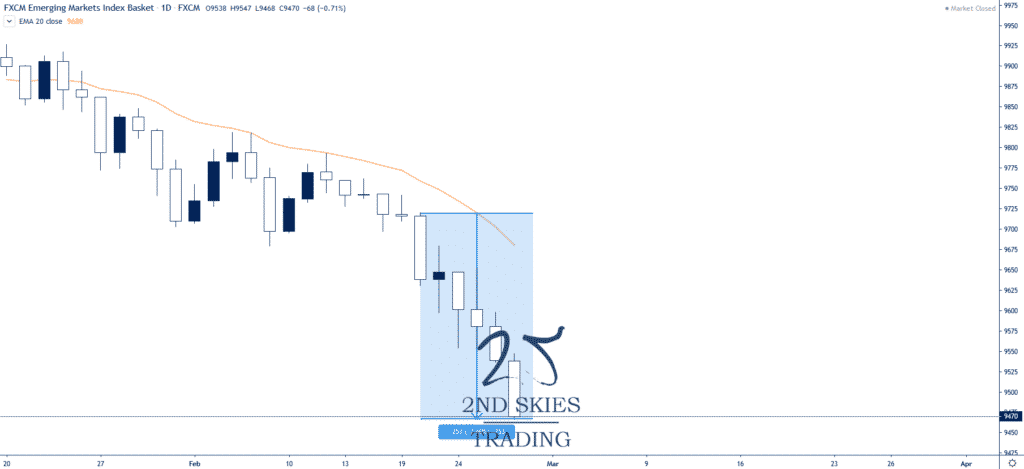
Meanwhile the EM basket (USD vs CNH, MXN, ZAR & TRY) lost 2.6% over the same period (image below).

em basket 2ndskiesforex

The EM currencies which suffered the most losses last week were MXN vs EUR (-9%), RUB vs EUR (-8.8%), RUB vs JPY (-9.5%), MXN vs JPY (-9.6%), CHF vs MXN (9.5%), & the CHF vs RUB (8.8%).

If the virus continues to spread, expect further capital to move into these safe haven currencies vs EM betas.

It’s important to note many of these currencies ran into some key support & resistance levels, rebounding a bit to end the week.

Forex currencies tend to overshoot key levels during major crisis, so if we see them blow past many of the current key support & resistance levels, we could be reaching all time highs or lows (EURZAR, USDRUB, USDMXN) on the quick.

I’ve been trading many of these pairs on the 5 minute charts trading intraday breakout setups with two positions.

I’d suggest using the first position to hit a medium term target while letting the second one run and capture as much alpha as possible till momentum changes manifest in the short term price action.

But this is only recommended if you are doing day trading.

Trading Stocks

If you feel an uncontrollable urge to buy stocks, I suggest the following plays:

Watch the market leaders who exhibited strength heading into the selloff and performed well on Friday. If they continue to exhibit strength, there may be a potential buy, but watch the price action:

1) Microsoft (MSFT) which gained 7.7% on Friday

2) Facebook (FB) which climbed 6% on Friday

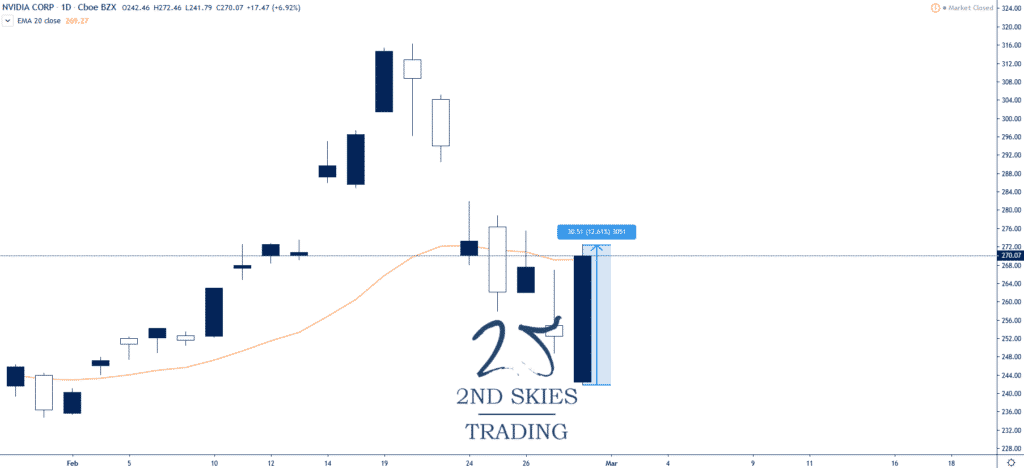
3) Nvidia (NVDA) grabbing a 12.6% gain to end last week

nvidia stock trading 2ndskiesforex

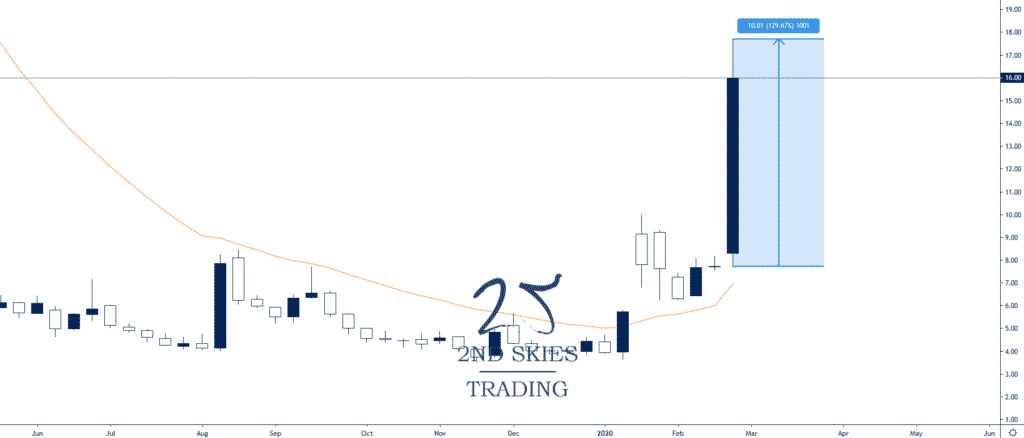
4) If you don’t mind trading nano, micro and small caps, take a look at pharma stocks which have done well recently: NVAX +129% low to high last week, MRNA +96%, and for the truly brave micro cap trader CODX +591% last week low to high (big cajones required 😉)

Novavax (NVAX) chart below:

novavax stock trading 2ndskiesforex

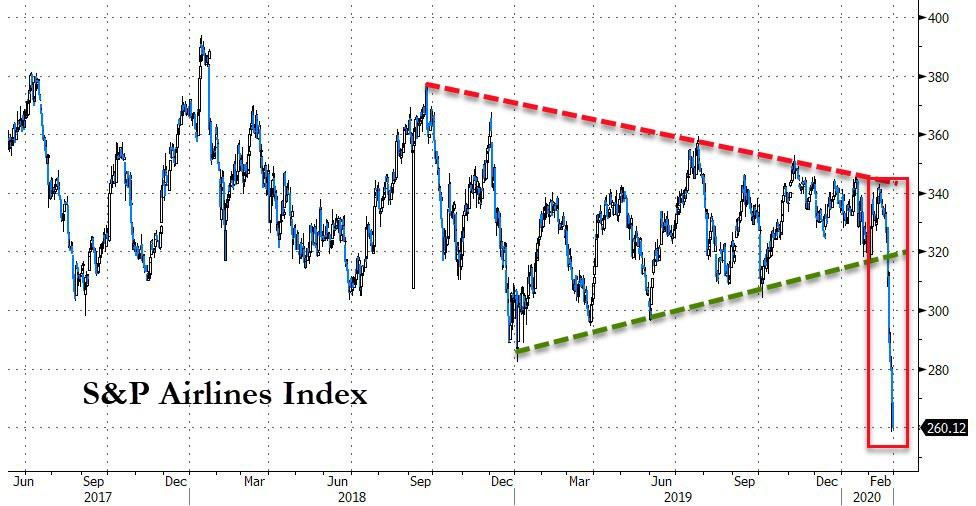
1) Sell Airlines (who wants to fly to another country when there’s an outbreak?) – source: bloomberg

NOTE: A more targeted method would be going after airlines in countries where travel bans or warnings are issued.

sp500 airlines index 2ndskiesforex

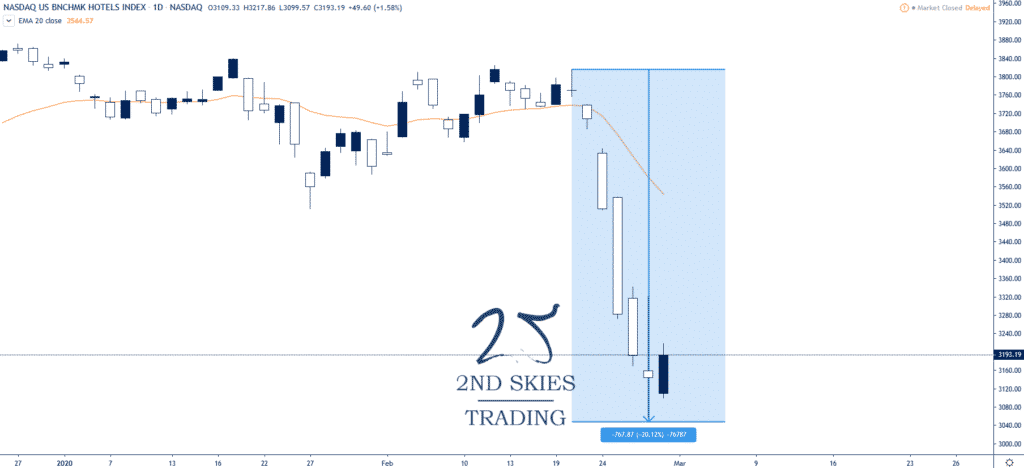
2) Sell Hotels/Entertainment which is down 20% on the week (same reasons as above)

us hotels benchmark index 2ndskiesforex

There’s been a lot of profit taking in commodities, so I’d wait for a change in the short term price action context before getting long (gold and silver in particular).

Wrapping It All Up

Now is not the time to be listening to CNBC analysts, most of whom are not trading. Last week many were all calling stocks ‘cheap’ and in the process getting their a$$’s handed to them.

This is a time to be alert and nimble, using good risk management as the volatility moves on these instruments can wipe out weeks or months of gains if you’re not careful.

Hence trade smaller positions than your usual risk % per trade. Try more ‘proof of concept‘ trades where you put small feeler trades out, and if it progresses, then add on size.

I don’t think the stock market is at its ‘OH SH!T‘ moment yet, but we could get there fast.

I’ve traded now for 20 years and went through 2 major financial crisis (2001 dot.com bust & the 2008 great financial crisis).

The first one I didn’t know what I was doing and performed poorly.

The second one I learned my lesson and killed it.

Traders can make a lot of money if you’re smart and agile, defensive when you need to be and aggressive with precision.

But you’ll need mental toughness to manage your emotions and mindset during these periods.

Do that and you can make a killing. You may not see another time like this for years as its been over 12 since the GFC of 08′.

Hence, avail yourself of the opportunity, be patient, allow for more space in your stop losses due to the increased volatility, and trade with the most impulsive moves till you see changes in the price action and order flow across a broad base of instruments.

******

This was a monster article that took hours upon hours to write and publish. Please make sure to pay it forward by sharing it with others on social media and leaving your feedback below.

Until then, good luck trading and I’ll see you out there in the field.

Want FREE Trading Charts For Forex, Stocks or any asset class? Check out our top charting provider Trading View.

Check out my latest video How To Day Trade Stocks Using Volume

Want my Price Action Course for FREE? Click here to find out how.

Forex Trade Idea: EURMXN – Corrective Structure At Top, Looking For Breakout (daily chart)

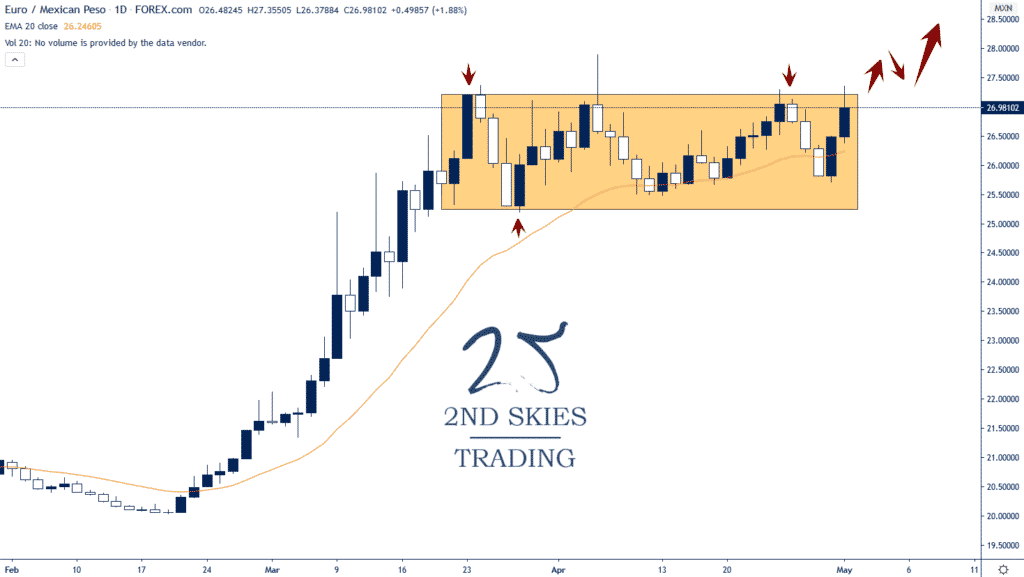
Price Action Context

The EURMXN forex pair has been consolidating in a corrective structure near the top of the trend since late March, so over a month now.

I’m suspecting a breakout is coming soon, more likely to the topside, so am looking for a breakout trade.

eurmxn forex pair 2ndskies trading

Trending Analysis

ST neutral inside the corrective structure, but MT bullish while above 25 on a daily closing basis.

Key Support & Resistance Levels

R: 27.21, 27.90

S: 25.25, 23.90

Stay tuned to our members market commentary for updates.

******

Index Trade Idea: S&P 500 Showing More Signs Of Weakening (daily chart)

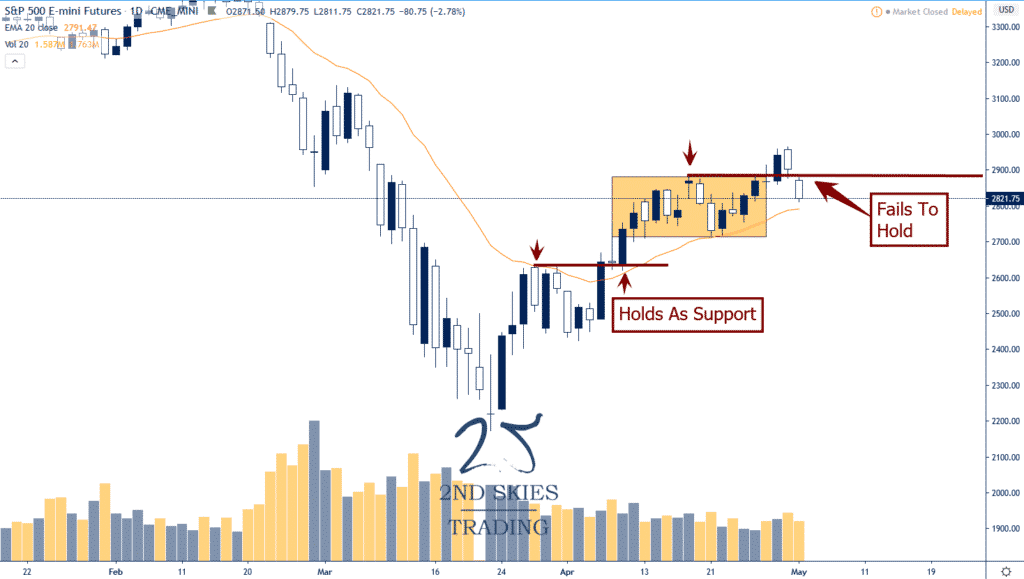
Price Action Context

After an impressive low volume bounce since late March from sub 2200 to almost taking out 3000, the S&P 500 has started to show some signs of weakness in the price action.

Of particular note is how the 2nd leg high (unlike the first) did not hold on a pullback and thus broke to end last week.

Still, the S&P 500 needs more technical weakness to call this run over, and breaking below the 20 EMA & dynamic support would further add to this case.

s&p 500 trade idea 2ndskies

Trending Analysis

ST bearish while below 2890 on a daily closing basis, but MT bullish until daily close below 20 EMA.

Key Support & Resistance Levels

R: 2885, 2960

S: 2788, 2630

******

Chris Capre’s current live open price action & ichimoku trades: USDMXN, EURRUB, EURMXN, BIG, DIS, AC, ISD

New to Forex? Then check out my FREE Learn Forex Trading Course with videos, quizzes and downloadable resources

Top Trade Review: Check out our latest Top Forex Trade Review with my student banking +158 Pips on the EURCHF nailing a PERFECT ENTRY!

Forex Trade Idea: GBPJPY – Buy & Sell Setups Available (daily chart)

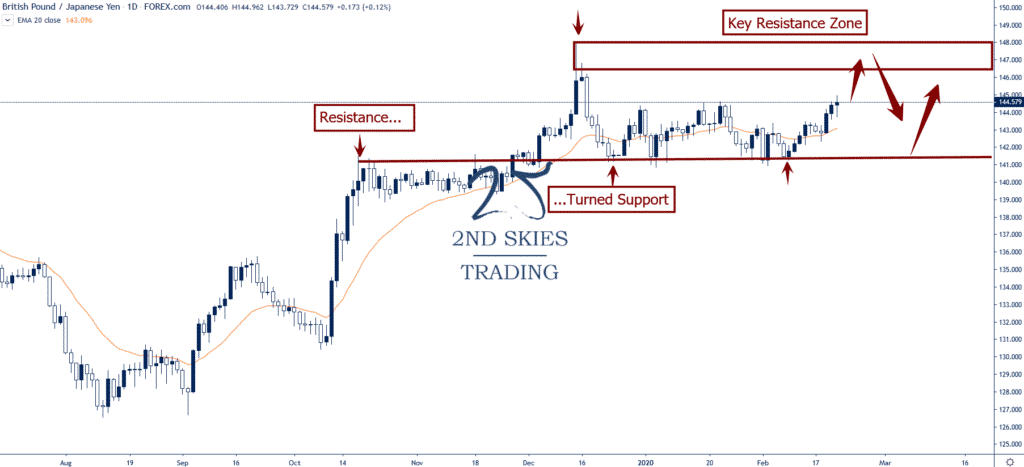
Price Action Context

For all of 2020, the GBPJPY forex pair has been stuck in a 325 pip range between 141.25 and 144.50.

The pair however has gained 7 of the last 10 days, and is making an earnest attempt to break the yearly highs.

Doing so would put key resistance zone between 146.60 and 148 into play where likely profit taking will emerge, along with some sellers.

Meanwhile a failure to break the yearly highs would likely put 143 and 141.25 into focus.

gbpjpy forex pair 2ndskies

Trending Analysis

ST & MT neutral while inside the 325 pip range. Watch break for next technical direction.

Key Support & Resistance Levels

R: 146.60, 148

S: 141.25, 139.45

Stay tuned with our members market commentary for updates.

******

Commodity Trade Idea: XPDUSD (Palladium) – Makes New Yearly Highs, Lifts Support Zone (4hr chart)

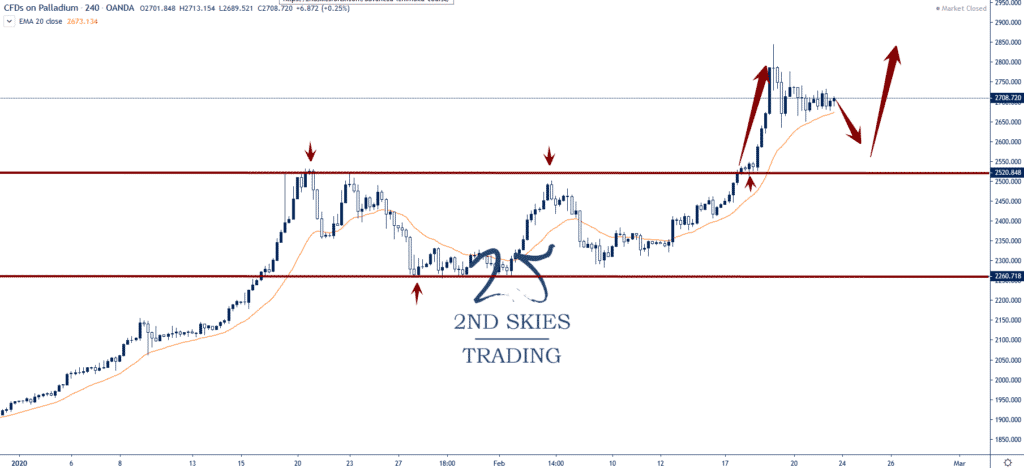
Price Action Context

After going gang-busters to start the year, climbing from sub 2K to 2520 last month, Palladium formed a large corrective structure for about a month.

That structure just got annihilated as the precious metal broke through the 2520 resistance ramping up to 2545 in a couple days.

Since then the PM has consolidated its gains while tidily holding above the 4hr 20 EMA (chart below).

palladium bullish setup 2ndskiesforex

Trending Analysis

I’m bullish on Palladium till we get a weekly close below 2500. I’m watching for corrective pullbacks towards support to get long.

Key Support & Resistance Levels

R: 2845, 3000

S: 2520, 2260

******

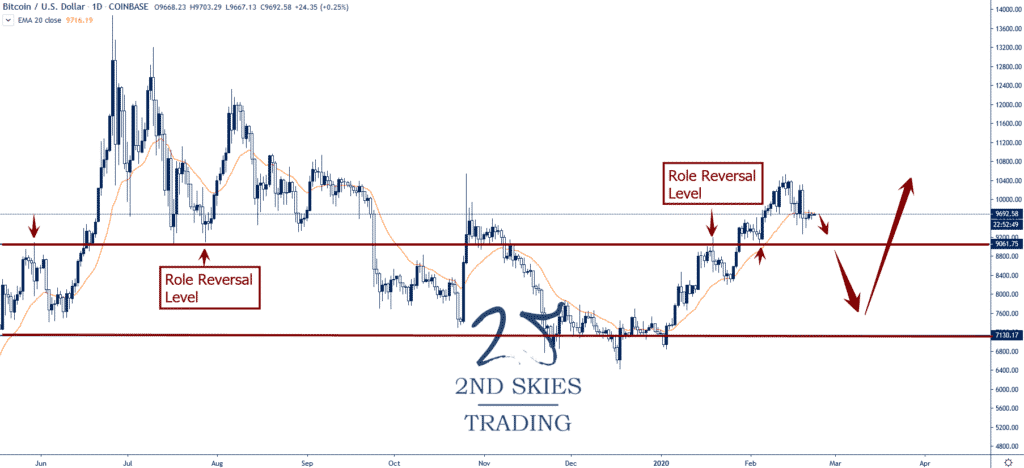
Crypto Trade Idea: Bitcoin (BTCUSD) – Looking to Buy On A Pullback (daily chart)

Price Action Context

Bitcoin has had a pretty solid start to the year, up +30% on the year.

You’ll notice the strong momentum on the daily chart below in how the price action maintained its bullish position above the 20 ema.

Recently however, the cryptocurrency has played on both sides of the 20 EMA, suggesting the momentum short term is weakening.

To me, the overall bull trend to start the year is in place, but may be taking a pause.

I’m looking to buy a pullback into support with the first potential level being the role reversal level around 9060.

bitcoin trade idea 2ndskiesforex

Trending Analysis

ST neutral but MT bullish while above 7250 on a weekly closing basis.

Key Support & Resistance Levels

R: 10450, 12000

S: 9060, 7130/7250

******

Chris Capre’s current live open price action & ichimoku trades: USDMXN, EURRUB, EURMXN, BIG, SIG, DIS

New to Forex? Then check out my FREE Learn Forex Trading Course with videos, quizzes and downloadable resources

Top Trade Review: Watch this live trade review of my student banking +115 pips of PROFIT & +11R on the USDJPY

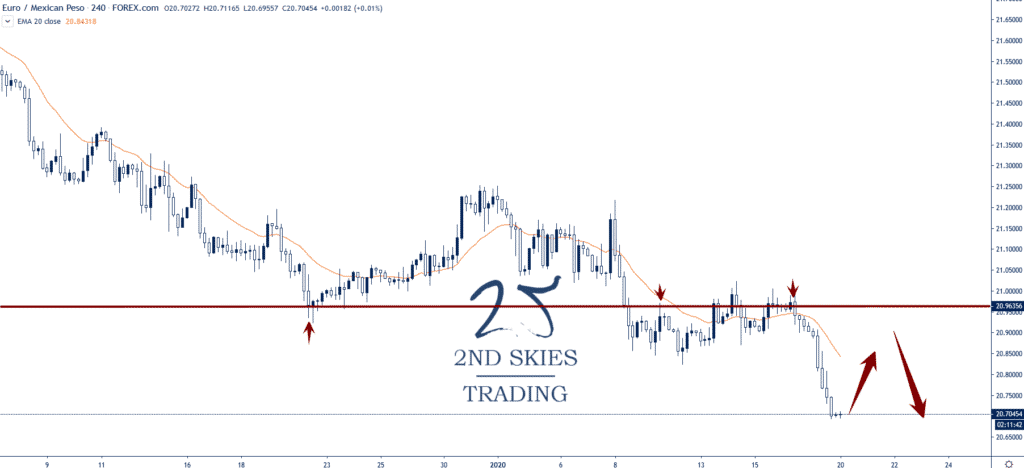
Forex Trade Idea: EURMXN – Impulsive Selling At Resistance, Staying Bearish (4hr chart)

Price Action Context

Continuing with the bear trend, the EURMXN had found some minor support around 20.96 which mostly mounted a small corrective pullback up to 21.25.

This was followed by more selling which broke below the prior support.

Notice how the corrective pullback really struggled at the 20.96 resistance level which led to impulsive selling price action.

This tells me the bears are still in control so I’m looking to add to my shorts by watching for a corrective pullback into resistance to trade with the trend.
Trending Analysis

Bearish ST and MT so am staying bearish until we get a weekly close above the 21.30 level on a weekly closing basis.
Key Support & Resistance Levels

R: 20.96, 21.25

S: 20.12, 19.03

Stay apprised with our members market commentary for updates.

******

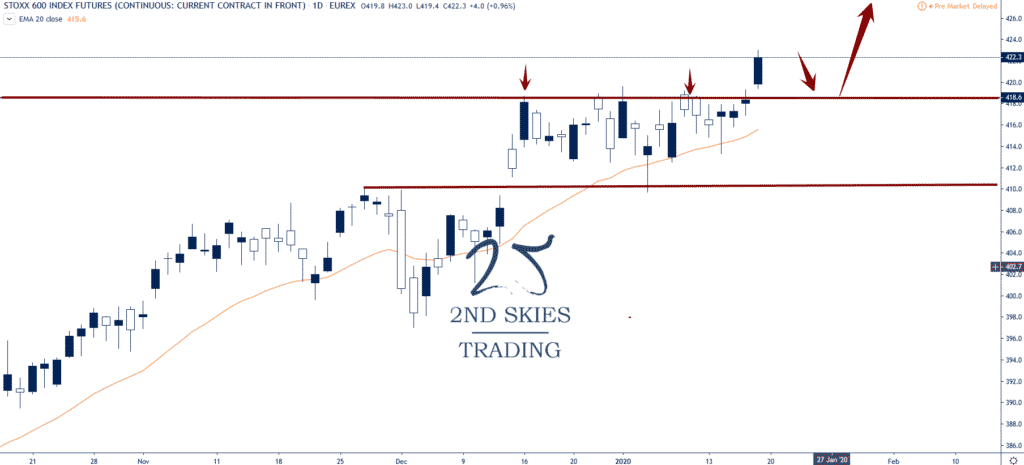
Index Trade Idea: Stoxx 600 – Breakout In Play, Looking To Buy Pullback (daily chart)

Price Action Context

In our top trades for 2020, we talked about the Euro Stoxx 600 being bullish and looking to buy on a pullback into support around 412.

The index has done exactly that, launching higher and forming a breakout setup which has cleared the 2019 all time highs in 418 and is now holding well above it.

I’m expecting this price action to continue so am looking to get long on a pullback into support.

euro stoxx 600 price action 2ndskies

Trending Analysis

ST & MT bullish and looking to stay long till we get a weekly close below 408.

Key Support & Resistance Zones

R: 450, 500

S: 418, 410

******

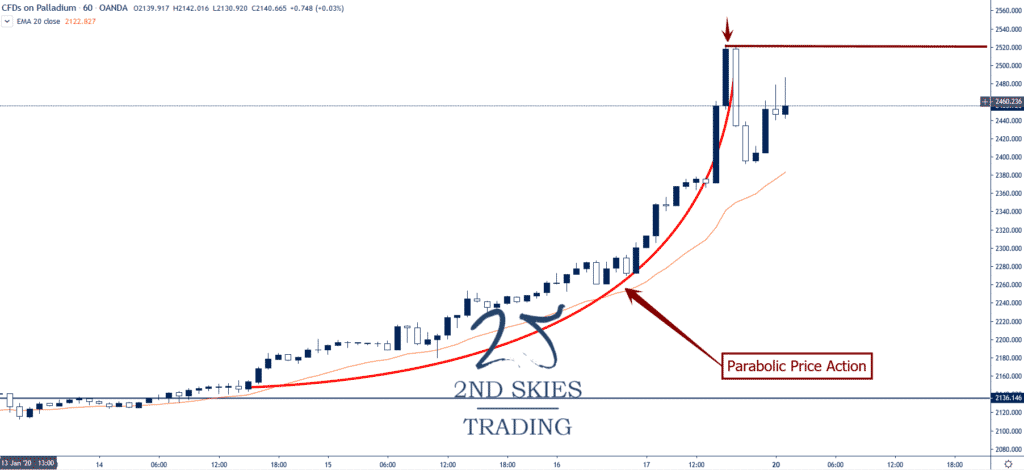
Commodity Trade Idea: XPDUSD (Palladium) – Parabolic Price Action, Watching Resistance (1hr chart)

Price Action Context

As we commented about on our youtube channel, Palladium has gone parabolic to end last week, going from 2136 on the 15th skyrocketing up to 2520 by the 17th.

If you look at the curvature in the price action, it went parabolic, which suggests possible exhaustion.

The PM pulled back sharply to end last week almost closing below 2400.

palladium parabolic price action

Trending Analysis

MT bullish but ST we need to clear the parabolic highs above 2520 to keep the bull trend going. Otherwise this level will act as resistance.

Key Support & Resistance Levels

R: 2520, 2600

S: 2394, 2136

Chris Capre’s current live open price action & ichimoku trades: GBPUSD, SUI20, CORN, USDMXN, CHRW

New to Forex? Then check out my FREE Learn Forex Trading Course with videos, quizzes and downloadable resources

How do you cut losses short and let winners run? Watch my latest video where I share the first method for doing this.

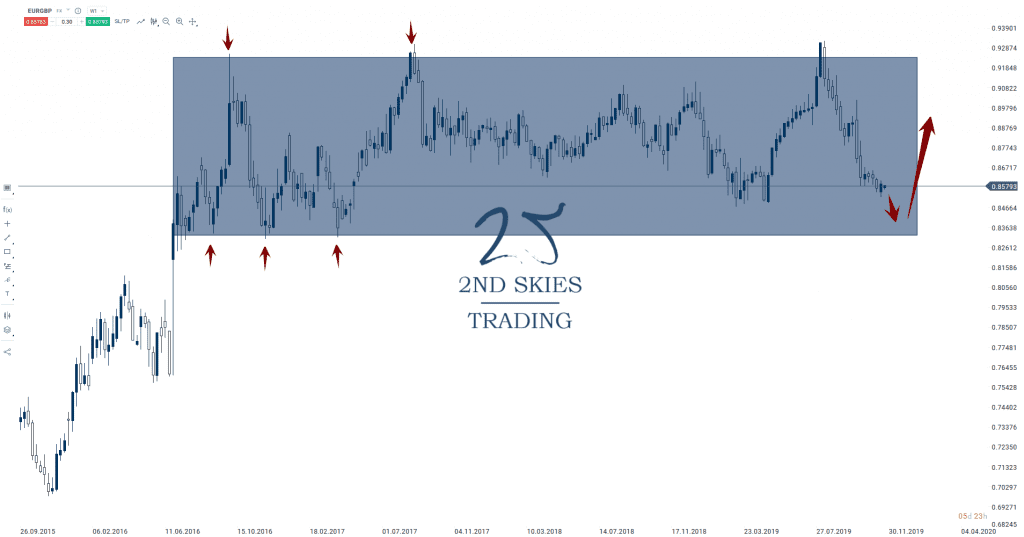
Forex Trade Idea: EURGBP – Approaching Structural Support (weekly chart)

Price Action Context

For the last 3 months, the EURGBP price action has been impulsive, selling off from the 93 handle down to mid 85’s.

The key is to take a step back and look at the larger time frames to see the overall structure the pair has been in for the last 3 years.

We are approaching a 3 year support zone that has not seen a weekly close below it since July 2016, hence there is likely some bulls looking to get long soon while some bears will potentially be taking profit on their shorts soon.

eurgbp forex pair trade setup 2ndskiesforex

Trending Analysis

ST bearish but LT neutral to bullish while inside this large corrective structure. Bulls should watch for trade setups near the upcoming support area.

Key Support & Resistance Levels

R: 9240, 9315

S: 8500, 8336

Stay tuned to the members market commentary for updates.

******

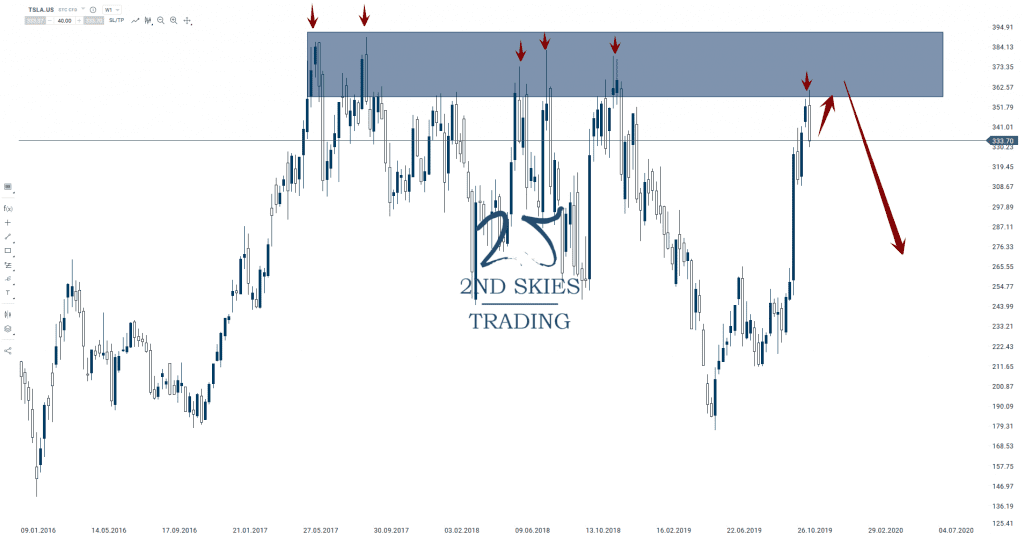
Stock Trade Idea: Tesla (TSLA) – Looking to Short Into Major Resistance (weekly chart)

Price Action Context

In our market commentary two weeks ago, we suggested shorting Tesla ($TSLA) into the major resistance zone and all time highs. That is exactly what has happened upon the first rejection of this resistance zone but we suspect there might be another chance to short.

tesla stock trade idea 2ndskies

Trending Analysis

ST bullish, MT Neutral while below this major resistance zone so look for potential trade setups to get short into this resistance area.

Key Support & Resistance Levels

R: 357,  385

S: 258, 185

******

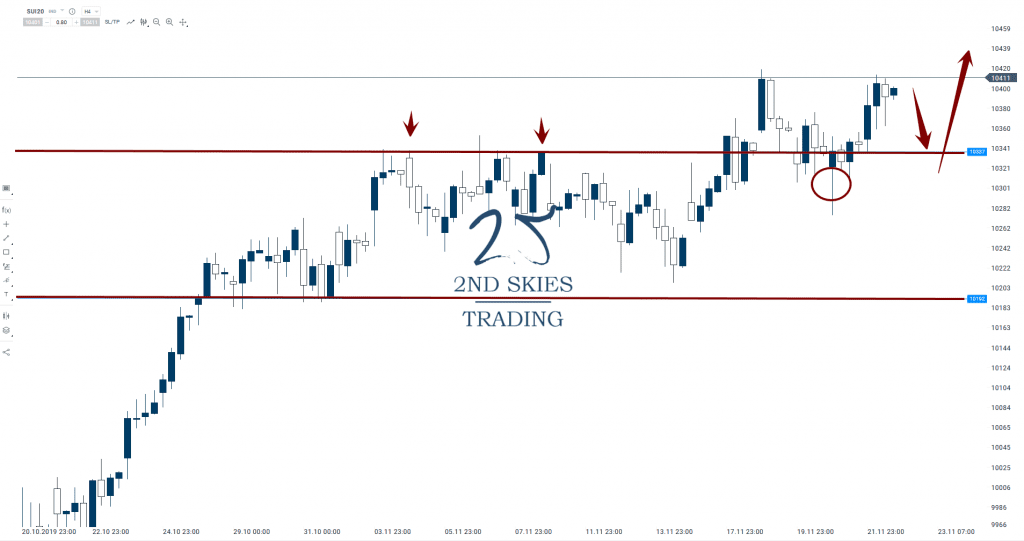
Index Trade Setup: SUI20 Long Breakout Setup In Profit, Potential New Setups (4hr chart)

Price Action Context

Last week in our market commentary, we talked about getting long on the SUI20 index looking for a breakout pullback setup once it cleared 10337.

The index did just that and has climbed higher forming a new all time high in the process.

sui20 trade setup 2ndskies

Trending Analysis

ST and MT bullish while above 10192 on a weekly closing basis. Looking to add longs on a pullback towards 10300.

Key Support & Resistance Levels

R: 10410, 10500

S: 10323, 10192

******

Hello Traders – every single week, I do a weekly coaching session with my traders and students in our price action course. We cover everything from trade ideas we posted during the week, trade setups I’m looking at, trading psychology, price action – anything my students have questions on.

In this week’s video, I’m sharing with you several clips from our weekly trader coaching session along with trades that I’m looking to do in the next week.

Get a FREE practice forex trading account:

– For EU/UK residents visit this link: http://go.xtbaffiliates.com/visit/?bt…
– For Non-EU residents visit this link: http://go.xtbaffiliates.com/visit/?bt…

Want to get my Price Action Course for FREE? Click here to find out how: https://2ndskiestrading.com/xtb/

⏰TIMESTAMPS⏰
1:53 – when trading intraday and only forex majors, do I need to take into account this?
2:09 – if trading intraday, you need to know volatility for each forex pair
3:33 – to get funded by me, what kind of a live track should I have and how much capital?
4:50 – how do you know if your meditation session has been effective?
7:23 – when trading in a corrective structure, should we only have a neutral bias in the price action?
9:25 – is ichimoku cloud trading something totally different from trading price action?
11:08 – NZDJPY (forex pair) trade ideas and price action analysis
15:48 – GBPCHF (forex pair) trade ideas and price action analysis
18:07 – WTI Oil trade ideas and price action analysis

Read more

Chris Capre’s live open price action and ichimoku trades: EURUSD, GBPUSD, AUDJPY, EURCZK, CAC40, VIX

New to Forex? Then check out my FREE Learn Forex Trading Course with videos, quizzes and downloadable resources

What is our preferred web based trading platform? Check out our latest platform review on the xStation 5.

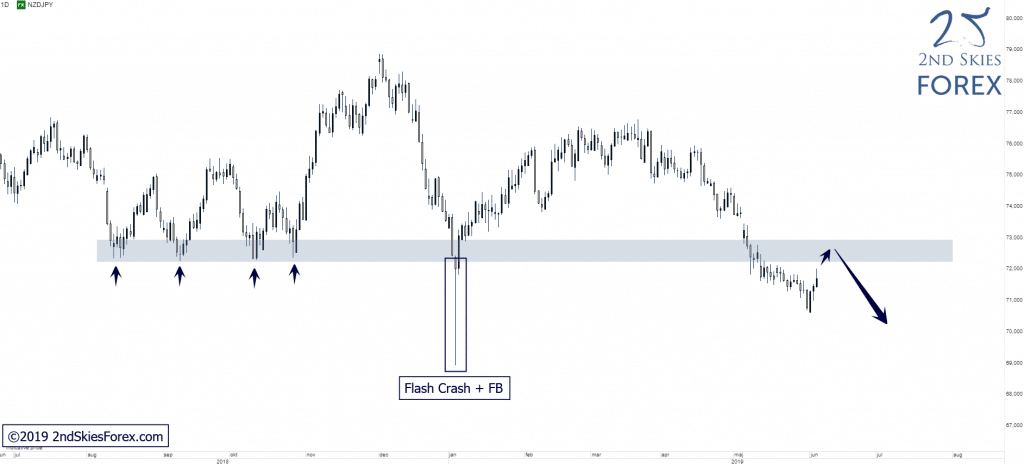
NZDJPY – Pulling Back Towards Key Resistance (Daily chart)

Price Action Context

On the 13th of May, NZDJPY cleared a LT key support zone followed by a 2-3 week correction before selling picked up again. After putting in a ST bottom + reversal around 70.70, price is now closing in on the broken LT support, now acting as resistance. If bears can defend this resistance zone successfully, a bearish continuation towards the major support around 69.80, dating back all the way to 2009, is likely IMO.

nzdjpy-forex-trade-signal-2ndskiesforex

Trending Analysis

Bearish LT bias and sellers can look for potential trading locations around the key resistance.

Key Support & Resistance Zones

R: 72.25 – 72.85
S: 68.25 – 69.80

Chris Capre’s live open price action and ichimoku trades: EURUSD, GBPUSD, AUDJPY, EURJPY, EURCZK, EU50

New to Forex? Then check out my FREE Learn Forex Trading Course with videos, quizzes and downloadable resources

What is our preferred web based trading platform? Check out our latest platform review on the xStation 5.

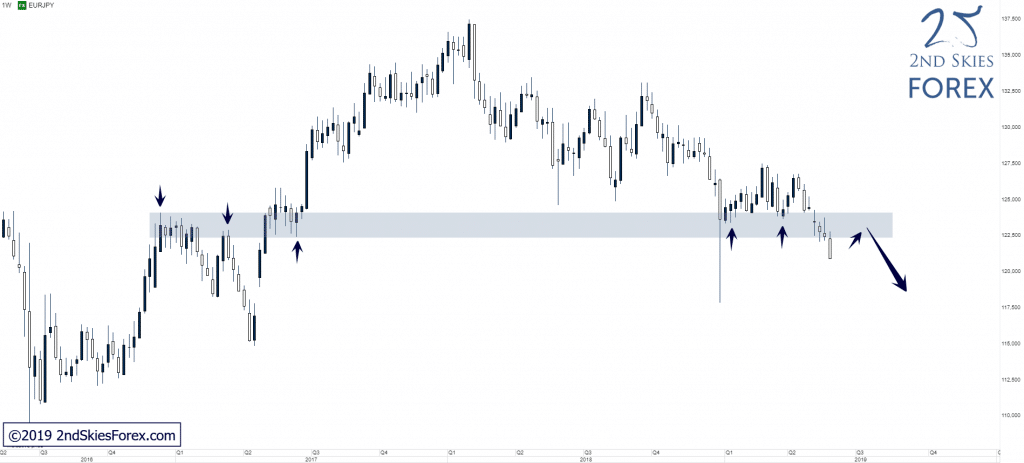
EURJPY – Strong Weekly Close Below LT Key Support, Now Resistance (Weekly chart)

Price Action Context

The potential strong weekly close below the LT key resistance zone we hinted about in our mid-week commentary manifested and we can consider this zone fully cleared at this point.

eurjpy-forex-trade-setup-2ndskies

Trending Analysis

LT bias is bearish and bears can look for potential shorting opportunities on pullbacks towards the weekly zone, alternatively look for potential RRL plays on the H4 charts where currently a MT CVT is in play.

Key Support & Resistance Zones

R: 122.50 – 124.00
S: 118.60 – 117.70

Stay up to date with our members daily trade ideas for ongoing commentary.

******

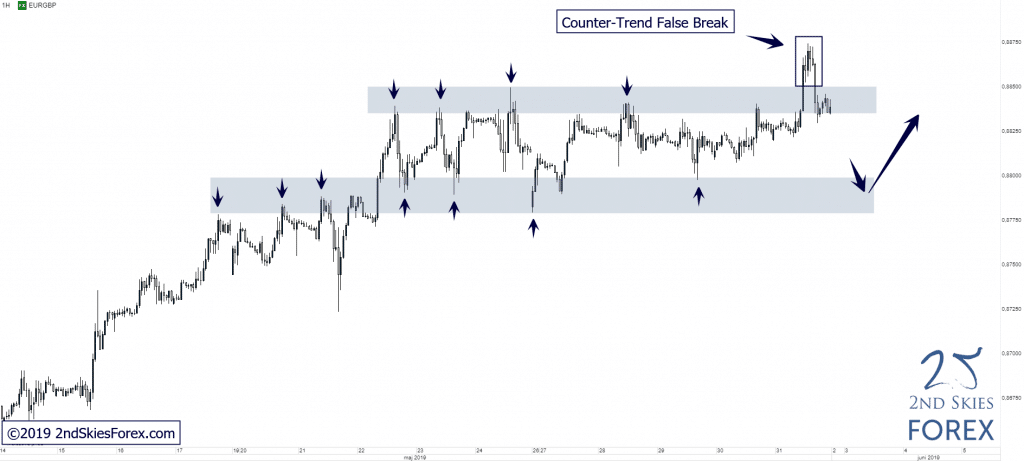
EURGBP – Counter-Trend False Break @ Top of SCS (1h chart)

Price Action Context

As already mentioned in our daily trade ideas on Thursday, EURGBP is trading within a SCS on top of a bull trend. Price is extended from its mean on the HTF, suggesting a ST exhaustion and towards the end of past week, bulls failed to push price further north, printing a counter-trend false break setup at the top of the SCS.

eurgbp-false-break-setup-2ndskiesforex

Trending Analysis

The false break at the top of the SCS opens up for a likely move back towards the support of the corrective structure which can offer potential buying opportunities to bulls. Should the SCS support fail to hold, a move down towards the LT support we’ve mentioned in earlier commentaries is likely IMO, which can offer further trading opportunities to bulls.

Key Support & Resistance Zones

R: 0.8835 – 0.8850
S: 0.8780 – 0.8800

******

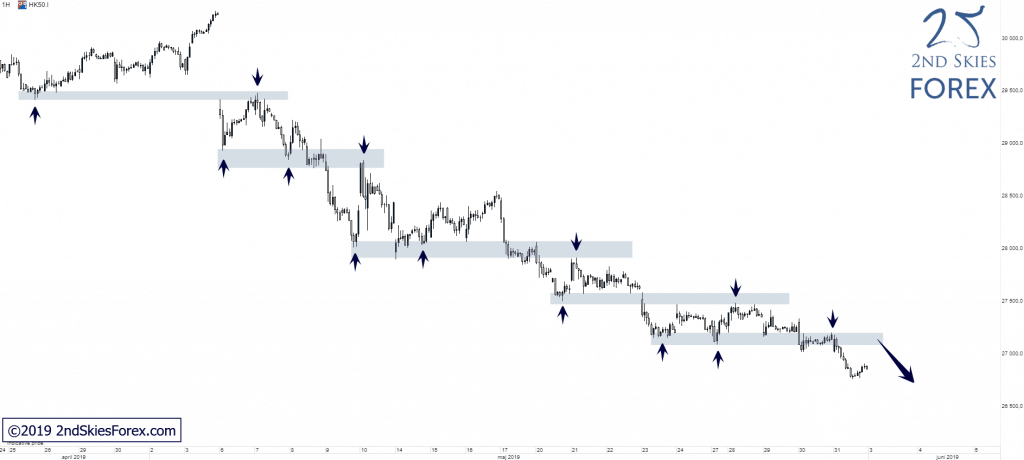
Hang Seng 50 – Bearish CVT Still Alive (1h chart)

Price Action Context

The ST bearish CVT is still alive and has offered multiple potential RRL-plays since we we mentioned it in our market commentary on the 19th of May. Congratulations to those of you who were able to take advantage and profit from these ST trading opportunities. The trend seems to be slowing down slightly as the bearish impulsive moves are getting weaker, but as long as the price action does not break back impulsively above the last broken support, the trend is in play.

hang-seng-index-trading-signals-2ndskiesforex

Trending Analysis

HTF is non-volatile + MT & ST bias are bearish and bears can look for potential shorting opportunities on weak pullbacks towards the last broken ST support, now resistance.

Key Support & Resistance Zones

R: 27 090 – 27 200
S: 26 500 – 26 750

A question I got today from one of my facebook followers said “Hey Chris, what kind of forex trading strategies do you use and how do you use them?” This was too big a question to dole out over my 2ndskiesforex facebook page, so I decided to write a short post about this.

What Forex Trading Strategies Do I Use?

Although I use the same strategies I do for all markets, these are the ones I use for trading forex as well, which can be grouped into two main classes:

Price Action & Ichimoku Cloud Trading

Regardless of the asset class, I trade price action and ichimoku cloud trading, however I use them both differently to some degree which I’ll clarify.

Price Action Trading

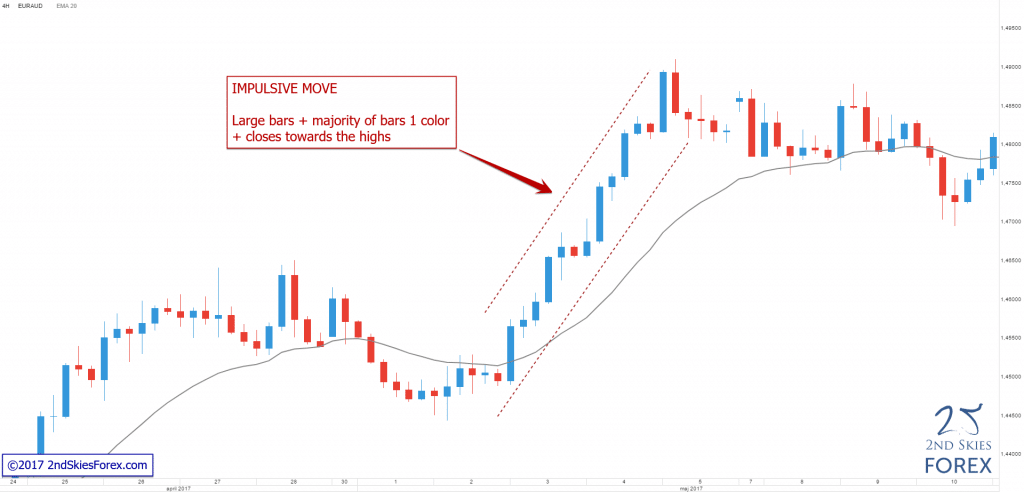
As a whole, I’m always using price action because I consider it to be a ‘core’ or fundamental skill. I am always using my price action skills regardless of the instrument, asset class, time frame or environment.

2SF-Trading-Article-2017-05-Impulsive-move-1024x492

So I can be trading price action strategies on the 1 minute, 3 minute, 5 minute and 1 hour time frames for day trading, or the daily and 4 hour time frames for swing trading. I can be trading price action on forex, futures, stocks, commodities, global indices, CFD’s, forex options – you name it. And I’m always using my price action skills in any environment (trending, ranging, choppy or clean).

It is such a fundamental skill – very much like a good football player is using footwork, that I’m always using it and applying these skills on every chart.

Make sure to notice my use of the word ‘skills‘ here. It’s important you understand why I’m using that (which I’ll elaborate more on later).

Ichimoku Cloud Trading

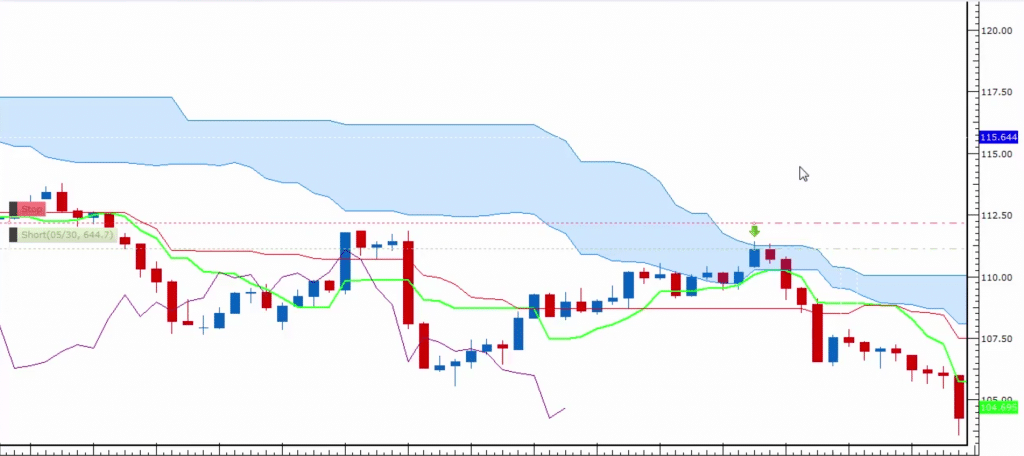
Ichimoku cloud trading as a whole is what I consider a more ‘specialized‘ skill, so I’m not using it on every chart, and am applying it in a much more specialized way. I don’t consider ichimoku to be a core skill, but I do consider it to be a powerful one when understood and used properly. Ichimoku will give you a unique perspective on future support and resistance levels, what the underlying momentum is (strong, medium or weak), what the current ichimoku wave structure is like (and will likely look like in the future), where are potential turning points, etc.

live-ichimoku-trading-2ndskiesforex

I apply ichimoku pretty much on any instrument, however one main difference is I don’t really trade it on lower time frames, so any time frame below the 1 hour chart. That is because my testing really hasn’t found it to be stable enough on lower time frames.

Is it possible you can use on those lower TF’s? Yes, but I haven’t found a consistent skillful way to do it over time. The time frames I trade ichimoku on are the 1 hour, 4 hour, daily, weekly and monthly.

So in essence, I’m using it for more short term swing trading, medium term swing trading, and for some long term trend changes to capture some really large moves, moves that may take months to fully deliver, but could often be in the 500-1000+ pip plus range. The longer moves often add a second income through the carry trade, so an opportunity for two incomes on the trade.

Getting Back To Skills

If there is one thing I’ve learned which has separated me from most trading mentors, is that, just like great athletes focus on continually building their skills, I focus heavily on building trading skills.

I’ve seen some forex trading mentors churn out trading strategy after trading strategy, sometimes 20+ over the years. However if you notice, the strategies they came up with 5+ years ago they are not using today. Meanwhile, I am still using many of the same strategies from the last 5 years, and they’re still effective as I’m a verified profitable trader.

What’s the difference between me and the strategy churners?

My core focus is on trading skills because trading is a skill based endeavor. It’s not a ‘strategy’ based endeavor, but a skill-based endeavor. When you realize this, you’ll see a major change in your mindset. You’ll start thinking like a millionaire trader.

If you have solid trading skills, you’ll be able to adapt to any market, and the market is always changing. This is why so many struggling traders fail to make money. They think short term. They think they only need a trading strategy to make money in the markets.

Think about it like this: would you ever walk into a martial arts school, and ask them “Can you give me a martial arts strategy for beating up someone 6’3″ tall?” Of course not, because there would be no one strategy for that person, and even if the sifu could give you one, without the proper skills to execute that strategy (stance, footwork, punching/kicking technique, muscle memory, strength, speed, accuracy, etc.), it would be completely useless.

The path to becoming a black belt in any martial arts is paved through building skills.

Hence, if you’re just thinking you need a winning strategy to make money trading – you’re using the wrong approach. What you need are trading skills that work on at least one instrument or asset class across multiple environments, and ideally across all time frames. If you have that, then you’re adaptable and have a set of skills which allows you to handle all the environments you will encounter.

Hopefully you can now see why a profitable trading strategy alone is insufficient to make money trading long term.

So there you have it – those are the two forex trading strategies I use every day when I’m trading the forex market (along with trading stocks, futures, options, commodities, global indices and CFD’s).

I didn’t get into any specific price action or ichimoku strategies. If you want to learn more about my specific trading strategies, you can check out my price action course, or my ichimoku course where you will learn exactly how I trade those strategies day in – day out.

I hope you enjoyed this trading article. Don’t forget to leave a comment sharing your thoughts below.

Until next time, may you find real progress in your trading performance and mindset.

Last year I did a top trade ideas for 2018, and now that I’m really centering my new year’s around losar, it’s time for a new trade ideas for this year. But before we jump into that, we need to hold my feet to the fire and see how I did last year. Let’s jump in and review.

2018 Top Trade Ideas Reviewed

I gave 3 trade setups and ideas free to the public which are below.

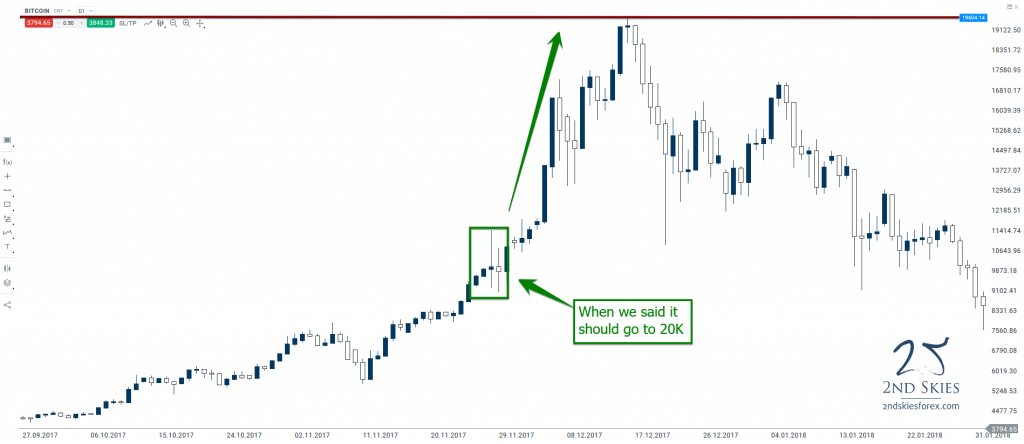
2018 Trade Idea #1: BTCUSD Will Hit 20K

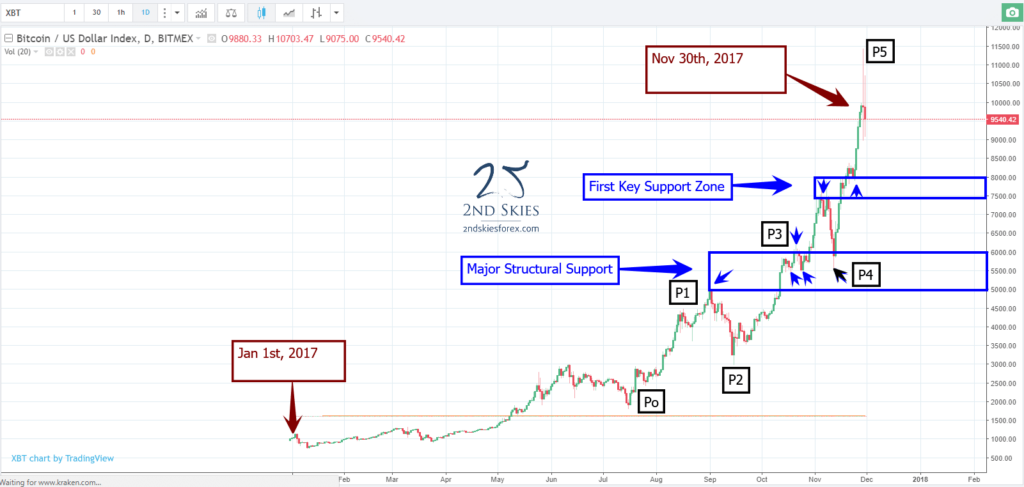
Here is the chart before my trade recommendation (image below).

bitcoin-price-action-chart-2ndskiesforex

And here is the chart after.

bitcoin-2019-trade-ideas-2ndskiesforex

How close did I get? It got within $50 of 20K, or .2% from my target while gaining about 80% from its price near 11K.

The Verdict: A Win. Hard to argue otherwise.

2018 Trade Idea #2: USDCAD Should Pullback And Then Hit 1.35

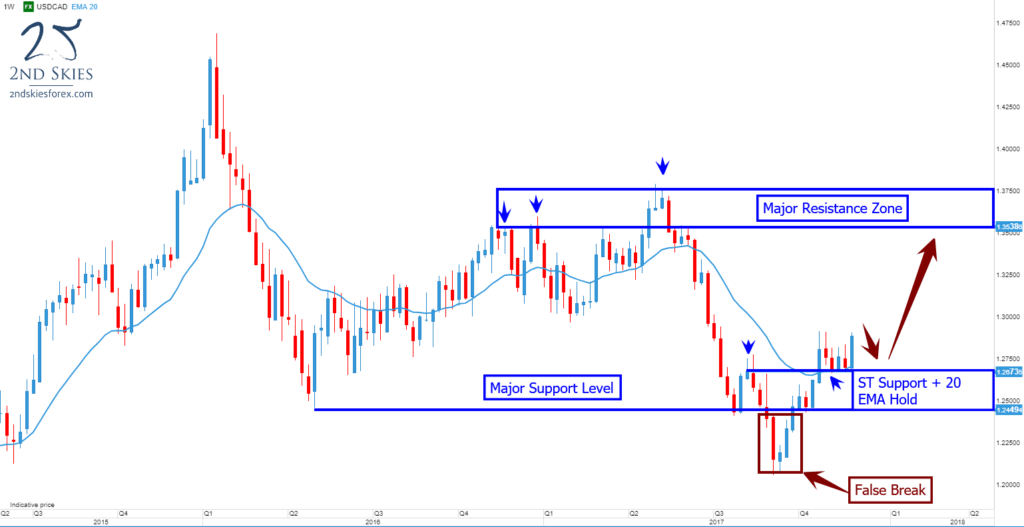
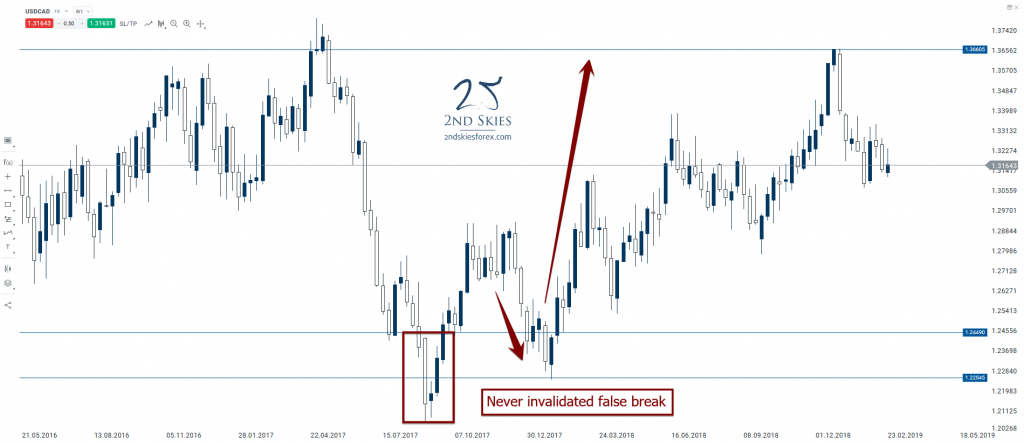
As we mentioned in our trade ideas, we felt like the false break provided us with a bullish trade signal and that prices should go higher targeting 1.35 and perhaps 1.37+

Here is the chart at the time of the trade recommendation.

usdcad-trade-ideas-and-price-action-context-2ndskiesforex

And here is the chart after.

usdcad-trade-ideas-2ndskiesforex

The Verdict: Overall, a win. The false break structure was never violated.

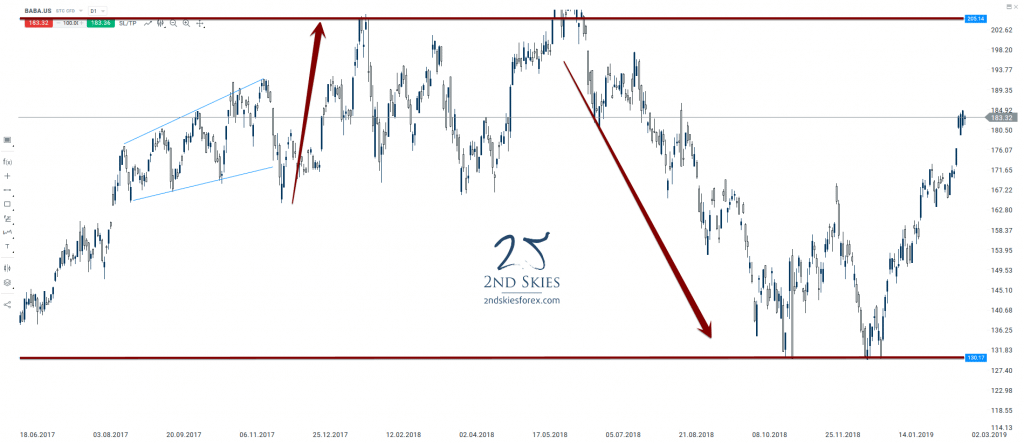
2018 Trade Idea #3: Alibaba Is Going to $300

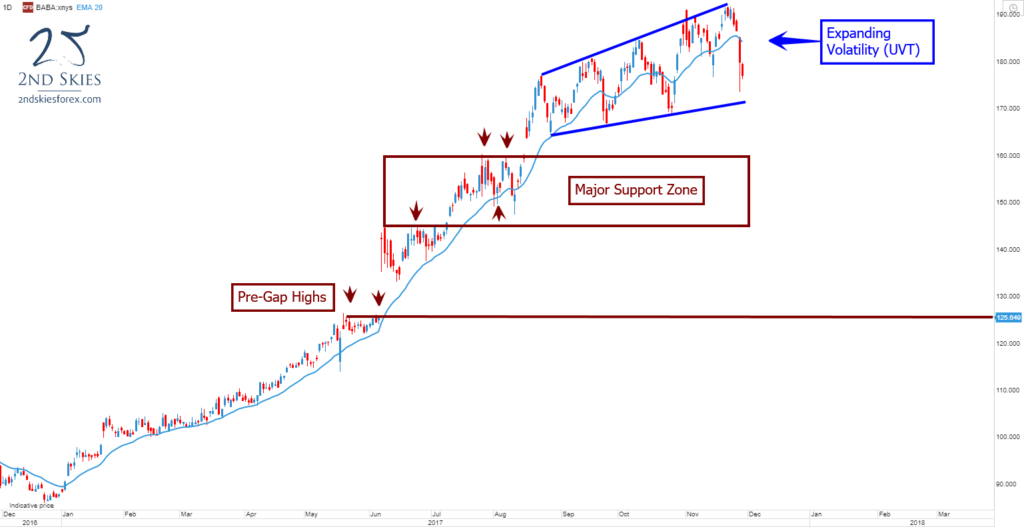
At the time of the post last year, I felt like the increasing volatility was suggesting an unclean volatile trend, but that overall prices should go higher towards $300.

Here is the chart I had from last year.

alibaba-trade-ideas-and-price-action-context-2ndskiesforex

And here is the chart after.

alibaba-trade-idea-2ndskiesforex

The Verdict: Definitely a loss. I was clearly wrong on this one.

Now that we’ve gone through the 2018 trade ideas, let’s move onto 2019.

Top Trade Ideas for 2019

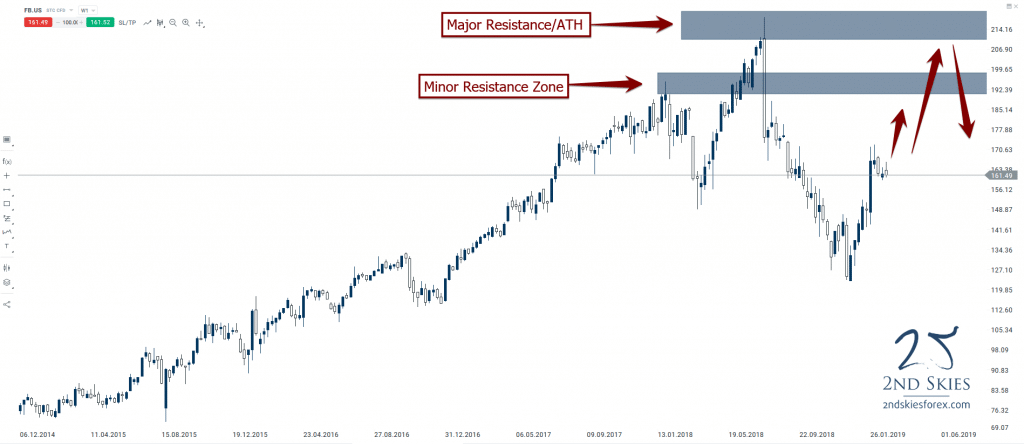
#1 Facebook Has Peaked, Looking to Sell

A lot has happened for big tech this last year. While Amazon is coming under greater scrutiny, along with Google, Facebook has been the bad apple causing the biggest problems for big tech.

Scandal after scandal has come out, and IMO it’s really starting to weigh on investor sentiment, employee morale, and long term prospects for the company. I recently had a conversation with my friends daughter who is in High School. We talked about FB, and she flat out said, “Most people my age don’t really use FB that much anymore, and it’s not that popular“. So the newest generation of people are becoming less and less interested in FB. That is telling sign IMO.

When I look at the charts, I see a stock that had very little resistance or selling from 2013 (around $25 a share) to $212 a share. And then shit started to get real.

facebook-price-action-trade-ideas-2ndskiesforex

After spiking north of $212 to $218, Facebook had had its largest one week drop on record closing at $175. That one week of selling took out the prior 12 weeks of gains, and we haven’t seen $200 since. It sold off for 2 out of every 3 weeks right around the time the Cambridge Analytica scandal broke. It’s low last year was around $123, which is a whopping 43% drop in a matter of 5 mos. This peak to trough movement took out all the gains from 2018, 17′ and most of 16′.

The stock (like most indices) has rebounded well this year, but remember, when making all time highs year after year, there’s very little resistance on the way up. The 2nd time around, there will be resistance and sellers waiting.

Turning to the price action, and considering the above, I want to be selling on rallies. The earliest (and most aggressive) location I’ll consider selling, perhaps a small position, will be between 183 and 193 which is the first major resistance zone marked on the chart.

The second key resistance zone is notable the all time highs between 210 and 218. Downside I wouldn’t be surprised to see 150 and then 122 revisited. If more scandals break, and other big fines are levied on the Zuckerberg darling, we could be witnessing the peak of FB.

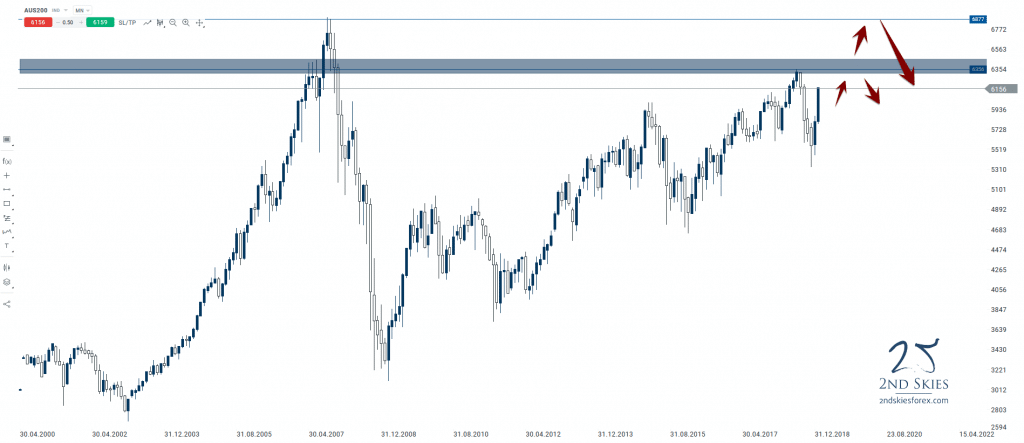
#2 ASX 200 – Approaching Major Resistance & ATH

Since the 2007 peak of 6877, along with the subsequent sell-off, the ASX 200 has never breached the 07′ peak, nor visited it once. However since 2008, the major Australian index has been climbing steadily, gaining virtually 2 out of every 3 months with a continuous building of higher lows and higher highs.

The index however is approaching some major resistance coming up with the 2018 peak ~6356, and then the 07′ peak of 6877.

asx-200-trade-setup-2ndskiesforex

It’s hard to imagine a scenario where it just blasts through either the first, or second zone without finding some sellers, and thus presenting a short opportunity.

If the first zone on the chart fails, then I’ll definitely be looking to sell near the 6877 peak, targeting first the zone below it, and potentially a larger sell-off towards 5400, possibly sub 5000.

We’re getting into rarified air here, so hard not to look for a short opportunity. ST the index looks bullish and is posting a strong start to the year. But offers are likely parked above where I suspect we’ll see a real challenge to this ST bull run.

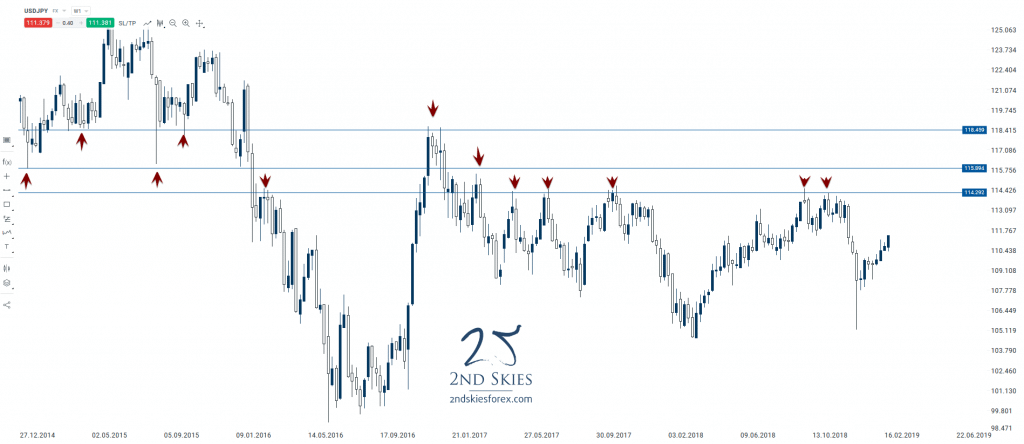
#3 USDJPY – Range Structures + Resistance Ahead

Since Feb 2016, the USDJPY has not had a weekly close above 118.45, and nothing above 115.90 since late 2016. 114.29, which is a major resistance level above has been tagged about 5-6x over the last 3 years, all resulting in 600+ pip rejections.

usdjpy-2019-trade-idea-2ndskiesforex

IMO, one of these levels is likely to present a solid level of resistance, and keep the range structures intact.

Hence I’m looking to sell, either at 114.29, 115.89. or 118.45. Shoot, I might even sell at all 3 levels, but my suspicion is one of these levels will hold, and present a great selling opportunity.

For the downside, I’ll be looking to target the bottom of the range structure which comes in initially near 108.75, then 105.

******
For our course members last year, we did a total of 10 top trade ideas for 2018. We’ll be doing the same for our members over the weekend in a video which I’ll post in the coming days.

Until then, I hope you enjoyed these trade ideas, and that you have a great end to your trading week and month for February.