Tag Archive for: price action

By now we have fully entered the summer trading months which are traditionally slower to begin with. When you combine the summer + the lack of ‘flow information‘ shared by bank traders under investigation, you have an environment of lesser volatility, smaller moves, and more false break setups.

With that being said, how can we maximize our time, while still remaining active and consistently profiting? Below is a mini how-to-guide for summer forex currency trading.

In this article, I will share 2 simple tips to help you trade pairs with stable volatility, larger moves, and also remain active during the slower summer months.

Summer Forex Currency Trading Tip #1: Switching Pairs & Instruments
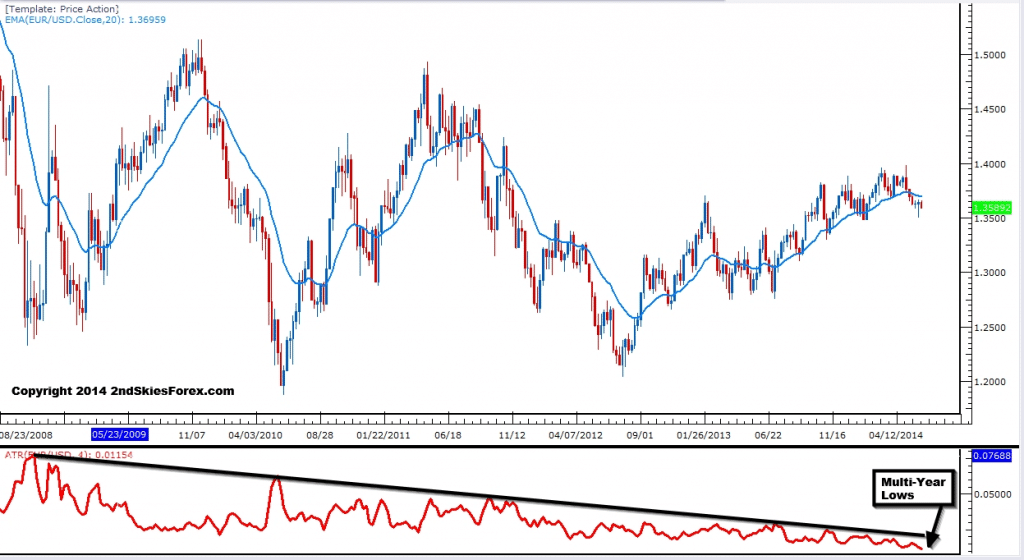
Below is the weekly chart for the EURUSD, the most heavily traded pair on the planet. Do you see that red line under the price action part of the chart? That is the weekly ATR which measures the average trading range (in pips) per week.

eurusd atr weekly chart

The average range of the pair on a week to week basis has been declining for years with it currently being at an all time low. It is the same for most majors, including the USDJPY and GBPUSD. If you are expecting a few hundred pip move on any of the above pairs, you could be sitting on your hand for days which is not the best use of your time. So what can you do about this?

My suggestion is to switch pairs that are more volatile. For example, instead of trading the GBPUSD or the AUDUSD, why not switch to the GBPAUD? It is far more volatile due to the ‘weighting‘ of the pair. If you can learn to spot good moves on the AUDUSD, then it will usually correspond to a directionally opposite move in the GBPAUD.

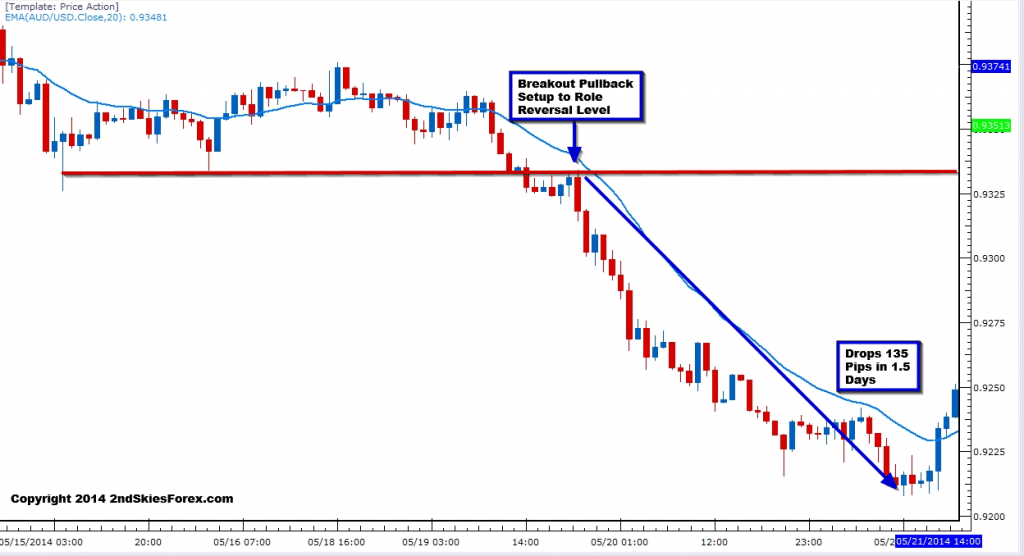
Take a look at the two charts below to get a better idea of this concept. In the first chart, we are looking at the AUDUSD 1hr intra-day chart. You’ll see the pair selling off heavy in the middle of the chart after a breakout pullback setup around 9330.

audusd 1hr chart breakout pullback setup

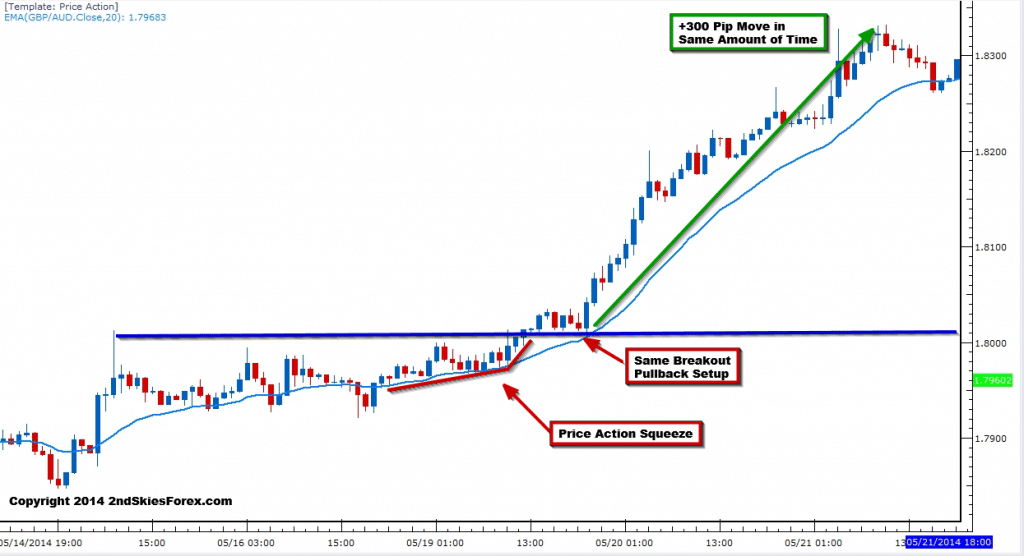
The trade happened in the Tokyo session, and took about 1.5 days to drop 135 pips. Now take a look at the chart below of the GBPAUD at that same time and notice the pattern.

gbpaud breakout pullback setup 2ndskiesforex

As you can see. the GBPAUD also make a breakout pullback setup off the role reversal level, yet it runs for +300 pips (a larger move by 2.2x). The size of each stop would have been relatively similar, which would have led to more profit on the second trade, and money in your account. Even an every day 40-50 pip directional move in the AUDUSD can lead to a +120 pip move in the GBPAUD.

Thus start looking at pairs which are naturally more volatile, and will be less affected by the lack of ‘flow information‘ shared by bank traders who are currently less active.

An additional suggestion would be to add other instruments, such as global indices and commodities. The Asian indices such as the Nikkei 225 and Hang Seng tend to have consistent volatility.

Along those lines, recently spent time with an HFT trader at IMC (Chicago). He mentioned how IMC is quite active in trading the Asian indices because of the higher volatility. Gold and WTI Crude Oil will also offer some greater volatility. Same with the German Dax and FTSE 100, so consider expanding your instruments giving you multiple options to trade.

Summer Forex Currency Trading Tip #2: Spend More Time Training
Since you are naturally less active during the summer months, why not use that time to build your trading skill set? Forget the idea of walking away when there is no trades to play golf, watch a movie, or read a book.

You want to be a professional trader who has the freedom of working from home, not having a boss who tells you what to do, what to wear and how much you get paid.

Do you get better at golf by sitting on the beach? Do you get better at playing guitar by reading novels? Do you get better at martial arts by playing video games? No, so why in the world do you think this applies to trading? It doesn’t, hence take advantage of the time available.

For those not familiar with it, Forex Tester 2 is a fantastic live simulation platform. You can take virtually any pair, and load up 13+ years of data on any time frame, then live forward trade it as if the price action was forming in real time.

I did a great video on forex training with Forex Tester 2 which shares several ideas how to accelerate your learning curve. This is especially relevant for those trading daily and 4hr strategies.

Ask yourself how long would it take you to log 500 trades if you only trade the higher time frames? Years perhaps? In less than a week, you can log the same amount of trades in FT2.

Think of it being the equivalent training of the golfer at the driving range, hitting ball after ball. Professional golfers on average will hit 500 balls a day. Do you think that helps their golf game and perfect their swing? Ponder that a moment for those of you only trading 3-5x a month, and how long it will take you to build your skill set.

I’ve had several students log thousands of trades after a few months using FT2. Go figure their trading is improving the most, and showing the greatest profits over the last few months.

NOTE: In the link I shared above to the video on FT2, there is a link where you can get a $50 discount on it.

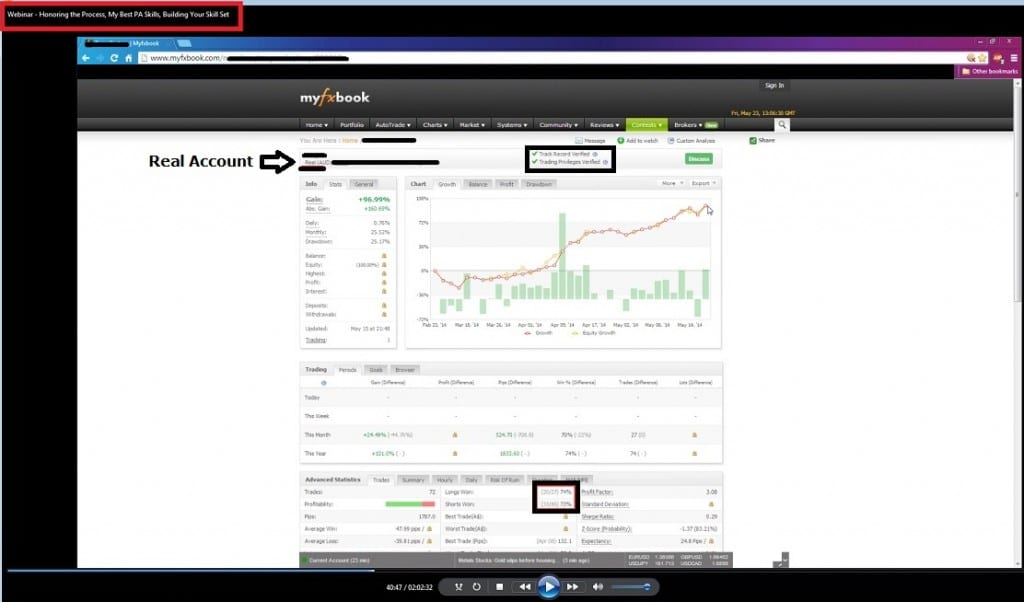
Along the lines of using FT2 to improve your trading performance, I recently did a private member webinar, where we showed a myfxbook account from one of our students. He is trading over 70% accuracy, and up about +96% on his live trading account, with his average wins well out-sizing their average losses. He profit factor is currently +3.08 and is up +1780 pips for the last 4 months.

Below is a screenshot from their myfxbook page we discussed in the webinar.

2ndskiesforex student profit live myfxbook account using price action

They trained over and over again in FT2 and are a member of my price action course.

While others are being lazy traders, they are building their skill set. If anyone is going to really trade for a living, it will be the ones who put in the hours and properly train.

In Summary
These are just a few tips you can use to help stay consistently profitable trading forex in the summer, while using the time effectively to build your trading skill set.

There are many more tips which I share with my course members, along with more ways to utilize Forex Tester 2, building a successful trading mindset, how to train properly, along with adjusting to the ever evolving markets in real time.

Without a doubt, the learning process to successful trading is not a short one. It is one that takes time, akin to virtually all other skill based endeavors. Be it sports, playing a musical instruments, or martial arts.

Although we want to become black belt traders, or virtuoso readers of price action in a jiffy, in 99% of the cases, your time line from here to success will likely not be as quick as you’d prefer.
Because of the extended time on our journey from A to B, it is common as bikes in Amsterdam for us to lose perspective, and go off the rails.
Putting Things In Perspective
Take a look at the graph below. What you are seeing is a snapshot of an equity curve from one of the strategies in my price action course.
snapshot equity curve 1
Upon first glance, it looks incredibly unimpressive…that it loses money. And you would be correct in this assumption…for this period of time.
Now take a look at the second image below, which is the entire equity curve over several years.
price action strategy equity curve 2ndskiesforex complete
What you are now seeing is something totally different.
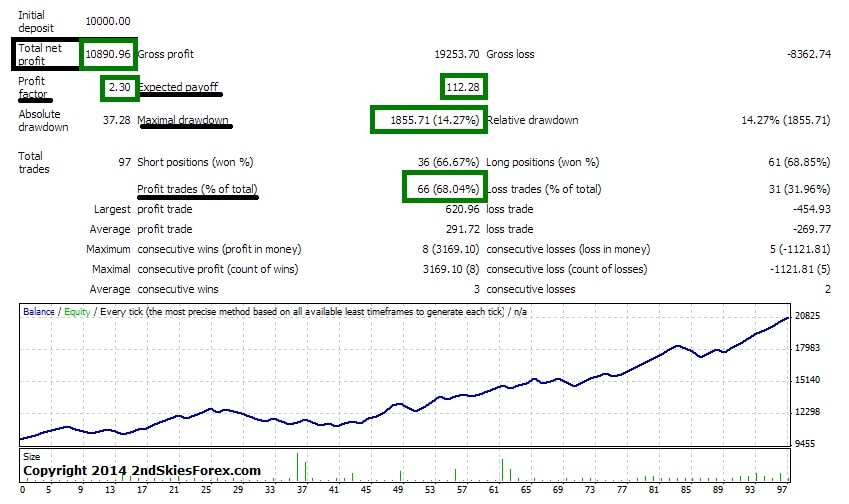
When you look at its entirety, you are seeing is a price action strategy that made 108% return! This is across only one ONE PAIR, and only ONE TIME FRAME.
Some highlights of the performance are below:
+108.9% profit
Profit Factor of 2.3
Expected Payoff of 112.28
Maximal Drawdown of 14.27%
% Profitable Trades 68.04%
Greatest Win 36% Larger Than Greatest Loss
Max Consecutive Profit Almost 200% Greater than Max Consecutive Loss

Without a doubt, this is a strategy that makes money, consistently, preserves capital, with a balanced risk to reward ratio.

Below is the table from the performance test, showing you the same performance.
total performance profitable strategy 2ndskiesforex price action

Most Un-Successful Traders Make This Mistake
For those who are not trading profitably, most likely when you are in a draw down, you don’t give the strategy enough time to work itself out. You see the equity curve falling, and think something has to be changed.

In reality, there could be nothing wrong with the strategy. Maybe this particular strategy won’t perform well in that market, yet this price action strategy makes money over time.

Now imagine if you changed strategies at the end of the first graph. You would have missed out on over 85% of the entire profit that strategy made. You would have lost several years of consistently profitable trading. That alone would have put you in top 5% of all traders. Food 4 thought.

Building A Healthy Perspective
Generally developing traders are more hyper-sensitive to every single trade, each win and loss. But look at this from a different perspective:

Imagine being a new archer having this same approach – that you gauge your confidence based on each shot.

That map would be all over the place, and drive a person batty as to how they are doing, because naturally one will be an inconsistent shooter in the beginning.

Instead, look to a great basketball player, and tell me if their confidence wanes from missing one free throw. They don’t make this mistake. They keep the right perspective and mindset by focusing on the process, not result. They keep the right perspective.

Constantly Changing
Changing strategies every month or so will take you in circles (like the dog that chases its tail).

dog chasing its tail
Quarterbacks don’t change throwing motions every month, nor do musicians change instruments every time things go bad. Why would you think the path to successful trading would be any different?
So avoid changing your trading plan and strategy every month. Stick to the one you got for at least 90 days, once you’ve refined it. Commit to learning/trading it inside and out.
By doing this, you are (at the very least) building a skill set towards successful trading. Even if the strategy does not work out, you are developing one of the most important qualities in trading – discipline.
And with discipline comes confidence, which is something most un-successful traders lack. Remember, the draw down of the first chart was the prelude to a 108% return, (doubling your account in a few years).
Ask yourself if you have done this (changed strategies after a small losing period). Ask yourself if you’ve focused on result more than process. Then see how you can change this to keep the right perspective when trading.

Key Talking Points:

  • False Breaks Offer Great Price Action Trading Setups
  • You Can Trade the False Break Strategy with Pin Bars and Engulfing Bars
  • Look for False Break Setups Trading With the Trend

Ever tried to enter on a forex false breakout breakout setup, only to have the trade immediately reverse on you? I’m guessing this has happened to you many times (present trader included).
With the market volatility declining over the last several years, false breaks can and will happen all the time. The key to avoid getting stopped out, and actually profit from these false break setups, is to understand the price action context which often precedes them.
In this two part article series, I will begin today’s discussion by defining a false break. Next, I’ll go over a common false break setup, which is trading the false break with trend. Then I will go over a fundamental false breakout strategy, and conclude by recapping the key points.
What is A False Break?
I would prefer to define a false break as one of the following two scenarios: 

  1. A break above/below a prior candle that fails to close above/below that candle
  2. A break above/below a key level, quickly reversing that level, and sparking a counter-trend move

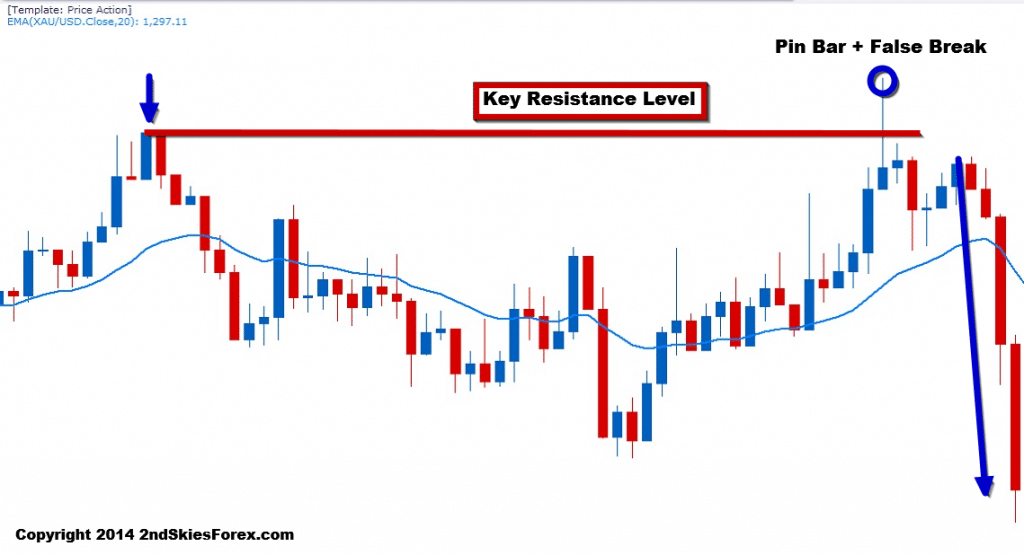
Below is an example of the first type with a pin bar + false break:
trading the false break strategy 2ndskiesforex c1
In the chart above, you can see the arrow to the top left, showing a bullish move running into resistance. The pair then settles back, and makes a second attempt to take out this key level.
But on the top right, you can see it forms a pin bar + false break.
From an Order Flow Perspective
Looking at this from an order flow perspective, the bulls were in control leading up to the level, and were able to push past it. Either there was massive profit taking on their part, or they ran into heavy sellers a few layers deep behind the level.
Regardless, the sellers over-whelmed the buyers, and pushed the pair back below the key resistance level. After a second attempt to regain the level, the sellers realizing they had control, sold even more, pushing the pair down impulsively.
Trapping Traders
In most false breaks, there are ‘trapped traders‘, meaning traders who are caught long when the pair is about to go short, or vice versa. Those trapped traders once the trade goes negative, will likely be stopped out, & further fuel the counter-trend move.
The more savvy traders will exit manually when they realize they are trapped, while the slower traders will likely get hit for the full stop. There are price action clues to tell when you’ve been trapped, but that is for another article.
Trading The False Break Setup With Trend
It should not be surprising, one of the best false break setups occur when trading with the trend. This is because the underlying order flow is heavily imbalanced, meaning it’s heavily bullish or bearish.
When a false break setup forms counter-trend, it usually runs into buyers or sellers who are happy to take the pullback getting a better price. Their overall strength in the market makes it harder for counter-trend false breaks to be maintained.
This is why false breaks present such great trade opportunities.
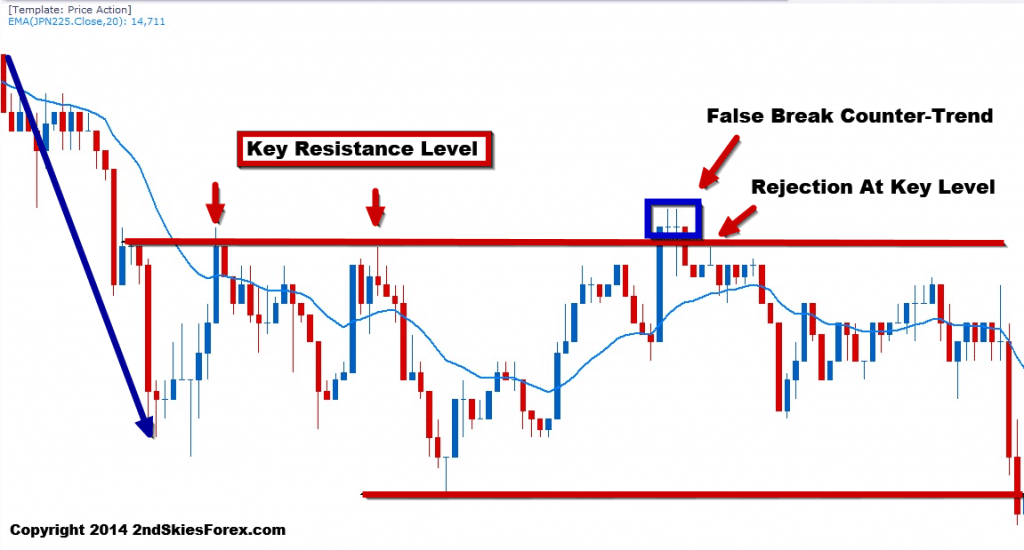
Below is a classic example of trading the false break setup with trend:
trading the false break strategy 2ndskiesforex c3
In the chart above, starting with the top left, we can see the heavy impulsive selling. Eventually this leads to a bounce which hits the key resistance level 2x (marked by two red arrows). After forming a new low (red line at bottom), the pair bounces to retest the bears at the same resistance level.
Now note how the pair breaks above this level with a really large blue bar, closing at the highs. Ask yourself, if the bulls were really in control, how come they did not produce any follow through?
The next two doji candles showed no real strength or follow up buying, which should have been a warning sign to any bulls already long. Bears wanting to trade with trend, should have been looking for the false break and close below which they got on the 3rd candle.
Entry, Stop & Take Profit
With such a clearly defined trend and resistance level, there are two general entry techniques;

  1. Sell on Break back below the key level
  2. Wait for pullback setup to the key level

More aggressive traders who feel confident in their price action skills may sell on the break back below the key level. This may or may not offer the best price, but you may not get a second chance to enter if the sellers came in hard on the false break.
More conservative traders can wait for a pullback setup to the key level. If the false break is real along with the level, then the trade should hold and not go much into the negative.
I generally recommend placing the stop above the high (or below the low) of the false break by a few pips, depending upon the volatility and liquidity of the instrument.
The first target should be the other end of the consolidation. If you want to go for multiple targets, then the next key support or resistance level would be suggested.
To Recap
In today’s forex false breakout article, I talked about the price action and order flow behind a false break setup, and why it can be a powerful trade opportunity. I discussed the two types of false breaks and how to generally define one.
Lastly, I covered why to look for with trend setups trading the false break, giving the entry, stop and take profit methods.
When you learn to read price action in real time, you will begin to spot these false break setups more easily. As you get skilled in identifying them, you will avoid the common traps, and profit heavily from them as they offer great opportunities.
In the second part of this article, I will talk about using a false breakout strategy with pin bars and engulfing bars.

One of the greatest ‘myths‘ out there (or mis-information) is price action on the lower time frames (below 1hr charts) is just ‘noise‘. This is a highly confused notion of price action trading and nothing could be further from the truth.
Prop traders are often trading below the 1hr time frames every day, oftentimes on the 1m, 3m or 5m charts. Bank traders will often be highly active, also trading on the lower TFs. They do this while also building up large swing positions they hold for weeks, perhaps months to trade with the trend. Same goes for desk traders and institutional ones alike.

The bottom line is, professional traders are trading off all time frames. There is no ‘holy grail’ of time frames. There is no bastion of good signals that only exist on the higher TFs (daily and 4hr charts) while anything below the 1hr chart is just ‘noise’ or garbage. High quality signals exist on all time frames, and traders are making money on virtually every time frame you can imagine. The ‘noise’ idea you’ve been told is a myth.lower time frame noise myth busted chris capre 2ndskiesforex
Sorry to kill the sacred cow – but those espousing the freshman idea only good signals exist on the daily/4hr charts clearly do not understand price action.

The idea of noise existing on a particular time frame comes down to the lack of one thing – training. I will use an analogy to demonstrate this point.
Foreign Tongues & Cryptography
If I am walking down a street in my home country, I will understand what people are saying. Why? Because I speak the language. I have been trained to.
Now put me on a busy street in Finland or Mongolia, and I will have no idea what they are saying. Their conversations will sound like noise to me. In fact almost any language that is unrecognizable to me will sound like ‘noise’.
Why? Training.
But give me six months to a year learning that language, and what before sounded like ‘noise’, will now sound like a conversation. It will have information, meaning and a familiarity to it. I will be able to understand and recognize what they are saying. The only difference between the two scenarios, is training.
Same goes for cryptographers (those who translate coded communications). What may sound like noise to me and you, is actually a hidden message or code for them. Again – the only difference between us and them is training.
cryptography training intra-day time frames 2ndskiesforex
It Comes Down To This
If you have been only trading the higher TFs, then for a little bit, the lower TFs will look like ‘noise’ to you. You will not understand the differences, the rhythms, and how the information is expressed a little differently. But through training, practice and experience, you will start to understand the code.
What you will find are great intra-day signals, key levels, and how the intra-day price action flows. You will spot opportunities and see patterns. With a little effort, practice and training, the ‘noise’ of those time frames will start to become clear and trades will start to pop out to you. With proper training comes an improved trading mindset.
That is not to say you should or have to. I always recommend finding what is most natural to you, your availability, and inclinations. That could be only on lower TFs, higher ones, or a mix of both. Everyone will have a sweet-spot. It is up to you to find that.
To be clear, I am not saying this comes easily, but nothing in trading ever does. It takes patience, work, practice and training, but it certainly can be done.
Hence do not believe the confused freshman ideas there are boogeymen down there. I have many students trading the intra-day charts successfully several times a day while maintaining accuracy and profitability. There is no reason why you cannot do the same.

Did you know you could have a 50% accuracy ratio for your trading, always have a 2R profit target, and still lose money? Its true, (although its a low probability), but remains true nonetheless. How? Because of two key factors: % account risked and your risk of ruin ratio. At a bare minimum, you have to understand 4 things about your trading to know mathematically if you will make money.

What are those 4 things? That is what this forex money management plan article is going to cover in detail. I will begin by discussing what these 4 things are, and how not knowing them will hurt your account. Then I will describe the risk of ruin formula and why its essential for your trading performance. I will end by sharing a forex money management secret that will impact how you think about money management and risk.

risk and money management 2ndskiesforex

The 4 Things You Need To Know
Any article discussing forex money management plans and performance without discussing risk of ruin is incomplete at best and detrimental to your account at worst

Why?

Because at a bare minimum, you need to know 4 things about your trading to know if you will make money or not. They are the following;

1) Risk to Reward Ratio
2) Accuracy
3) % Risked Per Trade
4) Your Risk of Ruin

Simply put, you could be trading a 1:2 reward to risk ratio, and still lose money. You could know #1 along with your accuracy, and still lose money. You could know your % risked per trade and still lose money. But if you know those three + #4, you can mathematically know whether you will make or lose money.

How?

The Risk of Ruin Formula

What is the Risk of Ruin formula, how does it apply to my trading performance?
The risk of ruin formula is designed to communicate statistically if you will make or lose money trading. You can mathematically know for a fact if you will make, or lose money by knowing your risk of ruin. But you cannot calculate the risk of ruin formula without three key pieces of data. They are:

1) Risk to Reward Ratio
2) Accuracy
3) % Risked Per Trade

Combined together, these above will give you your risk of ruin (ROR). The ROR is a number representing the % chance you will ‘ruin’ your account, e.g. blow it up. Not a pleasant thought, but a highly useful piece of data and essential for your success.

What you want is a 0% ROR (risk of ruin) or a 0% chance of blowing up your account. The inverse of this is you mathematically will make money.

Now remember the first thing I said about how a trader with 50% accuracy always having a 2R reward could still lose money? Let me share why via two risk or ruin tables below.

Trader A Risking 10% of Account Equity ROR Table

Win Ratio % Payoff Ratio 2:1 (2R Profit)
Win Ratio 40% 14.2
Win Ratio 45% 3.41
Win Ratio 50% .813
Win Ratio 55% .187
Win Ratio 60% .0401
Win Ratio 65% 0

Looking at the chart above, by risking 10% of your account equity per trade, having a win ratio of 50% and a payoff ratio of 2:1 (2R per trade), you have a .813% chance of ruining your entire account. Although this is a low probability, it is still a possibility. You actually have to be 65% accurate to mathematically ‘know’ you will make money.

Now lets take the same win and payoff ratios (50% / 2R), reduce the risk per trade to 5% of your total equity, and see how the numbers change.

Trader B Risking 5% of Account Equity ROR Table

Win Ratio % Payoff Ratio 2:1 (2R Profit)
Win Ratio 40% 2.03
Win Ratio 45% .116
Win Ratio 50% 0
Win Ratio 55% 0
Win Ratio 60% 0
Win Ratio 65% 0

In this second table, only those with a 40-45% accuracy have a mathematical chance of losing money. But those at 50% accuracy have a zero % chance of losing money, thus mathematically will make money. What is the key difference? The % risked per trade. This is why it is absolutely critical to your money management strategy to use a % equity risk model, not a meaningless ‘dollar risked per trade’.

Also notice how risking 5% per trade instead of 10% drastically changed the accuracy levels needed to make money? Trader A needed a 65% accuracy level to be certain they could make money, while Trader B only needed a 50% accuracy level – a 10% difference!

It should also communicate an essential point;
Any forex money management strategy article or website talking about trading without mentioning the above, is giving you totally incomplete information about money management which could kill your account. In essence, you could be trading blind to the numbers which hugely determine your success or failure in trading.

A critical piece of information? Absolutely. Something you’d want to know? I’d certainly hope so.

trading insight 2ndskiesforex

One Last Point (A Secret About Money Management)
There is one thing almost never talked about when discussing trading money management strategies. It is a huge point why working with a % equity model is far superior to ‘dollar risked per trade’. And it has to do with your mind.

If you are setting the risk per trade based on a ‘dollar value’, that dollar value actually means more to your mind (and thus emotions) than an ‘neutral’ % of your account. Why? Because you spend money in terms of dollars (or euros, or whatever your local currency is), not %’s of your account.

So if you are making a trade, and thinking ‘Oh, I’m going to risk $5,000 on this trade‘, that very thought of ‘$5,000’ can (and most likely will) conjure up a host thoughts about rent, bills, car payments, or a wave of other things.

These thoughts are far more likely to engage any fears you have about the ‘dollars you are risking per trade‘ than a neutral 1 or 2% which has ‘no reference‘ to how much you spend, may need, or what it could buy.  In essence, there is no ‘trigger‘ in your mind about % risked per trade, but there certainly is about the ‘dollars risked per trade.’

By shifting your trading money management strategy and trading mindset towards a % equity model, your mind will be more focused on the actual trade. This is opposed to dealing with the thoughts ‘Oh, that $5,000 is a lot of money to me. I’m about to risk $5,000 which could pay for my rent, my mortgage, or my debts‘.

This mind trick actually helps to reduce the emotional triggers when trading, thus leaving your cognitive mind less burdened with thoughts of the money, and more focused on the trade. This is a huge reason why a % equity model is far superior from a trading mindset perspective than a ‘dollar risked per trade’ model.  Food for thought, but I hope this clarifies the huge advantages and information available when thinking about forex money management in terms of a % equity of your account.

Here is a sneak peak from a video lesson in our price action course. The third topic of the lesson had to do with liquidity, price action and how that affects trading. We discussed how knowing the liquidity of an instrument is crucial to understanding how to trade it and how it will affect the price action, along with your stops and take profits.

sneak peak price action course 2ndskiesforex

Video of a live price action trade I recently took on the NZDUSD using intraday price action trading analysis on the 5m chart.

live price action breakout trading nzdusd chris capre 2ndskiesforex

Recently I got a question from a newer student asking the following;
“Right now I’m short this pair. It’s in profit, but it just formed a pin bar against my trade before I hit my profit target. What should I do?”
This is a common question I get about what to do when you see a price action signal that is counter to your trade. The question by itself actually tells me a lot about the student and where they are at in their process (beginning, middle or more advanced).
My response was similar to the following;
“It is important to understand we are not pattern traders. We are price action traders. Being a pattern trader, as in trading pin bars, inside bars, engulfing bars, or fakey’s does not make us a price action trader.
Pin bars are not the death of trends. I can come up with about 50,000 examples of trends both intraday, or on the 4hr and daily time frames whereby the trends ran into a pin bar at a key level, then smashed right through it. I can also come up with thousands where they did the same and reversed.
‘Wait, but those were counter-trend pin bars, what about with trend pin bars?’ 
Same thing, I can come up with 50,000 of those that were with trend, and the market reversed the prevailing trend. I can also find you thousands that were with trend and worked out.
So what was the difference between the ones that did work out and ones that didn’t?
The key was the price action context around the pin bar. How the price action was leading up to the pin bar, and around it (the context of how the pin bar formed) is what will make that signals useful or not.”
This is why it is such a freshman idea and a complete fallacy to think all you need to trade successfully is 3 simple patterns (pin bars, engulfing bars, inside bars). All that + trading with trend at key levels and VOILA! You have your A+ setup and a profitable price action trade.
If it were only that simple (FYI – if it were, a lot more people would be profitable).
So how do you deal with a counter trend signal to your trade?
The answer is in reading the price action context around it. I will share four charts below to demonstrate the point clearly.
Exhibit A
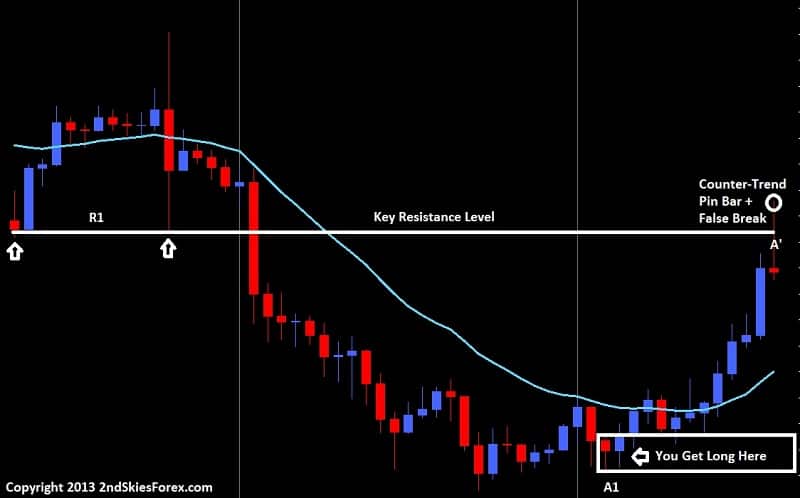
Looking at the chart below, we can see towards the left a double touch off the level R1, then a break through it with a large breakout bar. The market falls heavily and you look to get long around A1 on the bottom right of the chart. Your trade is working out great, but you run into a pin bar + false break (A1) at the key resistance level R1.
price action counter trend trade pin bar key level 2ndskiestrading.com
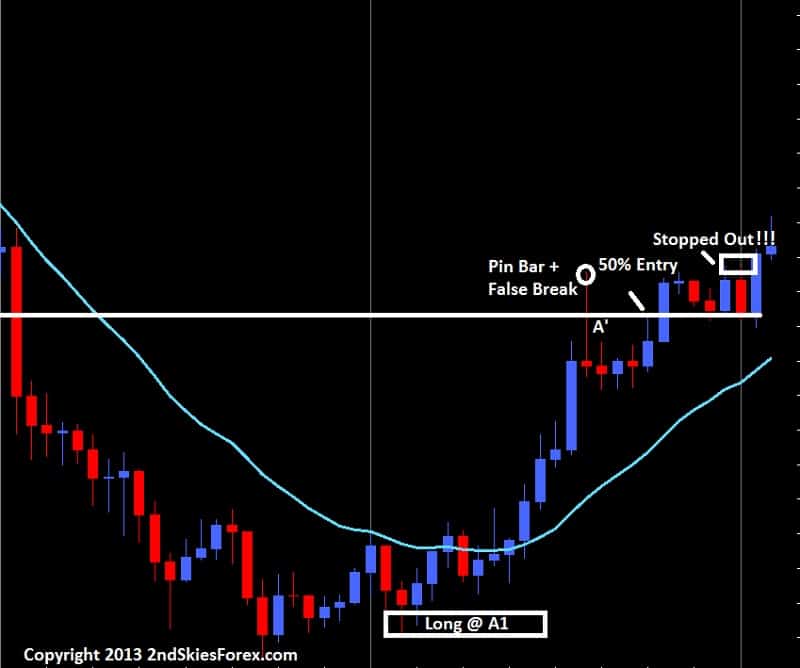
Minions of the 50% retrace entry on the pin bar are salivating because they think this is a great chance to short as you have a pin bar + false break at a key level, and the 50% retrace is at the level.
Meanwhile, you being long back at A1 see this pin bar and are worried about the market reversing thinking the move is over, so you exit.
Turns out both of you were wrong (see chart below)
pin bar 50 percent retrace entry failed price action context 2ndskiestrading.com
Exhibit B (later on in the same chart)
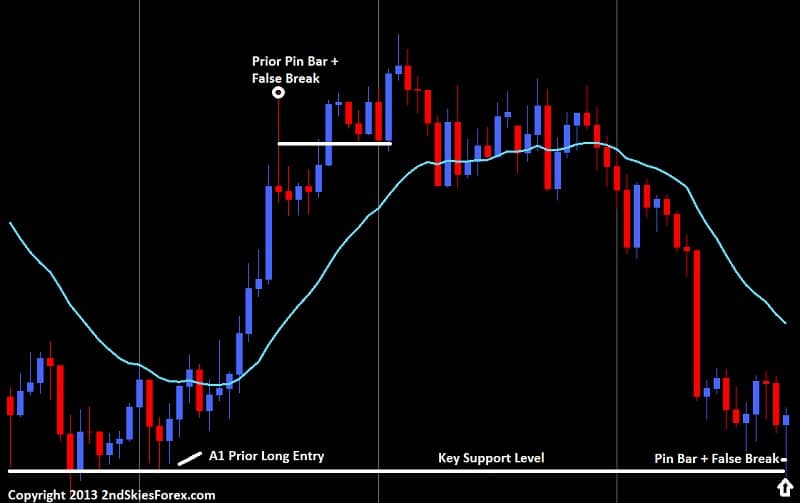
In this next chart below which is only a couple days later on the same pair, price eventually falls back to the same key level where we bought at A1 prior. It forms a consolidation just above it, then a pin bar + false break.
pin bar false break price action context 2ndskiestrading.com
Great! Time to get in on the 50% retrace entry yes as its at a key level. Or, the other option touted is to get long on a break of the pin bar high yes? Either way, this is an A+ setup right since the pair is in a range and formed a pin bar at a key level right?
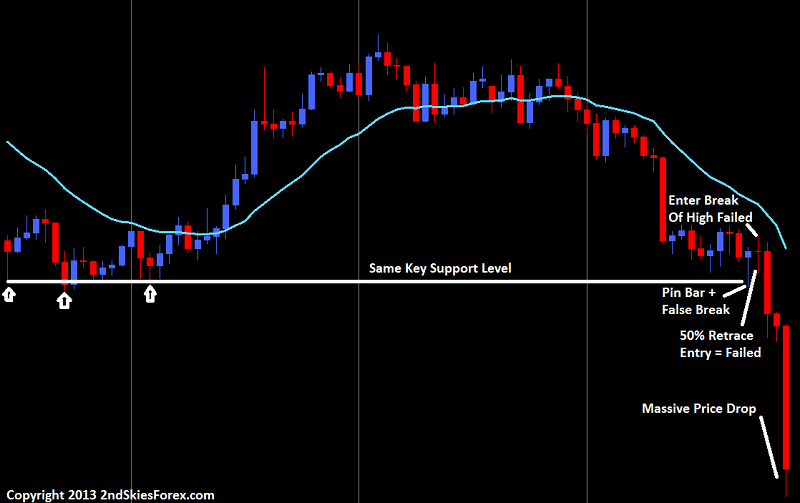
See the next chart below
price action context pin bar entry fails 2ndskiestrading.com
Turns out both pin bar entries failed, even though it was at a key level while price action was in a range. Now imagine you were long around the top of this chart, and ran into this counter-trend pin bar signal at a key level. You probably would have taken profit.
But by not understanding the price action context around the level, you would have missed out on a ton of profit, almost double your profit leading up to that pin bar.
This is why its important to graduate beyond the freshman concepts of trading pin bars, inside bars, engulfing bars, fakey’s, or whatever price action patterns. If trading were that easy, as in trading with the trend + key levels + price action signal = profitable trading, then a lot more people would be making money.
The difference between knowing when to take those signals is in learning to read the context and order flow behind the price action. Pin bars are not the death of trends. Nor are the other patterns. In isolation, or even with trend analysis + key level analysis does not make it a good trade.
Thus my answer to this students question about what to do when you see a counter trend price action signal to your trade – my response is to understand the order flow and price action context around that signal. When you begin to do this, your trading will start to turn. You will find yourself winning more trades, and holding onto trades longer. And while others are buying this last pin bar – you are selling it, and you’ll understand why.

I recently had a really good Q&A session with a student in my price action course, who had asked a really important question. He was having a hard time discerning when to follow the rules to develop consistency in their forex trading, while having flexibility to ‘adjust‘ the rules in the right circumstances.

This is an absolutely fantastic question, and an important one for sure. Thus, I decided to write a two-part article on this subject, discussing the differences, advantages and disadvantages of rule based systems vs. discretionary systems.

In today’s article, I will introduce the student’s question, then share my response, what I see and why, along with a few added comments. In the companion article, I will talk about which of the two systems above I prefer, why I teach them, what are the advantages, and how you can develop them for your trading.


Steve’s Question (my student):

I see a conflict between striving to gain the consistency to follow the rules but then having the flexibility to know when to break the rules. If we are talking about consistency and always following rules then I am all for that but my, admittedly limited (2 year), experience tells me that the markets are unforgiving of mechanical systems, as what works during this 6 month period might not work in the next 6 month period. Or swap out 6 months and replace with an/other time period.


My Response Below:

“This is a really good question, and I’m glad you asked so will share several thoughts on this.

In the beginning – follow the rules. Learn them inside and out and follow them to the tee.

einstein rules 2ndskiestrading.com

Why? Because this discipline forms the base of your training and mindset, which in turn allows you to build neural pathways that are critical to trading. If you do not follow the rules, or any set of rules in the beginning, then the neural pathways which form your base for trading knowledge you draw on, will be haphazard, and lead to inconsistent trading.

The other benefit of following the rules/building this discipline (in the beginning) is that it builds certain qualities (psychological) which will be highly useful for trading throughout your entire career. One example is patience – there will be many times you want to break the rules and trade a setup because something looks interesting to you in the charts.

Guess what? This will always be the case. There will always be other setups outside your rules. But deviating off course to try something on your live account isn’t the best place to find out. That should be done in demo or during simulation practice – not live trading.

During live trading, you should already have a clear set of rules in place which you follow inside and out. If there are no setups according to your rule based trading system, then that is part of the deal – but don’t let your impatience take you away from your discipline.


When Do You Break the Rules?

jimi hendrix forex trading rules 2ndskiestrading.com
As to when to break the rules, this is only done after;

a) You can execute the system according to the rules without any thinking (i.e. automatically) – or on a sub-conscious level without thinking.

and

b) You are trading profitably already. This way if you adjust the rules and start losing money, you have a base to go back to where can resume making money while also trading consistently.

As to point a, we first have to get to the place where we are trading on a sub-conscious level which is only done through repetition. Very much like the archer who will do thousands of shots to make sure their mechanics are the same, we also have to build these neural pathways so we can execute our trades automatically, without thinking or hesitation.

When you get to this stage of trading sub-consciously, you’ve built the foundation of discipline, and have probably done enough trades (min. 100+ per system) to start seeing subtleties in the price action to ‘adjust‘ some of the entry rules a bit.

As to point b, the reason why we wait till we are already trading profitably, is this provides a SL on losing money. What do I mean by this? It is a psychological buffer, so that you always have something you can go back to (which will make money). This protects your mental capital, because you know you have something that already works.

Thus, if you are going to adjust/break the rules, this should be done practicing on demo or sim using your adjusted entries. Just make sure when you ‘adjust‘ your entries, you are still coming up with rules for those adjustments, so you can test the validity of those rules individually. The key is to know the difference between which rules can be adjusted, and which are the core of the system.

In one of my trader forums, I recently asked an important question to the students, ‘How does one trade consistently?‘ There were many interesting responses, some of them close, but none that hit the mark. There really is only one consistent trade strategy, yet it seems to elude most traders.

My guess is most of you have experienced this inconsistency in your trading, moreso in the beginning, but perhaps even still today. Have you ever asked these question to yourself, ‘why are my trading results all over the board?‘, or ‘why can’t I seem to trade consistently?

If you have, you are not alone as most developing traders are not able to trade consistently. This was demonstrated very nicely in an article which explored forex profitability over 8500 accounts.

The key takeaway’s from it are the following 2 points;

  1. Less than half of those who make profit in one quarter (2930) fail to profit in the next
  2. For those who do profit back to back quarters (~15% of the 8500 accounts), about half can do it multiple times

Thus, 1 in 3 traders are able to profit over a 3 month period, less than 1 in 6 can do so in back to back quarters, and less than 1 in 13 can do so consistently.

The underlying point – most traders do not trade consistently. Thus the question has to be asked, why are traders so inconsistent, and what can you do to trade consistently?

Is it the system? Is it the time frame I am using? Is it my money management?

The answer is no, so what is the answer? How can you become one of those 1 in 13? Are they just gifted, or have some special talent you don’t?

Not at all, and this one thing you are missing is something you can completely develop. There is only one way to find it in your trading, but you’ve been looking in all the wrong places, so I’m going to share the answer now.

The only way to trade consistently, is to have consistency in your mind. Having consistency in your thoughts, actions and thinking will bring consistency in your trading. It is the only way.

how to trade forex consistently building consistency in your mind 2ndskiestrading.com
Try trading a new system every week for a month and tell me how your results are. Try using a different risk of ruin profile and tell me how your performance goes.

To have consistency in your trading you need to have it in your trading mindset. This is where it all starts.

This is why we have a trading plan, so we have fixed variables we work with day in-day out. This is why we have rule based systems, for if we change the rules, how would we ever know what is working and what is not?

Thus…
All inconsistency comes from the mind, while all consistency in performance does as well. If you are not focused in the moment, you will have inconsistency in performance, because the mind is on the moving thoughts – not the action you need to do in the moment.

Without a consistent picture in your mind what you need to do, how can you ever duplicate the results of your successful trading?

olympic archer consistent thinking 2ndskiestrading.com
Do you think an Olympic archer has a completely different focus and mindset each time he pulls the bow? Do you think a professional golfer has no routine when hitting a golf ball? Absolutely not. They shoot / hit consistently, because they’ve programmed it into their mind what they need to do, and they just do that.

It is the exact same for trading.

Don’t have consistency in your trading and mindset now? No problem. The mind has neuro-plasticity to it, meaning you can physically build the neural pathways to think and trade consistently.

How do you build these neural pathways to trade forex consistently? There are several shortcuts you can take and do to build these in minutes per day. When you run these exercises and mind programs, you will find greater consistency in your trading then ever before.

I will discuss these shortcuts in an upcoming article, so stay tuned to the site for how to learn these tricks, and build consistency in your trading.