This is our newest price action trading strategy video talking about how to trade ‘forex role reversal levels’ using the breakout pullback setup. We share some advanced price action elements on how to read the order flow and price action, along with what are the unique elements in a good breakout.
Tag Archive for: price action
This lesson is focused on one of the least discussed topics in trading – price action. In this forex price action training video we teach you how to identify a critical component of price action – Impulsive vs. Corrective moves.
I was recently reading some article on a very popular finance site whereby the person was talking about the stock market and today’s 376pt crash.
They were saying how it is not good for buy-and-hold investors, but it is good if you are using a dollar-cost-averaging strategy.
The funny thing is this term is totally misunderstood in context, history and is really used by rookies. You will never see a hedge-fund manager using this term, nor some ultra-high level investor.
When have you ever heard Warren Buffet, George Soros, Mark Faber or any other high roller using this term?
Never.
You know why? Cause its a joke.
The History of Dollar Cost Averaging
The term was first used in Chinese chop shops whereby they tried to goat people on to trading more when the prices were falling heavily. They would use the term ‘dollar-cost average’ trying to get you to buy again even though the price got hammered.
Why would they do that?
Because chop shops like theirs got paid in two ways;
1) by customers trading
2) by taking the other side of the trade
When the market crashes like they did today, people are totally afraid to buy and rightfully so. However, to keep the market busy, supported artificially with the dumb money, and make more money off of trading, people use the term ‘dollar-cost-average‘ like its some brilliant investment idea.  Think of how well a dollar cost averaging strategy worked on Bear Stearns, Lehman Bros. or a host of other companies that failed in 2008 or the dot.com bust.
It is the most rookie, insane and ridiculous idea that after something fell huge, we should buy it again. Why? Because it is cheaper? After a huge day of selling, unless it is sitting at some major support, who will want to buy it?
Dollar Cost Averaging is usually used by salespeople who usually work for a company like Prudential or Vanguard or whomever the company is, whereby, the person who is pushing it is usually selling a prescribed set of products which of course, they benefit from you investing in.
These are not traders in the market who live or die by them. They get a salary and a commission for how many of these products they sell you. Yeah, a dollar-cost-averaging strategy worked for Bank of America (BAC) when it dropped from the mid $40’s to about $4. Oh yeah, it worked again with Citigroup (C) which fell from the mid $20’s to about $3. Great strategy!
Bottom line is whenever you hear the term used by anyone, you know immediately they are just using it without any real understanding of the word, its history or significance. You know immediately they are a rookie and really do not have any clue as to what’s going on in the market.
Maybe this has little use for Forex traders, but you likely are going to run into this word or some investment ‘professional’ who uses this so understanding what it really means and where it comes from will help you in the future steer clear of that person.
In fact, any student of price action witnessing a market where people are saying, ‘dollar-cost-averaging’ would be selling the market and making money why others are buying it and getting killed the next day.
If you liked this forex dollar cost averaging article, make sure to comment below. For another great article on money and trading, make sure to check out Money Management and the Risk of Ruin
Trading Forex is in many aspects the same as trading any other instruments. However, there is one crucial way in which trading Forex is completely different than trading other markets. When you are trading any other instrument, you are trading a single instrument based upon its individual strength or weakness. However, in Forex you are trading two instruments or currencies which have their own individual strengths and weaknesses. Thus, the equation is a little more complex but actually makes it easier to find trading opportunities. Why? Because when we are trading currencies, we simply are looking for the greatest polarity between the strongest and weakest currencies. By trading a strong currency against a weak one, we greatly increase the chances the pair will move in our direction as long as we are buying the strong currency and selling the weak one. If you can analyze the price action and isolate the strong vs. weak performing currencies, then you can find some great price action trading setups. How to Find Strong vs. Weak Currencies? The method is actually quite simple. Since the USD is the most commonly traded currency (either as major or cross) we can see how individual currencies are performing against the greenback. Example #1 EUR vs. AUD If we look at the two charts below, we are seeing the daily charts of the Euro vs. the USD and the AUD vs. the USD. We can see how the EURUSD has been tumbling opening the year at 1.4330 and is currently sitting at 1.2300 shedding over 2000pips. 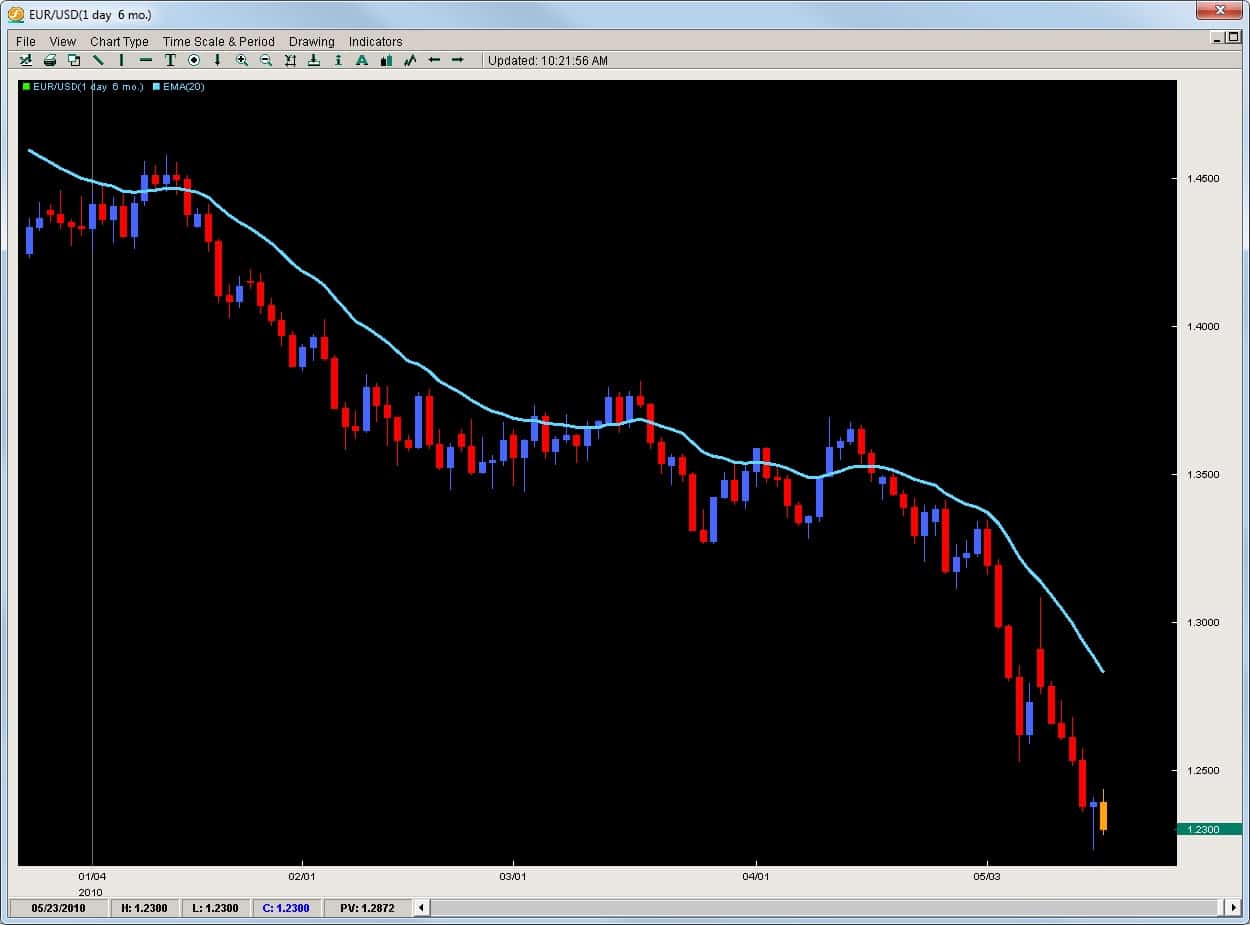 Contrast this with the AUDUSD which opened the year just under .9000 and has ranged currently only being down 300pips.
 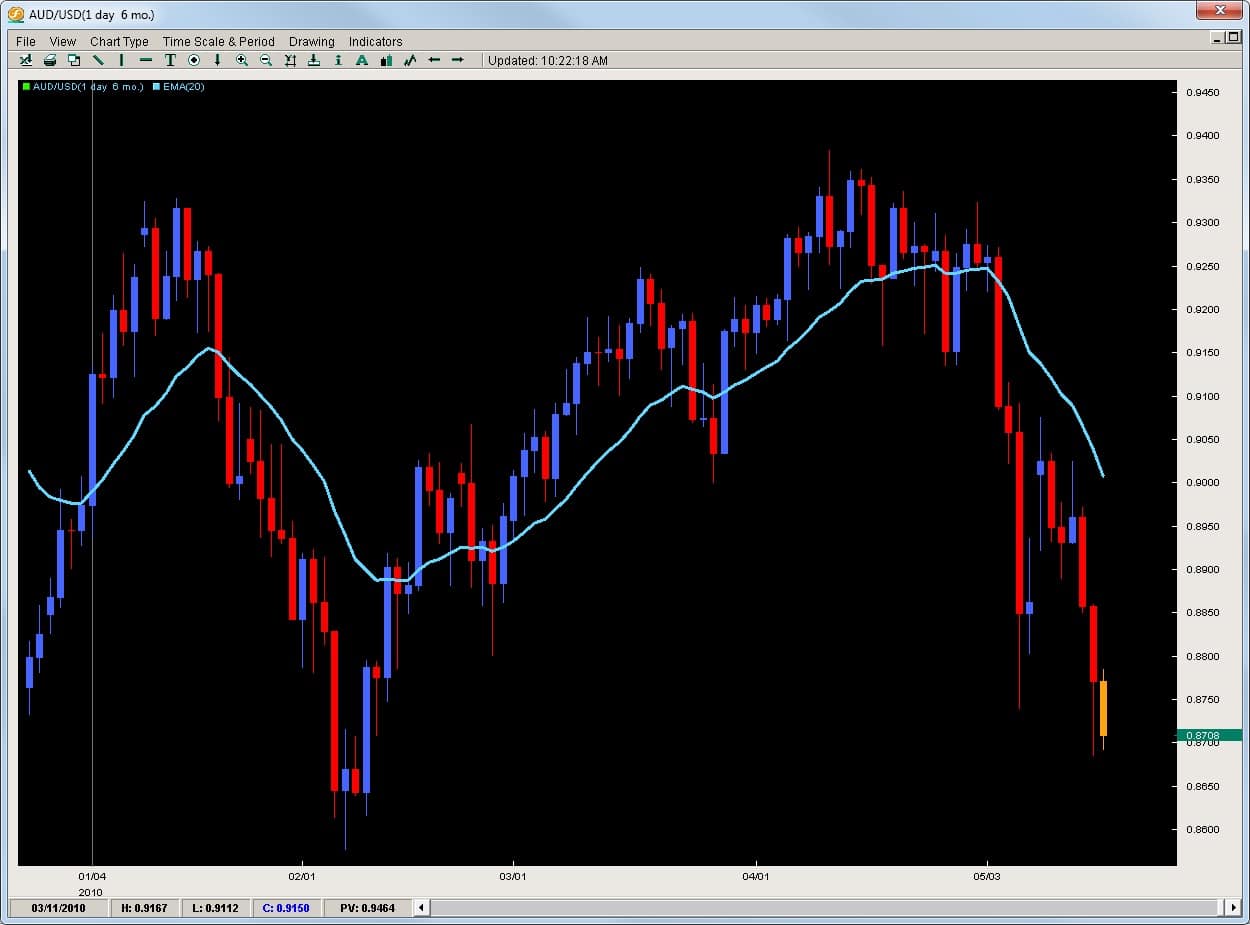 300 vs. 2000. Who is going to win this battle? The AUD will over the EUR. Thus, how does this lead to a trading opportunity for us? By buying the strong pair vs. the weak pair, or selling EURAUD. What does that chart look like? See below.
 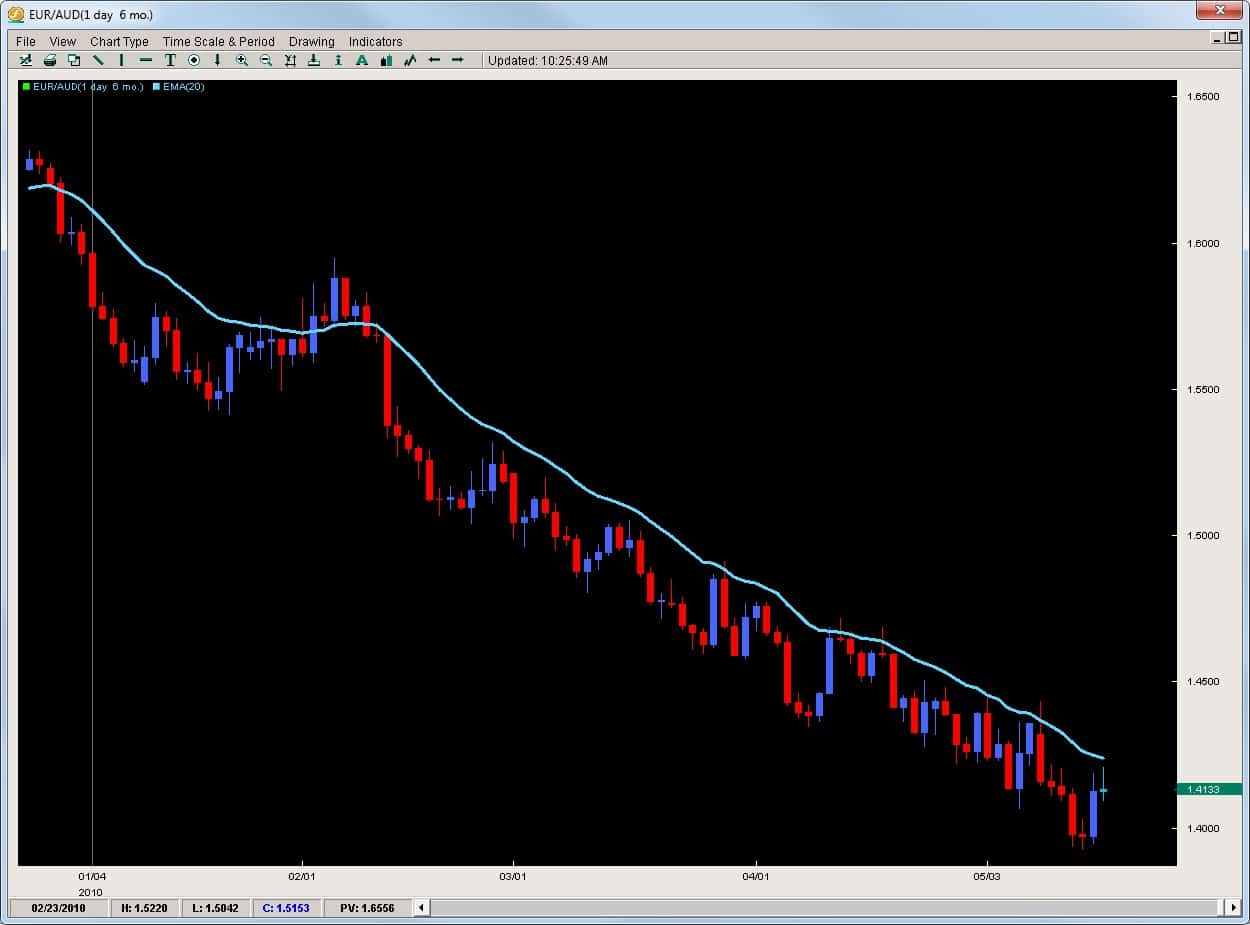 The EURAUD opened the year at 1.6000 and is currently sitting at 1.4130, shaving off 1870pips. Thus, trading does not always have to be complicated requiring lots of indicators to find good trades. By understanding how to read price action, determine impulsive vs. corrective moves and spot good formations, you can find great trading opportunities.
If you are serious about learning how to trade this market successfully, and find simple high-probability trades using pivots and price action only, you can check out the Trading Masterclass or the Advanced Ichimoku course which will teach you rule-based proprietary price action strategies and systems to trade these profitable setups.
In the current environment with the Euro getting punished across the board against every major currency and likely even the Iraqi Dinar, as traders we want to be taking advantage of these environments by getting short and staying short. However, there are times when the short term moves day traders like to take advantage of in these strong sell-offs communicate something different that we do not want to keep adding on shorts to a current downtrend or move. This is often found two simple price action formations called the ‘Piercing‘ & ‘Outside‘ formations. We will go over both so you can recognize them, learn what they mean from a price action perspective and how to relate or trade them.
The Piercing Candle
This is a simple two candle setup that is probably best applied to nothing less than 1hr time frames and ideally higher. The higher you go, the stronger it will be. Below is a traditional example of a Piercing Candle.
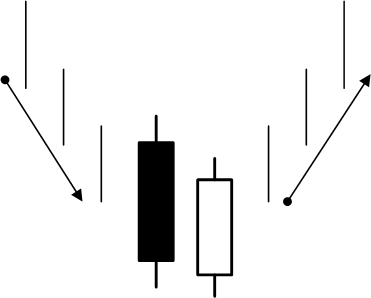
The way the formation works is we have to be in an established trend (either up or down). We will call this two candle formation an AB formation meaning there is an A candle (first) and a B candle (second). In this AB formation, the A candle is in the direction of the trend and is generally strong, one of the stronger or larger candles in the current trend. It could be large for two reasons;
1) Market is heavily participating in the trend
2) The market is giving one last push possibly before short covering (or long covering depending upon the direction of the trend) and taking profits
The institutionals usually like to give a really strong push before giving up a trend. An example of a piercing candle is in the chart below.
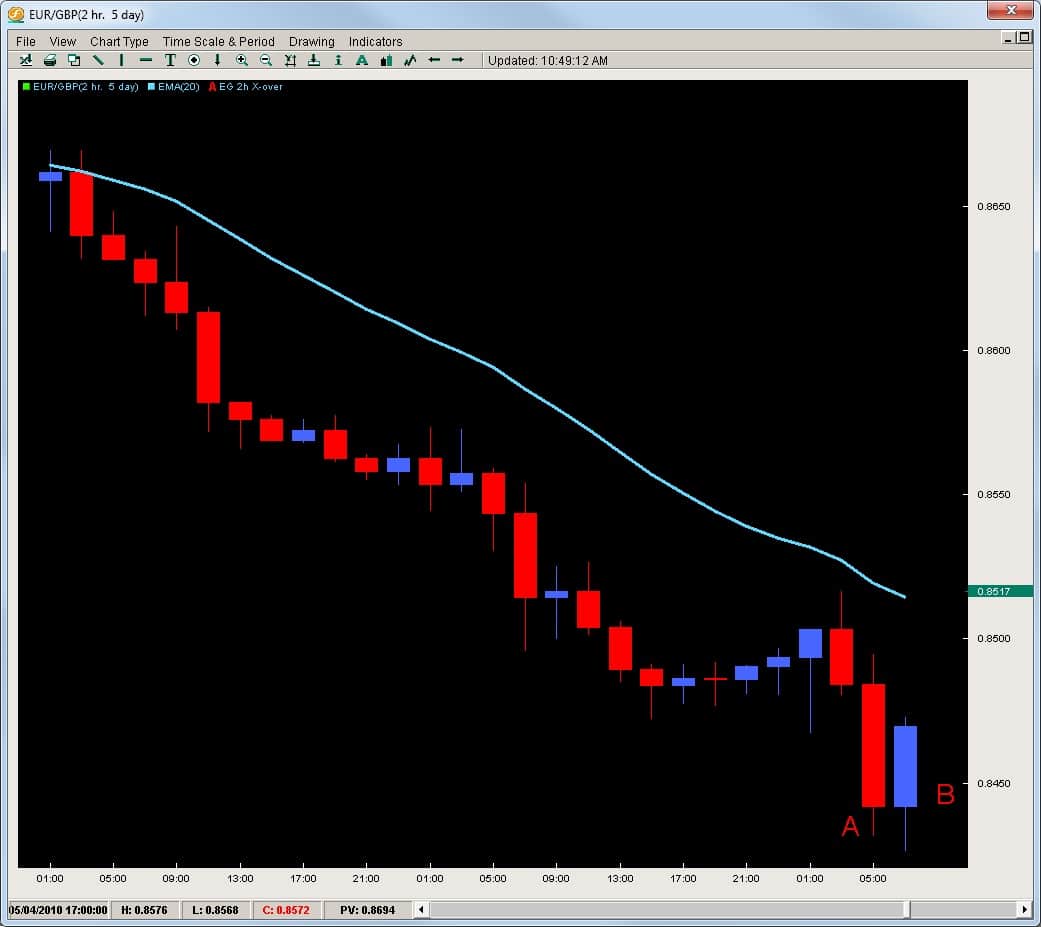
As you can see from the chart above, we clearly have a strong downtrend on the EURGBP. This is the 2hr chart and notice how at the end of the move, the A candle is quite large but is countered by a very strong blue candle. This AB formation meets the first two requirements being that;
a) we have to be in a clear trend and
b) the A candle has to be strong or large (ideally one of the larger ones in the move). We will address another reason why it helps for the A candle to be large soon.
Another requirement of the piercing formation is that the B candle ‘pierces’ a minimum of 50% into the previous candle. The more the better but it cannot engulf it which is another pattern. The max. it could pierce into the A candle is 99% for it to remain a piercing pattern.
Why is the 50% the line in the sand?
The reason why is anytime you have a strong downtrend, you have one side of the market clearly in control. For a really strong with-trend candle to be followed up and reversed minimally 50% or more by the next candle suggests it has the strength to counter the already existing momentum. This signifies strength to stop a moving force and reject it by 50% or more. Once it closes 50% or higher, it becomes a piercing pattern.
When we see these, its no longer a good idea to keep selling or trading in the direction of the trend until the coming reversal shows signs of weakening and the trend will likely resume. Below is the follow up candle to the AB piercing pattern.
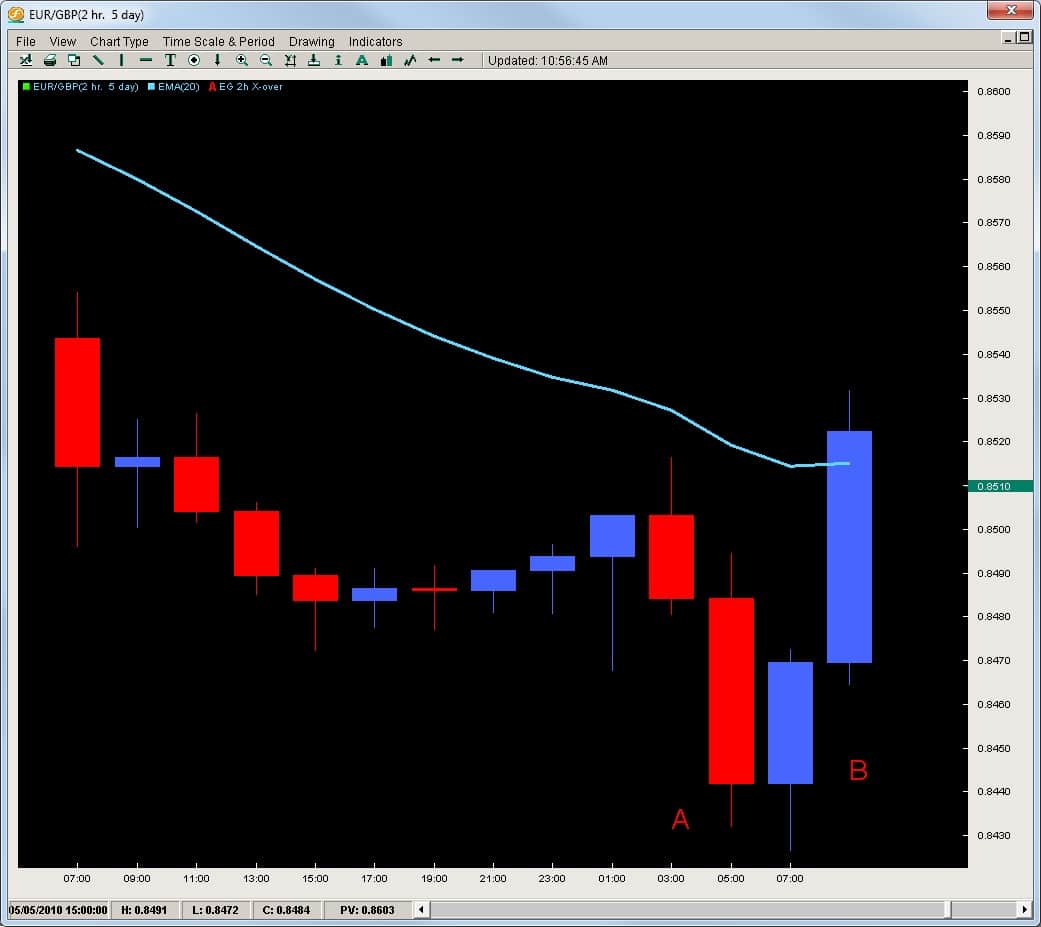
It is very common to see a strong follow up candle to a piercing pattern and this aids the price action context.
Thus, it is very good to be able to spot these patterns, especially if you are trading a strong downtrend and adding onto the position as it continues to advance. If you feel the trend is going to continue, one technique could be to wait for the pullback to reach a 20ema on the 2hr or 4hr time frame. If price stops here and then starts to reverse, then you can start to look for with-trend setups. You can also check out my article on the with-trend failure setups using the 20ema for another technique as well.
One other technique to get back in the trend is wait for a break of the lowest low or highest high from where the piercing formation was. A break of this level means whoever countered the trend has given up all the ground they made and are now losing money and the trend is likely to continue. Either way, being aware of these formations on the 1hr, 4hr, or daily time frames can alert you to take profits on your trend trades and wait for another setup.
Outside Reversal
This is another price action formation that you need to be aware of if you are trading trends and are wanting to know when to take profits and get out. Remember trends can go much farther than you think so having fixed targets or parameters for getting out of them is not always advised. It is better to wait for the price action context of the trend to communicate when the trend is ending before you get out and the Outside Reversal can sometimes paint this picture.
Taking a look at the same pair but on the 4hr time frame, we can see from the chart below the downtrend is met by a very large candle which engulfs or the price action is completely outside the previous candle. This formation is also an AB formation whereby the A candle is also like the piercing, a large candle, yet the B candles’ price action is ‘outside‘ meaning the wicks and ideally body of the B candle are both higher and lower then the highs and lows of the A candle. See chart below.
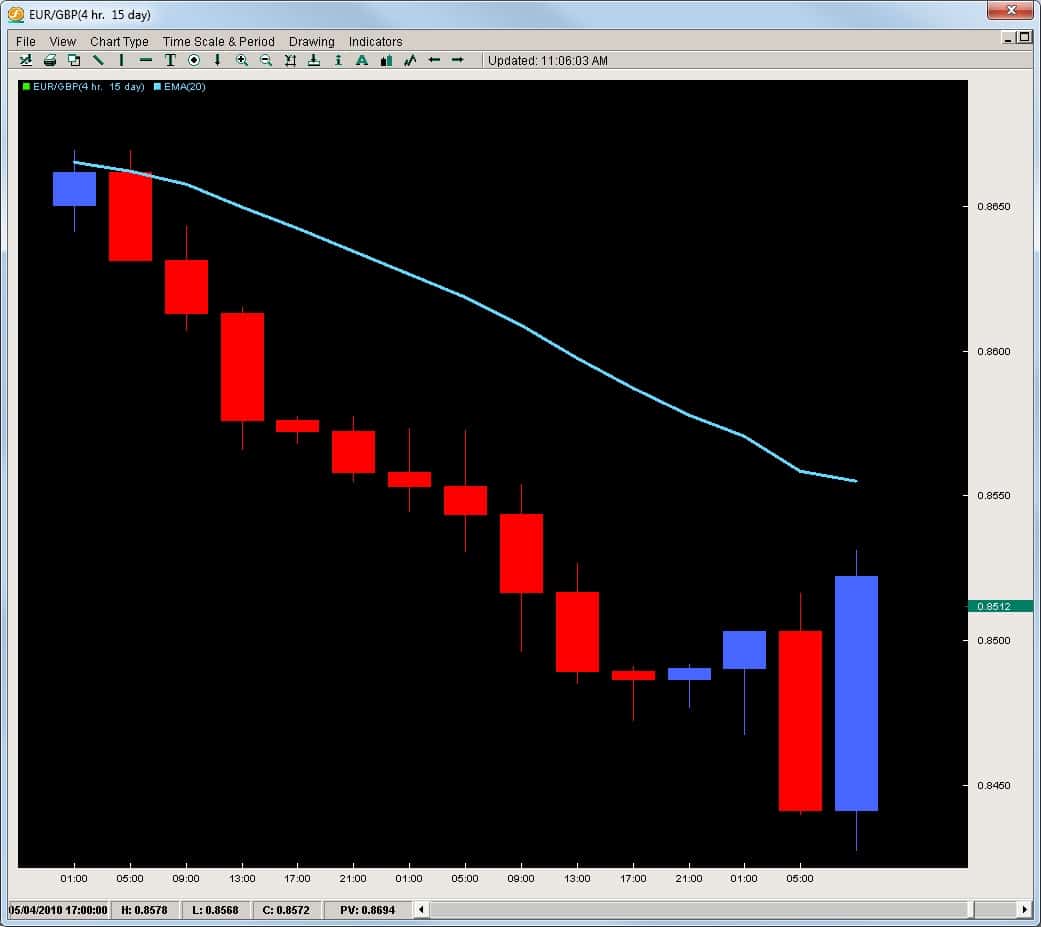
The same mentality applies with this and the piercing pattern, meaning when we see such a strong rejection without any hesitation, stalling, or bottoming formation, we have to pay serious attention to it and make sure to take profits when trading the trend and this formation shows up. Notice how the A candle at the end there is the largest in the last swing down, but is completely taken out by the B candle. To stop the trend momentum so forcefully and take out all the gains means the order flow changed hands real fast and control has been taken by the other side. We have to take profits on this and then wait for another setup to get back in the trend or look to see if its going to start a full on reversal of the trend.
Another example of this formation is in the chart below.
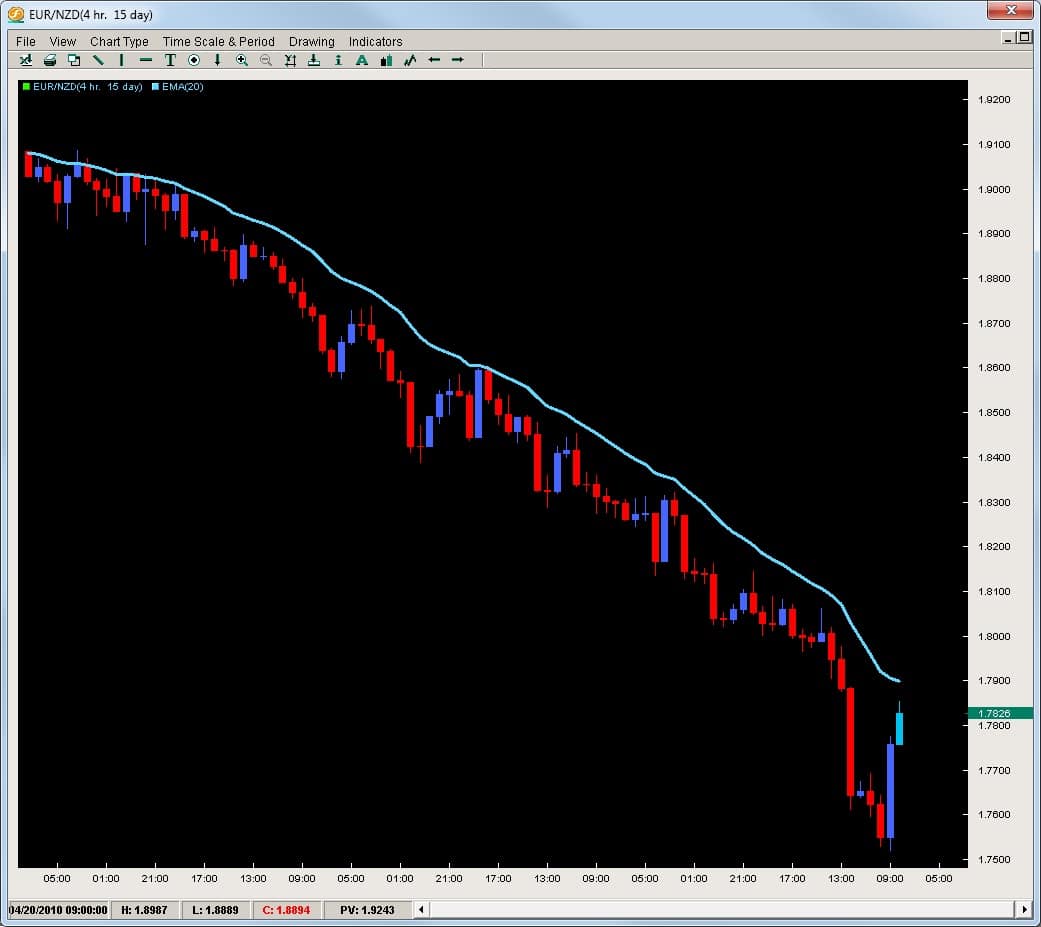
Look at how long this trend has been active with the euro losing 1700 pips to the kiwi. Then out of nowhere the pair reverses course with a huge outside formation and follows it up with another upcandle. All the other blue candles were not game changers for this trend, however this outside formation in two candle climbed 300+pips of the 1700 = 17.5% reversal of all the gains. You can bet any institutional traders short who just watched 17.5% of their gains get wiped out in 8hrs after being short for over 20days will take profits or even exit all together.
Thus it becomes critical to be able be aware of these and what they mean regarding the order flow behind them. This is crucial because environments like these where one currency (the euro) is suffering against everything across the board gives traders really good environments to make a lot of money in a concentrated period of time. These are times where the best traders like Jesse Livermore and Richard Wyckoff would die for and make large amounts of money just trading these environments. In some sense, it totally makes sense because the direction is easy to call and we just have to get in and stay in to make the money on these trends. Learning how to do this can often bring about a month or two worth of gains in a matter of a few trades. However, we have to be aware of the price action context which undermines these moves and tell us to take profits.
If you would like to learn more about price action forex piercing patterns and successful trading strategies, then check out our Trading Masterclass where you will learn high-probability rule-based systems to take advantage of such moves. If you want to learn how to get into trends and take 80% of the move, then check out our Advanced Ichimoku Course.
Reversals are one of the most common elements in markets traders are wanting to either know of to avoid or confirm their trade. The clues to whether a reversal is in play are hidden in the price action and easily found. These key elements are found in rejections which show up in the price action formation of long wicks occurring at key price levels.
Starting with the Rejection Wicks
The key point in a candle which confirms a rejection at a key price level is a wick and the larger the wick, the better. With that statement comes the question of ‘how much or how large the wick should be to be considered a strong wick.’
The answer to this question would be a minimum of 50%.
Why?
Because this is the minimum amount to satisfy the condition that one side of the market does not have more control than the other. Think about it like this. If price is in an uptrend and starts to approach a key price level, once it touches this key price level now creates a wick which reverses 50% of the price advance of say a 4hr or daily candle, this 50% rejection means the bears were able to stop the upward force/momentum of the current uptrend and 4hr/daily candle, but were able to push prices back 50% of that candle and move. This would translate into the bears having at least as much strength on the board in terms of order flow than the bulls because they were able to take half of the gains and eliminate them.
In some sense, it would actually translate into more strength because they also had to stop the momentum which was already upward. Thus, to stop momentum on any moving object takes energy and force. This then translates into there being the minimum requirements for a reversal for it demonstrates the bears have the minimum energy and force to reverse the trend.
Obviously the larger the wick the better because if the bulls who have the current handle on the market run into some sell orders and are not only unable to keep advancing price, but get pushed back quite a strong amount, this means the bears have taken short term control of the market and this can be seen in the price action.
Remember, a wick is a rejection of price. If price was accepted at a certain level, it would stay there or advance past it. However, if the order flow in the market does not support price being at that level, it will reject it and send it back because the institutions would be finding that price over-valued and time to sell. This is what it means when we say a wick is a rejection of price action.
Using them at Key Price Levels
This is the trickier part of your assignment – finding the key price levels. However with a few simple tools, its not that hard to confirm. We will suggest three tools to help you confirm the reversal is happening at a key price level.
Before we do, its important to note this works better on time frames such as the 4hr and daily charts. Anything below this does not contain enough time to signify an important impact on the market. Thus, when we are talking about these, we are referring to the 4hr or daily charts.
1) Pivot Points – key price levels that are respected and watched by all institutional traders, when strong price rejections occur at key pivot levels, they often have more impact. Why? Because institutions place intraday orders around pivots more than anything else. They enter the market at these locations more than they do any other price levels so when we see price reject strongly off a pivot point – it usually has more impact.
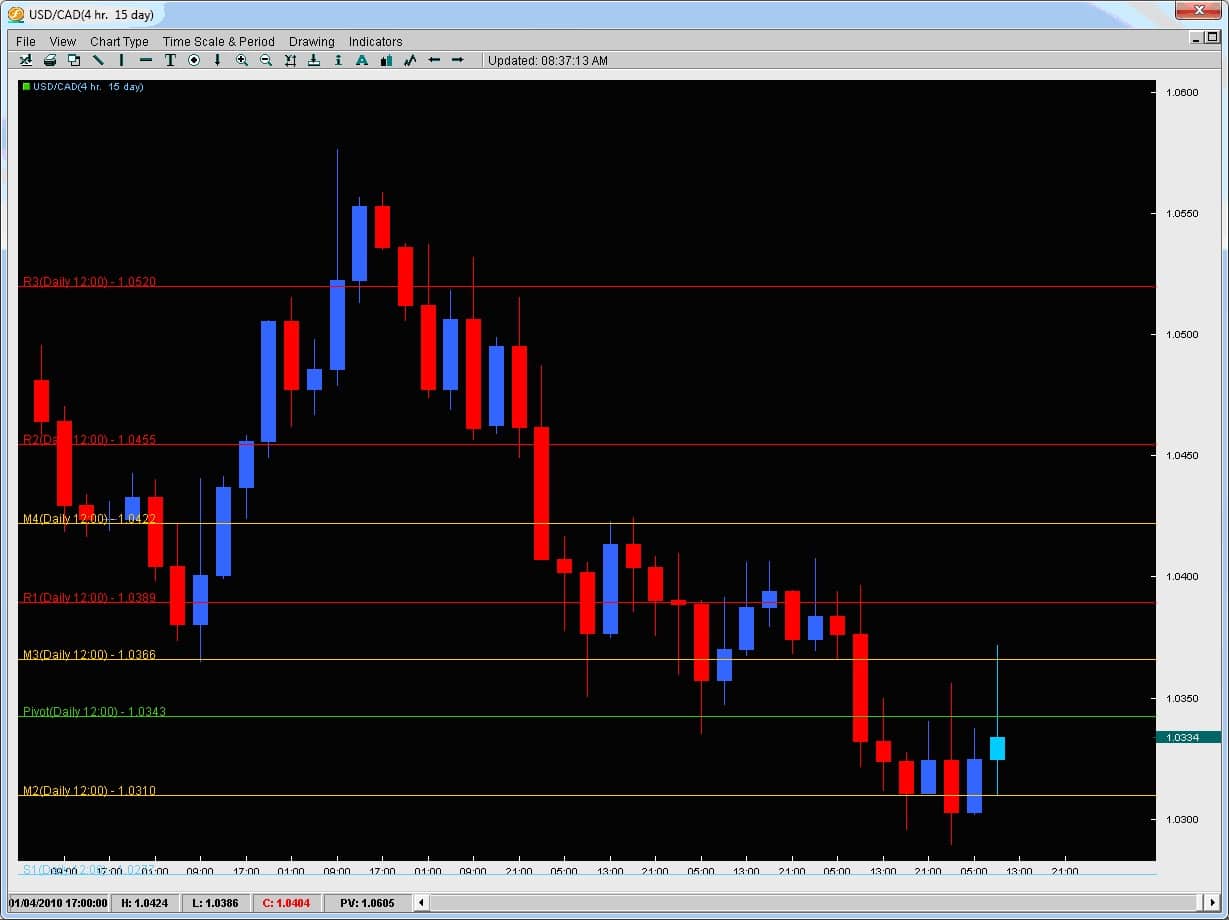
Taking a look at Exhibit A below, we can see how the price action had a pretty strong intraday rejection off of the M3 pivot level at 1.0366. This was the highest price surge for any candle on this trading day and it rejected back down below the daily pivot to stop where? At the M2 Pivot showing you the market is respecting these two pivot levels.
The fact that this pivot also happened to line up with a lot of the support for the candles to the left along with the swing low all the way to the left of the chart at the same price level shows this to be a strong intraday price rejection point. One can also notice the candle is over 50% of the entire candle’s size suggesting its strength. One other key point in the price action is that there is two way interest here as the support of this candle lies with a decent rejection to the downside which is also at a pivot.
Thus, when rejections occur at intraday pivot levels, they have more potency so look for them to line up at a pivot whenever possible.
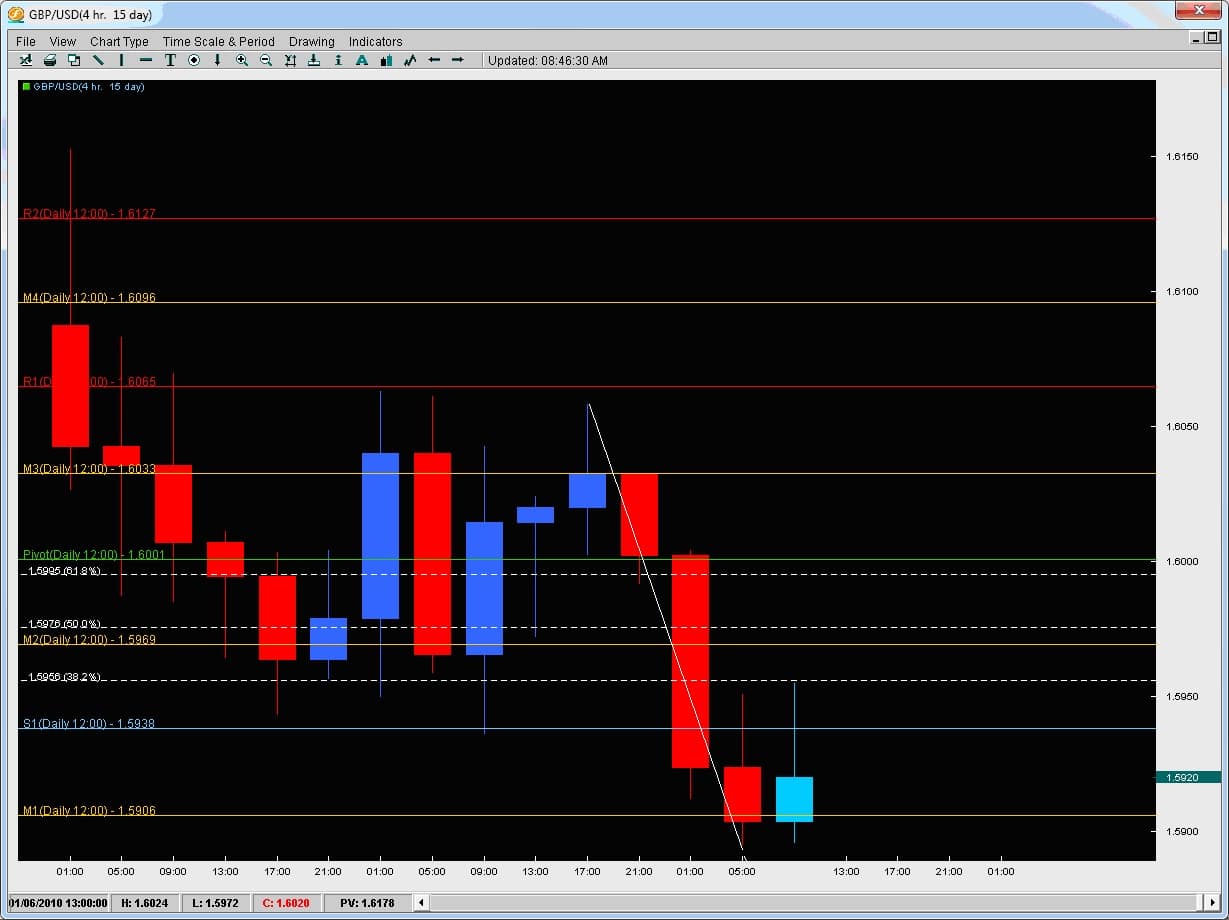
2) Fibonacci Levels – another tool to look for and help confirm the rejection is for them to occur at key Fibonacci levels. Which ones would we consider key? The 38.2 / 50 / 61.8% fib levels. Now which fib levels are the next question because they can be drawn from anywhere. Anytime you have a strong trend in place, there will be market swings and corrections. Fibs were meant to be used during trends to find retracement levels where pairs would find support/resistance in their current trend to continue the trend. Thus, when we pull fibs, we always pull them in the direction of the trend looking at the major swings. Below is an example.
In this chart above we have the GBPUSD 4hr chart where price was consolidating after a downmove and then started another leg down. Price hit a floor around 1.5900 and then started to attempt a reversal. However it created two rejection wicks right at the same level which was not only support for the previous consolidation move but also a 38.2% fib level thus making it a good rejection area according to Fibonacci price levels.
By combing previous support/resistance levels along with a key Fibonacci level, when a rejection wick occurs at these levels, it gives it further confirmation of it being a legitimate rejection.
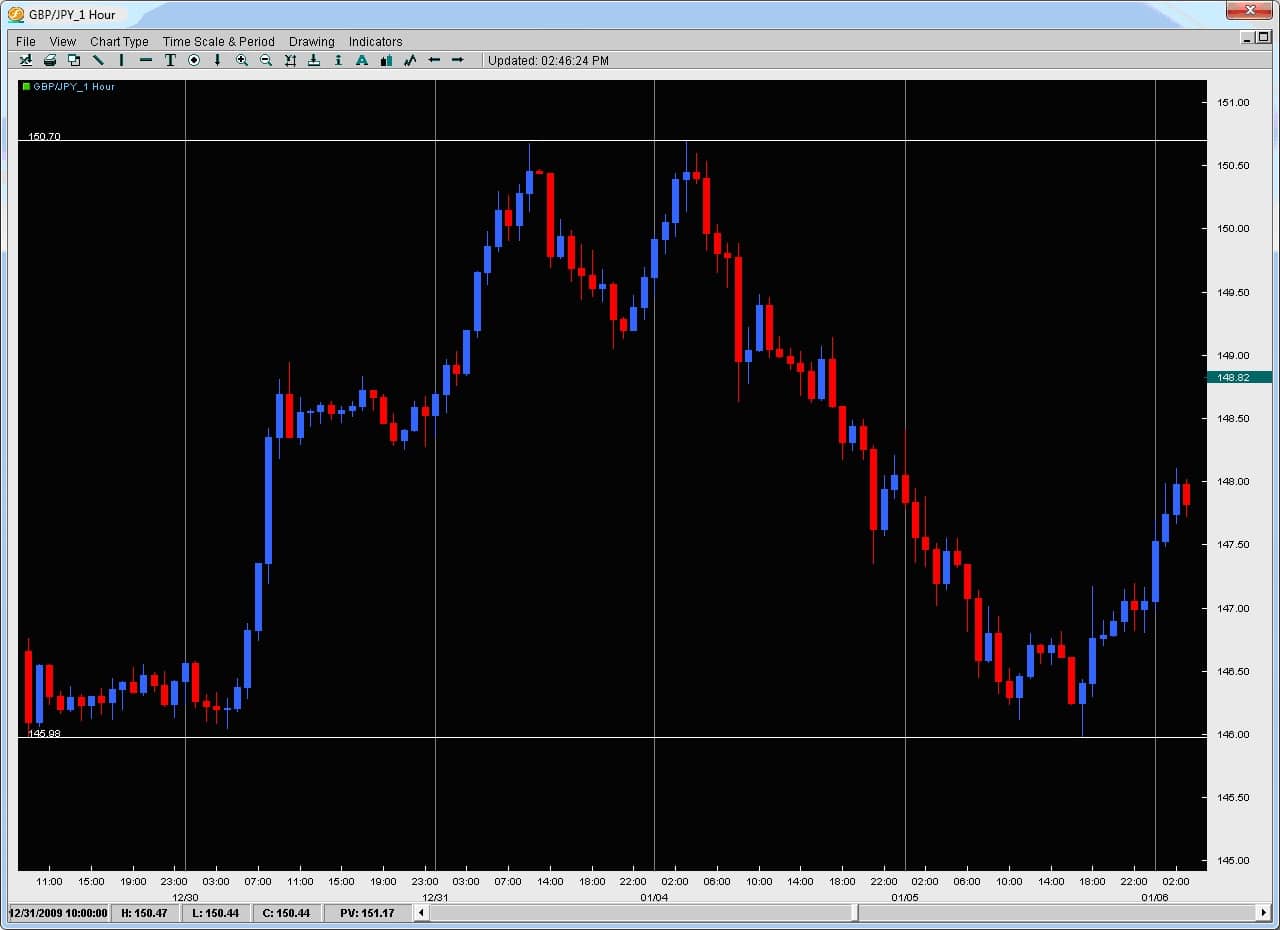
3) Key Support/Resistance Levels – previous swing highs and lows are great places to look for rejections to take place because the market had already rejected price there once before. If the market rejected price at a key level once before, it certainly should be considered it could happen again.
Looking at the chart below, we actually have two examples in the same chart. Starting at the bottom the price action was stable and holding at a particular level building a base around the 146.00 handle. After several touches on this price level, it launched up towards 150.68 where it rejected back down to 149.00 or 268 pips. It then very quickly re-advanced on this same price and swing high only to create a very strong rejection at this level by producing a very large wick. The price action from here then went all the way down to where? The last major base of support down at 146.00. Thus, by spotting these previous key swing highs and lows, and looking for larger rejections off of them, we can find great trading opportunities or examine the price action to confirm our reversal trade.
To learn more about how to spot these simple high-probability setups and how to trade reversals with rejections, you can check out the Trading Masterclass or the Advanced Ichimoku course which will teach you rule-based proprietary systems to trade these profitable setups.
In one of our previous forex tip articles, we wrote about the inside bar and how it is an important price action formation that can offer great trading opportunities. However it is important to note not all inside bars are created equal. To Review: An inside bar is a bar where the entire price action (including the wicks) are totally inside the previous bar. Now on lower time frames these are more common and not too important (say on anything less than 1hr chart) but on the 1hr time compressions and above, they have a lot more significance. In total, Inside bars form approximately 10% of the time (or are approximately 10% of all candles) and are a unique price action formation. When they occur at critical support / resistance levels (prior highs/lows, Fibonacci retracement levels, outer pivots, larger Kumo formations, etc) they have more impact and can often lead to strong price moves. There are several key reasons why an inside bar would form which a few are listed below:
- Price is consolidating after a large up/down move in price and is about to start another leg in the same direction
- Price is coming up against a critical support/resistance level which shows some hesitation in the market as to whether it will continue or not
- Price Action and liquidity is dropping before a critical news announcement so with nobody taking new positions, price will not have enough order flow to move consistently in one direction
- Profits are being taken
Since news events naturally drain liquidity before the event, they become less important in forming inside bars. The key things to note is that an inside bar generally forms from a) the consolidation of a large move before starting another leg or b) price is coming up against a critical support/resistance level which shows hesitation in the market. This pause in the price action gives us a great chance to get into trending moves as we can use the inside bar to get into the trend before the next leg starts. However, you still cannot treat them as equal. As traders we have to note whether the inside bars are occurring with trend or counter-trend? If they are occurring counter-trend, then they become much more difficult to trade. Case in point, take a look at the chart below on the GBPUSD 4hr chart. The trend is clearly to the upside with virtually no red bars and a 300pip climb. Then we have a red bar in the middle of the chart followed by a blue
inside bar. This inside blue bar was followed by another 250pip leg up. 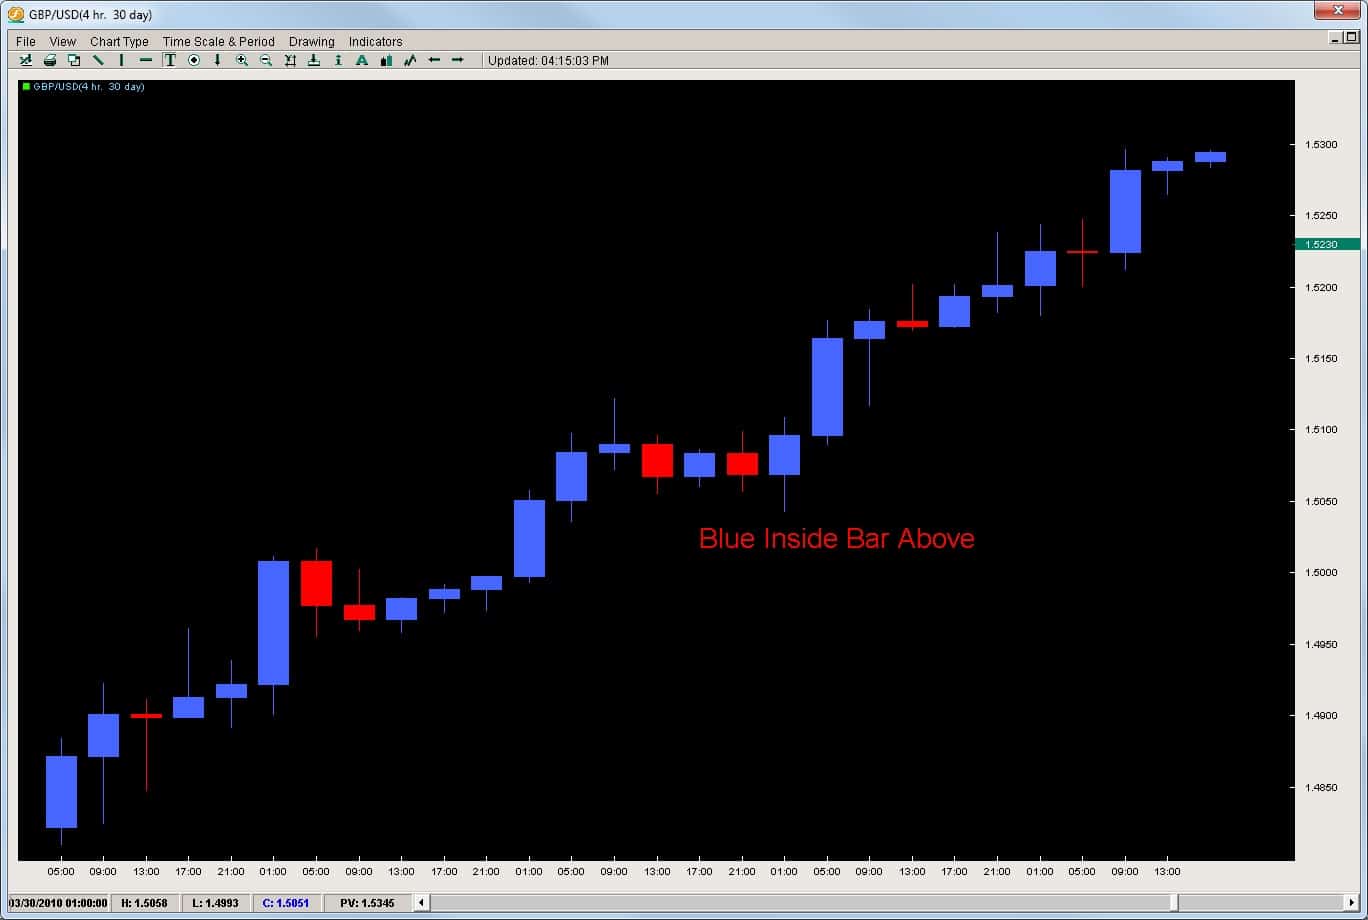 Even though the pause happened at the 1.5100 barrier and after a decent wick rejection to the upside, the bottom line is the inside bar formed after a down candle. The translation of this is price hit a resistance, traders took some profits, started to evaluate the move and while doing so, price sold off a little. An inside bar formed after price sold off a little so this inside bar does not tell us much other than price volatility is contracting. These are the least informative of the inside bar setups. Thus, you cannot trade every inside bar the same as they signify many different price action situations. With that being said, there are ways to trade them efficiently. We have actually analyzed inside bars on every pair from the 1hr to weekly time frames. From this data, we were able to extract the % chance it would; -break with trend -break counter-trend -what the average pip break with trend was -what the average pip break counter-trend was -and several other metrics If you want to get access to this and other proprietary quantitative data on the inside bar strategy or several other price action setups we have tested, then check out our Price Action and Pivot Point course where you get access to this data along with permanent access to our live forum and a follow up private one-on-one session. To learn more about this course, click on the link Price Action and Pivot Point Course or email us directly via the Contact Page
One of the most difficult challenges for traders is finding forex entries and exits.
It’s an important question that needs to be answered and can determine if you are; 1. getting in at the correct location 2. can have your risk defined and as minimal as possible 3. have a clear location to take profit 4. and know how to protect the position If any of these are challenging for you, then you will want to learn how to use pivot points. Created by floor traders decades ago, they were used as a method to mark key levels of support and resistance. It started out with the daily pivot but morphed into other pivot levels the institutions are watching constantly on a daily basis. If I told you about 70-80% of all 1hr candles will touch a pivot level from the London open to the London close and sometimes even the NY close, would you pay attention to them? I’d hope so because price action’s constant contact with them suggests their potency as something that has to be respected. Before we go into examples of them on the charts, we will go over their basic construction.
All the pivots start with the composition of the DP or Daily Pivot. The DP is calculated by adding yesterday’s high, low and close, then dividing them all by 3.
The formula looks like this: DP = (H + L + C) /3 If you think about it, some of the most important pieces of data from a price action perspective are yesterday’s high, low and close. The high and low mark the extremes of price for that day (or how far the market was willing to go) and the close measures the acceptance of price at a particular level, along with how much strength in the buying or selling there was (determined by the closes’ position to the high or low). The remaining pivots are calculated by various multiples of the DP.
The formulas are below:
S1 = DP – (H – DP);
S2 = DP – (H – L);
S3 = L – (H – L);
R1 = DP + (DP – L);
R2 = DP + (H – L);
R3 = H + (H – L);
To briefly define them, the S1, S2 and S3 are what we call support pivots (S = Support) and the R1, R2 and R3 are what we call resistance pivots (R = Resistance). The S1 Pivot is the closest of the support pivots and the R1 the closest of the resistance pivots. The farther we go out (S2, S3, R2, R3) the further the pivots are from the DP.
A chart below will show what they are and how they relate to price.
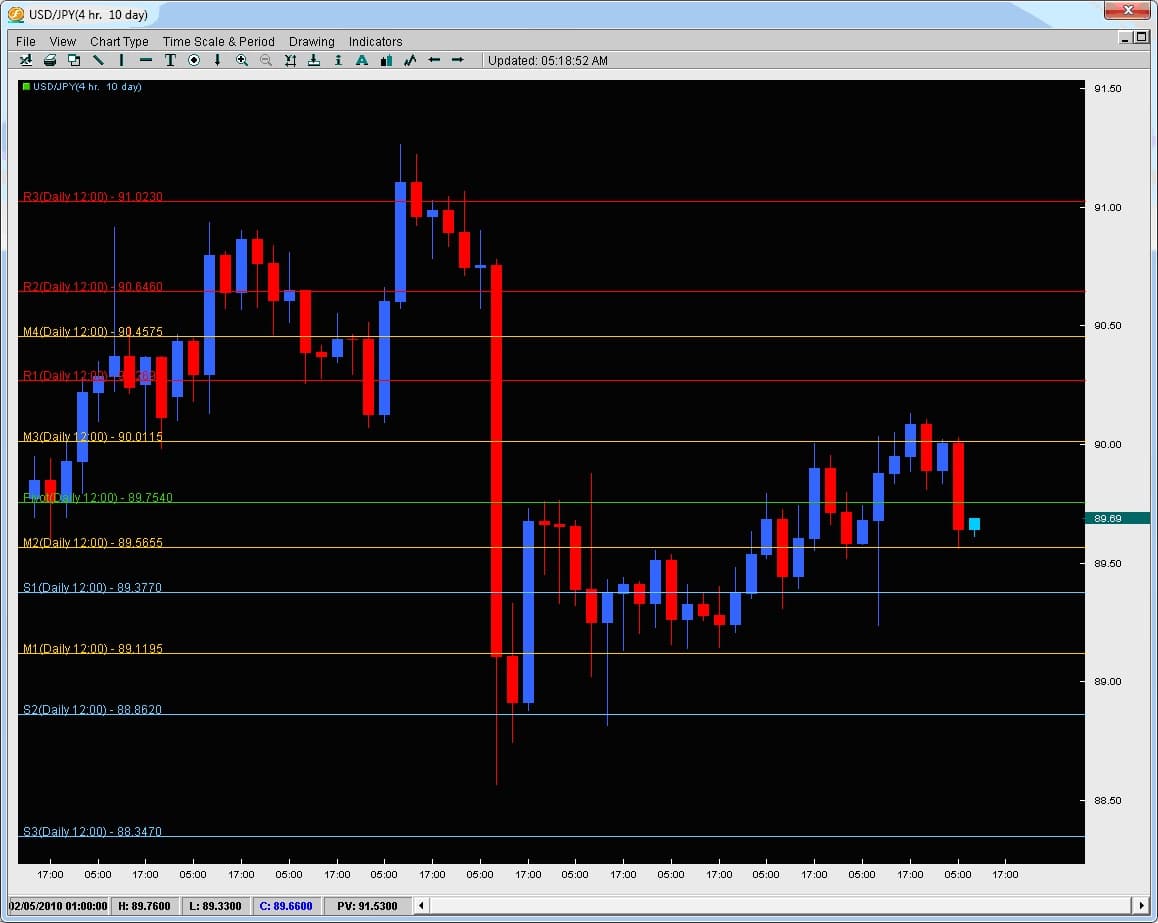
In this chart we are looking at the USDJPY on the 4hr time frame. The red lines are Resistance pivots and the blue lines are Support pivots. The yellow lines are Mid-Pivots and are simply the halfway point between any two pivots.
So how do Pivots help you with Entries and Exits?
Simple. The institutions regard pivots as one of the most important things for placing intraday forex entries and exits. Price actions response to them confirms this but in regards to any other indicator out there, nothing has more contact with price action than pivot points (except a really short moving average which has little meaning to price at that point). There are actually statistics out there which show how price will make contact with pivots 70-80% of the time (on hourly chart). Lets take a look at the GBPUSD on the 30m chart below.
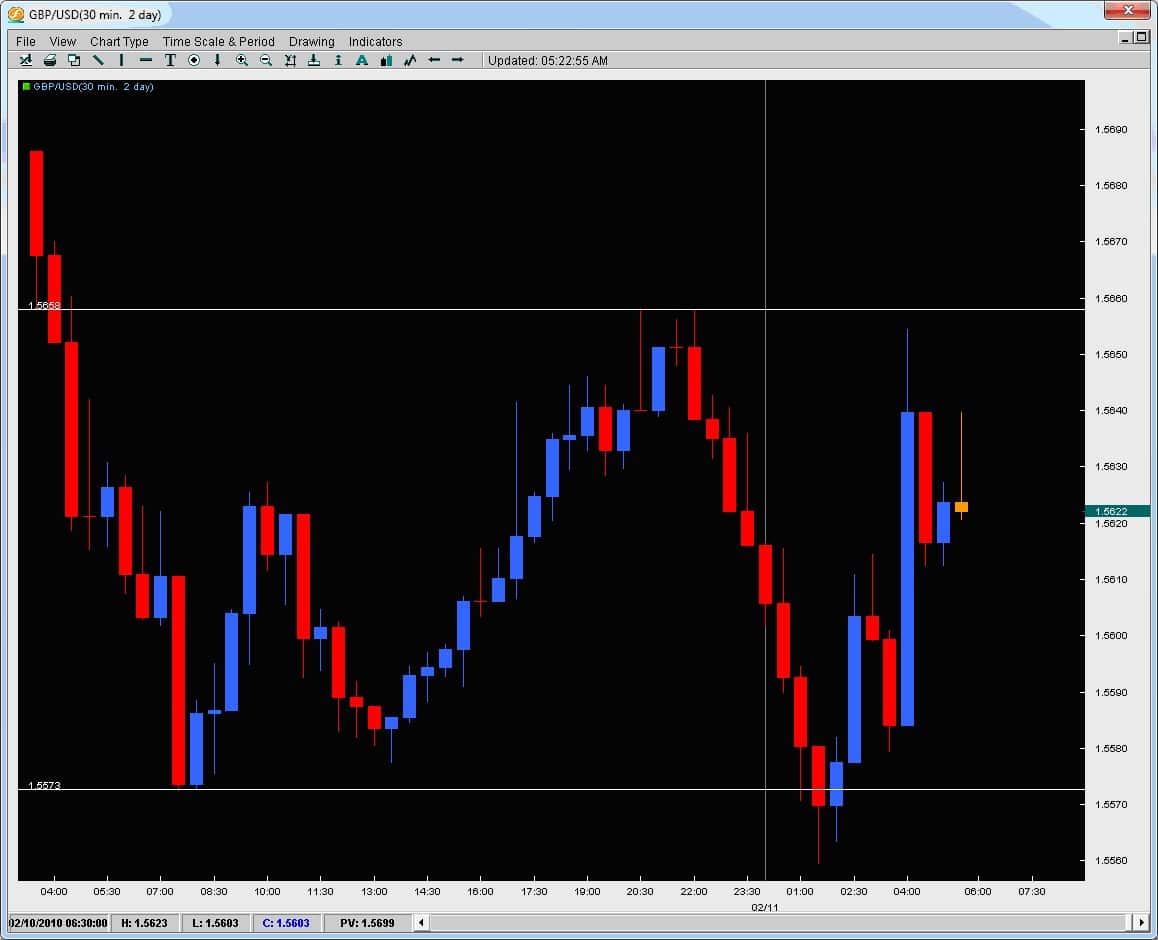
The grey line represents the London open (today Feb. 11th, 2010). We can see from the recent top why price today got rejected up around 1.5650/60 because of the last top there and price’s rejection at this level. But what about the bottom? The previous bottom was 1.5573 which the two candles to the left had touched but today, price went another 15pips past them. Why did the two candles today go past them and why did the market reject or react so sharply to those levels? Also, after bouncing off the bottom, price climbed to 1.5610 where two wicks to the topside formed and caused a small rejection. What was there to reject price in the past? This exact same rejection level became a support level once price had broken it.
Take a look at the chart below and you will have the answer why.
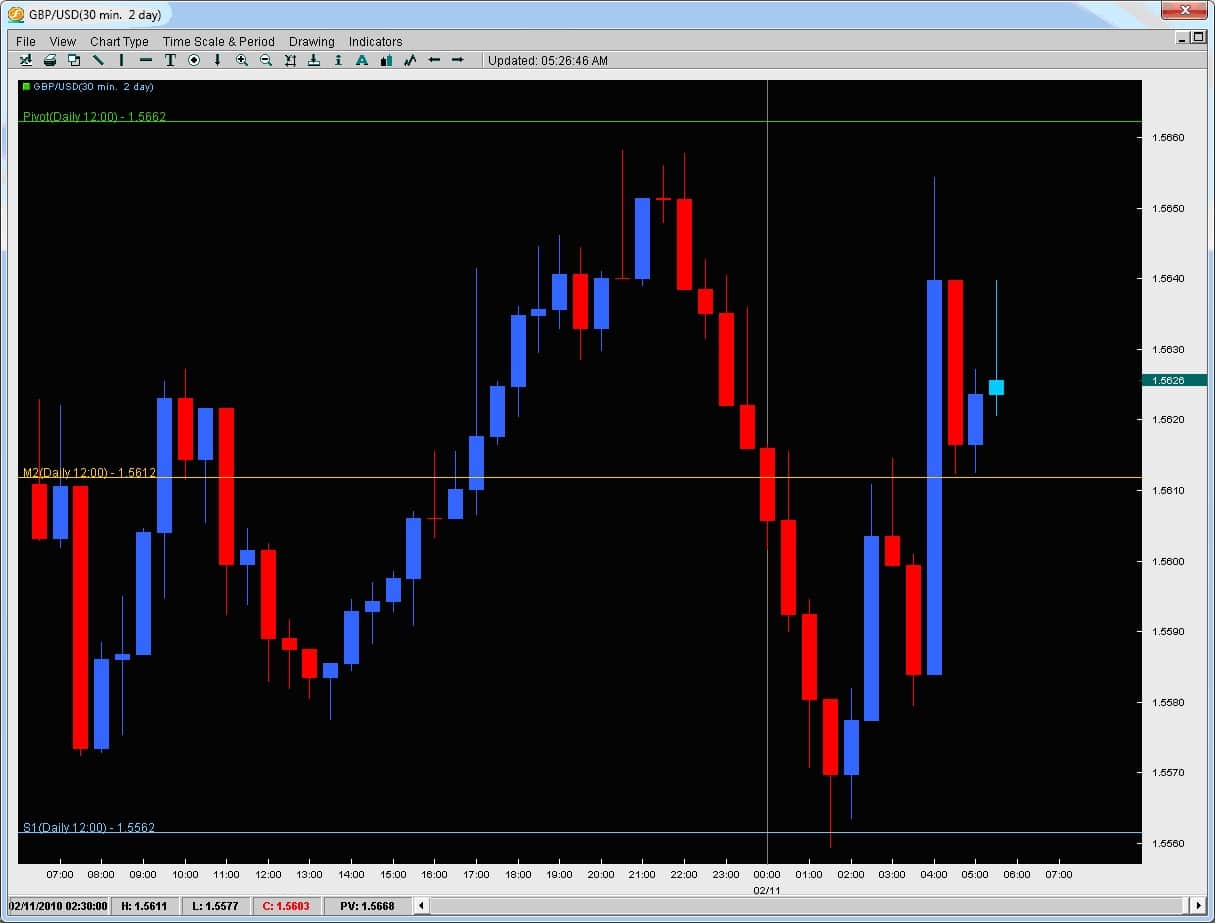
As you can see, price went past the previous support level and touched the S1 (Support 1 Pivot). Treated it as support for two candles, then rejected off of it.
Where did it go to?
The M2 Pivot (Mid2 Pivot) and rejected twice off there. Once price broke this level, it then came back to do what? Treat the Mid-2 Pivot as support. These types of reactions/responses from the market occur all the time on an intraday basis. They give the trader a much more precise level to enter the market for intraday trading while also giving us ideas for precise exits. If you would like to learn how to use them for precise forex entries and exits for your intraday trading, learn what the % chance price will break any given pivot on any given day, learn what the % chance price will touch the next pivot after breaking one pivot, or how to spot key reversal and breakout strategies using pivots, then check out the Price Action and Pivot Point Course.
When trading price action or using price action triggers such as Pbars, Inside Bars, Shaved Bars, etc. it is important to always wait for the bar/candle to close more than anything else.
Many people have challenges trading any system because the signals are forming in real time and not necessarily when the candle closes so you have moving elements to the candle, trigger and price action which are still in play.
The way around all this is to wait for the candle to close. Once a candle has closed, it is final – it cannot ever be changed and it will always be that way.
If you are ever tentative about taking a trade, wait till the candle fully forms and closes. Once it does, it will always be like that forever and cannot be changed. This means the signal is clear and there are no changing components to it.
Also, one important thing about trading price action and waiting for the candle closes.
It is often the case (whether it’s the daily chart, 4H, hourly, etc) that price action will be dominant in one direction for the majority of the candle only to reverse strongly at the end of the candle. Institutional traders know retail traders are less disciplined than they are. They know a good trading candle pattern could be forming and will often trap traders into believing that candle is an engulfing candle or reversal candle and then quickly move price in the last minute or 5minutes of the candle only to change it drastically with traders stuck or trapped into a certain direction hoping for higher/lower prices.
It is also often the case the markets will reverse at the end of a session or major candle as traders are paring back positions before market close as they want to be flat going into the close. When they do this, if the market was moving heavily bullish for the day, you will often see price dip a bit in the last 30minutes or less of a session as the institutions are going flat into the close.
Furthermore, a lot of trading today is done via algorithms which will often as well exit their positions causing strong spikes in price going into market closes. You can often observe this in the US equities markets as traders eliminate risk by not holding positions overnight to avoid the risk. Another example is in the London close as you will often see a strong push at the end to only see if fade just before or even perhaps just after the market London close.
Such price action patterns are common and by waiting for the candle to close, you are trading off real price action triggers. If the trading candle pattern is still forming, unless your system is specifically tailored to getting in mid-candle, it is often recommended to wait for the candle to close because up till that point, anything can happen and the formation of the candle and price action signal can change drastically.
Lastly, if something is strong into the close, once the candle closes, it often displays the final intentions of the market in the current move. Closes towards the highs/lows of a candle often indicate there is little profit taking so if you are trading in the direction of such a move, this can be a good confirmation sign. However if you are in a long position and the candle closes with a strong rejection/wick on the topside, the closing of that candle could be indicating the markets intentions to reverse it as price failed for that candle to maintain a strong high and close.
Thus, its always important when trading price action to look at candle closes and entering on them as much as possible.
For those of you looking to learn how to trade pure price action with no indicators, make sure to check out our Trading Masterclass where you will learn rule-based systems for trading Price Action.
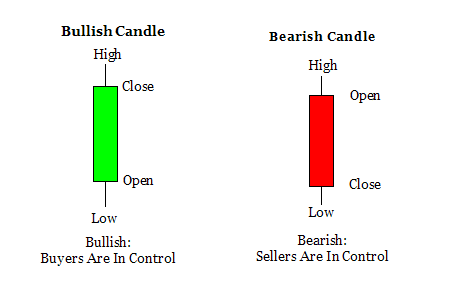
Wicks are an interesting phenomenon in price action formations and are virtually a part of every candle.Wicks can form on the top, bottom or both sides of a candle and represent the highs and lows of the price action for that candle on that time period.
What is important to remember about learning to read price action and wicks is that the wicks themselves are ‘rejection’ areas where the market simply rejected the prices of the wick.
It is important to note we are talking about the closes of candles and the wicks that form after because until a candle closes, it could be anything.However, once it closes, its final and its stamp is permanent.
When we have a wick that is large, that wick is clearly communicating to us for that time period (time compression for the candle) where the market was not accepting price.
If the prices were accepted, then price would remain there for a decent amount of time and close there.However, the fact that price does not close there means the market is rejecting that price value for that time.
If we are talking about 5min charts, then the market has rejected that price level via the wick for only 5minutes which is not that significant.However, when we start to look at 4hr or daily charts, this is significant.If you think about it, day traders are only witnessing two 4hr candles in a day, max three so for price to have a long wick on a 4hr chart is very significant as any day trader will take notice of the 4hr rejection as being a long period of time for price to be rejected – hence they will really have to think about trading against such a price action formation.Minimally, we suggesting looking at nothing less than the 2hr chart for significant wicks.
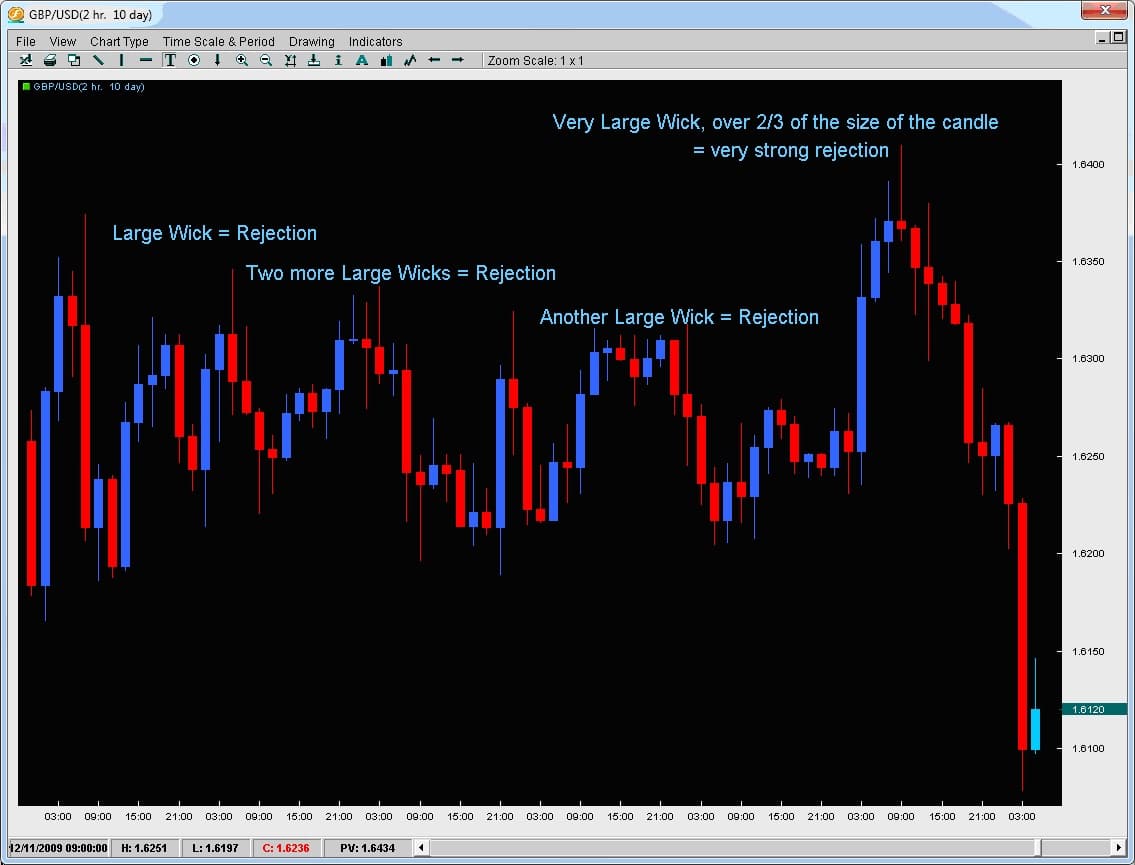
Taking a look at the example below, notice how every time the GBPUSD reversed, it did so with a very large wick and almost at the same price level?This was telling us the market simply did not accept prices at these levels with sellers aggressively entering the market quickly causing the pair to drop fast and not even close at those levels.The most notable one was the last wick with the wick being over 2/3 of the entire candles price range suggesting there was competition to sell the pair that high.
If the long wick is on a daily chart, day traders from all three sessions will have to take note of it and really be confident about their trade to go against the wick which is where the market rejected price for that entire day.If you are a day trader, you are only looking to be in a trade for a matter of hours and likely targeting an amount of pips less than the daily range for that pair (or at least you should be).
With that being said, they are also likely either targeting the price action within the days range or a breakout.However, what price levels are they watching if trading breakouts?
The highs and lows of the days candle which includes the wicks.And if the wicks represent a rejection zone, any day trades will have to be outside of it, thus making the chances of trades being placed inside the region of the wick less likely.
It should be noted when analyzing price action that the markets will usually make a second attempt to breach a price level before it gives up.Thus, if someone is going to reverse a pair, using the tail end of the wick offers the trader good risk/reward opportunities.
To learn how to find and trade these price action strategies, check out our Price Action Course which teaches you simple, rule-based proprietary price action strategies based upon 10+ years of quantitative data and analysis.

