Tag Archive for: reading price action

If you think this article is going to be about learning a price action setup, you’re wrong, but it will be about something more powerful.  For your future, for your learning process, and for your sanity, keep reading this article if you are not consistently profitable.

Of all my articles, the most popular and commented ones are always on some specific setup or system.

Why?
hunting for the one system setups, price action and context 2ndskiestrading.com

Because almost all of you have been hunting for the one system, that edge which will turn your trading around.  That edge which will print money into your account day after day, week after week without much effort.  You’ve probably amassed dozens of patterns and systems, yet still aren’t making money.

Sound familiar?

If so, don’t worry – that was me 12 years ago.

But I think it points to a problem for those hunting through forums, websites and videos looking for your pot of gold.  All of your focus and energy has been on finding a ‘system‘ or ‘price action setup‘ that makes money.

Sure, everyone wants their own ATM machine – who doesn’t?  But what is also going on is you want the market de-mystified.  You want trading to be simple and easy, i.e. thinking three simple setups will solve all your trading problems and help you understand the market.

Regardless, this underlies two things which will trip you up in trading;

1) The fallacy three simple price action setups will consistently make you money if you have good money management.

2) Being uncomfortable with uncertainty.

Today’s article will be focused on the first point, and the next article will be focused on the latter.

Three Simple Setups?  Really?
To begin, it is a complete fallacy that if you learn what a pin bar, inside bar and a fakeout system is + good money management = making money…that you understand and can trade price action.

How convenient that a market which has brought traders to its knees, crying, jumping out of windows after losing fortunes, that three simple setups and good money management (plus a little psychology) is all you need to be a profitable trader.

If that was the case, why isn’t everyone doing it?

Why are banks spending thousands of dollars, and months, if not years on end, training their traders, when there is such a conveniently packaged solution available?

My programmer was recently at a algo conference with some of the top hedge funds.  He told me they are spending hundreds of thousands of dollars re-programming their algos every 12-24 months to keep a competitive edge.

Why would they do this if they could just learn what a pin bar was, inside bar and fakeout setup is? Wouldn’t that be easier?

Newbie traders want to hear the market can be simplified into three price action setups, that trading with the trend and good money management is all you need.  It perpetuates a dream which is actually a false reality.

dreaming of money 2ndskiestrading.com
This is why I have always talked about learning to read the price action in real time, that you cannot rely upon systems alone.  Yes, a pin bar can be a highly effective method for trading various price action situations.  But it always has to be taken in Context.

Two Scenarios
To demonstrate this point, lets take two scenarios;

1)  A bullish pin bar forms after a long trending move.  This trending move ended with an exhaustive candle which then proceeded to form a double bottom off a key support level.  The pin bar closed bullish and formed on the 2nd bottom also creating a 3 pip breakout below the lows.  Am I going to buy that pin bar if I get a corrective pullback towards the double bottom?

Absolutely!

I see that – I’m going to buy that.  The pin bar was a very good setup and price action cue for me.  But remember, pin bars can be both cause and the result of order flow.

However, we have the other pin bar scenario….

2) Price action has dropped 1000pips in the last two days.  Then in the middle of the Tokyo session forms a tiny pin bar on the 4hr time frame that closes bearish.  Am I going to buy that pin bar expecting the price to reverse?  NO!

Why???

Context!

You have to understand, there is nothing wrong with the pin bar by itself.  It can be a highly effective signal, or it can lead to losses.

What is the difference?

It’s not money management, or trading with the trend, or your psychology.

It’s the context with which it forms.  But to understand these differences, you have to learn to read price action in real time, and what it has done in the past around those levels.  That is the context you have to learn how to read.

Passive vs. Active Learning
To be sitting there passively, waiting for days on end for your three simple price action setups is trading in passive mode and flat out boring.  And boredom will actually interfere with your learning process.

boredom interferes with learning process 2ndskiestrading.com

If you can only find one setup a week, you’re not looking hard enough because there are plenty.

There is no active learning, and active learning is what you need.  In active learning, you are engaging your resources, your current level of knowledge and applying it.  In passive learning, you are not engaging any of your knowledge and seeing how it works in real time, learning from the feedback loop called the markets.

If you are sitting on the sidelines for days on end, just waiting for your three simple setups, you’re wasting your time.  You could be learning, trying, studying, and participating in the market which is what facilitates learning.

I didn’t just learn what an inside bar was and then trade it based on what it should do.  I spent dozens of hours studying 1000’s of inside bars and pin bars, to see what was different between them all, and how did price action form after each unique one.

I have pages of notes about pin bars, how each one forms, its size in relation to the prior bar, where it forms in relation to the prior bar, in the trend, near the 20ema, in relation to the surrounding price action, support/resistance levels, etc, etc, etc.

I don’t just trade pin bars like a robot.  I trade them in context, and that is what gives me an edge, to be able to read the price action in real time, and what the market has done around current levels.

A Student
One of my students wrote just yesterday on this subject:

I am at that point where I know I want to be a full time trader. I absolutely believe that the strategies, models and methods we are taught in this course can lead to profitability, because I’m using them everyday and they lead to good profitable trades.

However, I have moved away from just seeing a pin bar or some other signal and just pulling the trigger, because I have moved toward understanding price action the way Chris talks about in his lessons, like he has done on breakouts, the aussie price action, the USDX, etc.

I believe that as traders we can trade these strategies and make some money, but we will not evolve as traders if we don’t begin to read and understand the price action that is occurring around these different setups.

trading ideas 2ndskiestrading.com

When I read this, I was nothing but smiles as the light went on.  This student gets it, and gets what I have been teaching.  He understands that pin bars, inside bars, and all the other methods have a purpose – but they are not the road and vehicle towards profitable trading.

Although they are highly informative about what the order flow is behind the price action, he understands they are both cause and result.  This means he understands sometimes they are the cause of order flow, and other times, they are the ‘result’ of order flow.  They are not simply just one or the other.

It also means he is spending his time learning to read the price action in real time, to understand what kinds of order flow would create such price action.  He is not passively waiting for setups, and then pulling the trigger like an automaton.  He understands that these setups have to be taken in context.

In Summary
Don’t waste your days on end in waiting mode for your simple three setups to occur.  Understand three simple setups will not lead you to profitable trading, nor understanding price action.  If it did, everyone would be doing it and that is all they would be teaching at banks and hedge funds.

Understand trading price action means learning to read price action in real time.  It means being an active and deliberate learner.

Understand that price action setups are highly valuable tools – but they have to be taken in context.  You have to learn to read what kind of order flow would create such price action, and how to trade this flow.

I hope this helps and that it changes the way you look at price action and your learning process.

Please make sure to leave your comment, like and share this post.

Kind Regards,
Chris

Today had produced some interesting price action plays, so I wanted to share with you two trades that I took today.  I am going to break down exactly what I was reading from a forex price action perspective, what my analysis was, how I took each trade, including the entries, stops and limits, and why I chose them based on what I was seeing in the price action.

While the NZDUSD has been stuck in a range for the last two days, I have been playing the consolidation range which has held up nicely.  Being that the Kiwi tends to be a little slow at times moving at a tortuga pace, I noticed a few price action setups in Silver (XAGUSD) and took a couple of intraday plays.  It is these two intraday trades I am going to be dissecting for you from a forex price action perspective.  I am also going to be sharing how I used quantitative price action data on the intraday volatility for Silver to aid my trades.

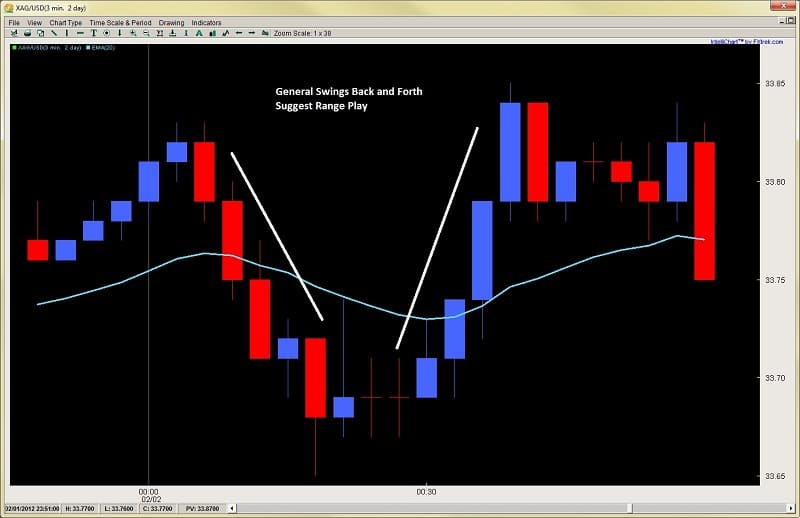
Taking a look at the chart below (3min on silver), following the grey vertical line which represents the London open, we can see price starts out a little choppy.  For the first hour, price action stays within a $.20 range which is actually less than the normal volatility for this pair of $.30 for the first hour of the London session.  This communicates to me there is actually very little directional dominance being a 33% lower range of volatility.  If this continues, then I will look for a reversion to the mean play.

Why?  Since no one dominant player is directing the market, there is still a tug of war going on with both sides being relatively equal.  This means price will continue to revert back to the mean until someone takes control.  Thus, I will look for reversal plays.  As you can see by the price action, the small swing down was about the same strength as the small swing up.

intraday price action 2ndskiesforex hour 1

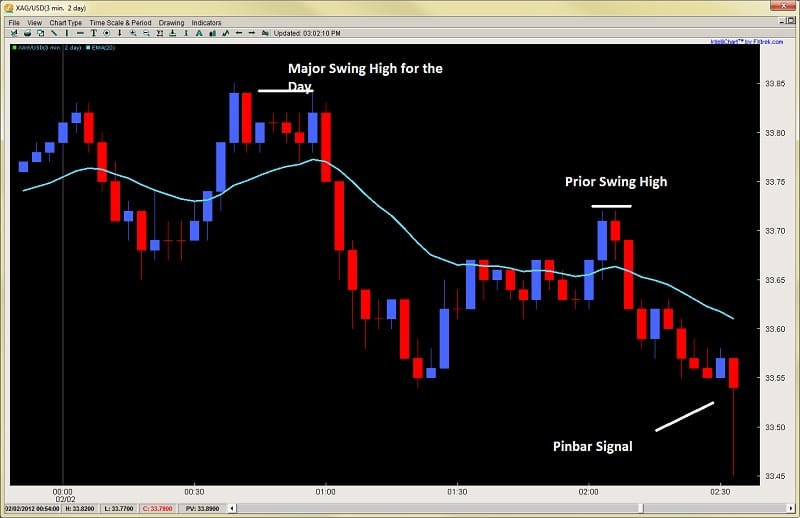
At about the 2.30 mark (2.3hrs into London session), I got a pinbar formation.  This is a reversal signal and definitely leaves me the chance to make my reversal play.  However, I hold on the trade for two reasons;
1) If I took the trade on the open of the next candle, my stop would have needed to be about $.10 and my target to the last swing high would have only been about $.15 for a 1.5:1 Reward to Risk ratio.  

2) The market structure has not given me a HL (higher low) which would have confirmed to me the market structure was changing and that I had a reversal buy in play.

These two things combined told me to put the trade on hold so I passed.  Look at the chart below to see the resulting price action.

intraday price action 2ndskiesforex chart 2

Initially, when the price action hit the prior SH (swing high), it sold off at a steady pace.  But noticed how it picked up with a very large red bar toward the end, making a quick rejection low. This increase in the size of the bar communicated stronger selling participation.  But it also had a small rejection to the downside followed by a gentle pullback (perhaps exhaustion).  This was a small clue there might be orders close to the lows of the prior pinbar, so I watched for the price action to give me a lower low.

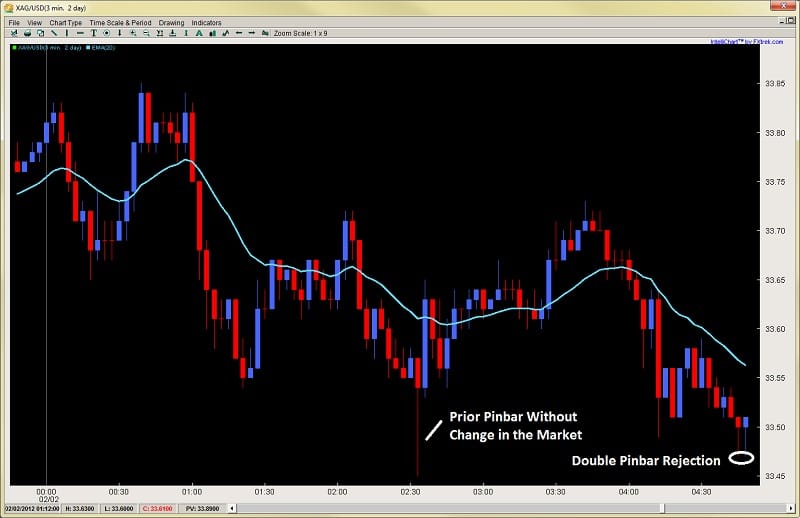
As you can see at the very end of the chart, it did, forming a double-pinbar.  This double-pinbar formation communicated to me from a price action perspective two things;
1) not only was the first pinbar rejection a likely higher low offering me a good R:R play, but…

2) the second rejection was telling me after price made the first pinbar rejection, the market tried a second attempt to make a new low and failed.  It failed at exactly the same price yet this time closed up on the bar.

intraday price action pinbar signal 2ndskiesforex

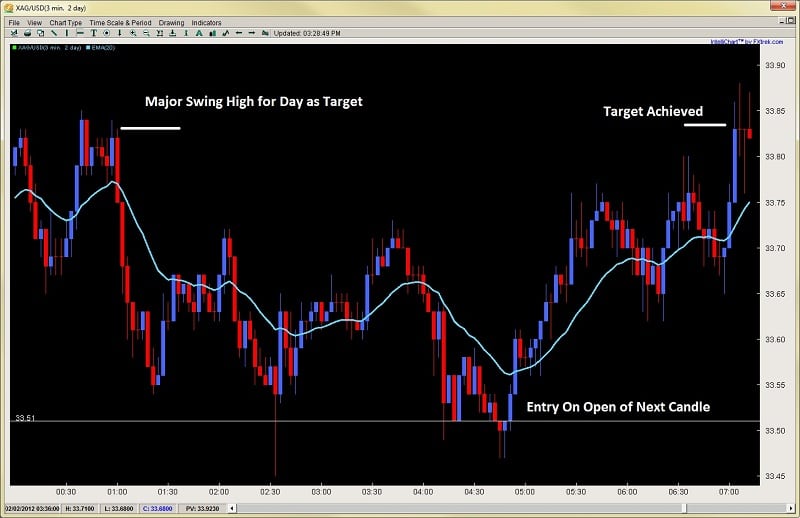
Combine this with the fact price was still staying below its normal intraday volatility levels, and I had all the ingredients for a nice reversal play.  All these together suggested a high-probability buy on the open of the next candle with a tight stop of less than $.10 while targeting the major swing high for the day at $33.85 (over $.33 away for a +3:1 Reward to Risk ratio).

Below is how the trade played out.  It broke the prior swing highs, made a HL (higher low) and then shortly after went on to its target at $33.85.  Keep in mind my entry was $33.51 with a target of $33.85 ($.34) and a stop of less than $.10 so over 3.4:1 R:R ratio.

intraday price action pinbar trading 2ndskiesforex

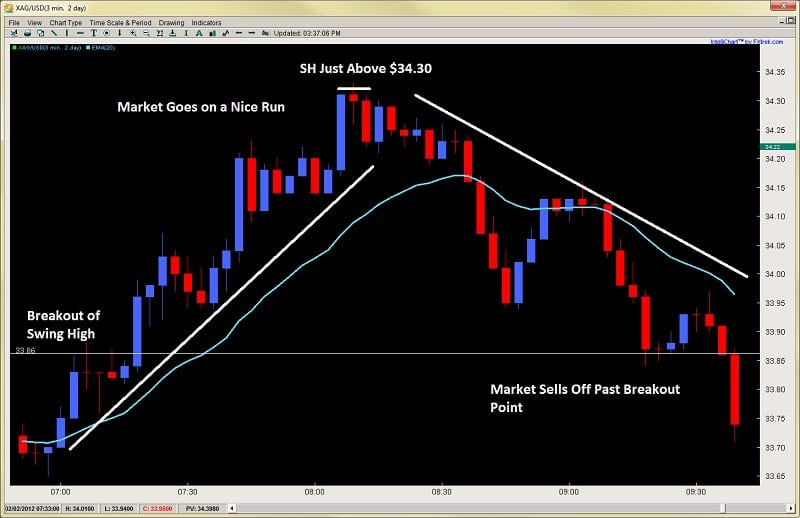
After hitting the first play on silver, it started to go on a run as it broke the SH (swing high).  After breaking the $33.85 swing high, the market climbed over $.50 in less than an hour.  Using my quantitative data on intraday volatility, this was approximately 20+% higher than the normal volatility ranges for this hour of trading.  I’ll confess, I did not catch this upmove, but looking at it, I had two choices:

1) look for a market structure change to reverse the pair short as it may revert to the mean after the larger than normal surge in volatility, or…

2) look for a pullback to a prior value/support area and look for an entry to get back long.

I honestly didn’t know which of the two was a better play, so I watched the price action for clues.  I want you to take a look at the next chart which shows the rise and fall of the shiny metal and take a look at the key difference between the two moves.  See if you can spot the two subtle clues which communicated to me what I wanted to play.

forex price action 2ndskiesforex feb 2nd

First, notice how the angle of the two moves and the subtle difference.  The buy up was a pretty sharp angle, while the sell-off, although impulsive in nature, had a flatter angle.  This flatter angle communicated to me there was less strength in the selling then there was in the buying.

Secondly, look at the nature of the buying and selling.  The buying was almost straight up with very small pullbacks telling me the buyers were quite dominant.  While in the pullback, there was a see-saw type action, telling me the sellers were a) less dominant, and b) there was a fight going on between the buyers and the sellers unlike in the upmove. This all communicated to me via price action the market was likely going to reverse back up so I should look for a long after seeing a market structure change.

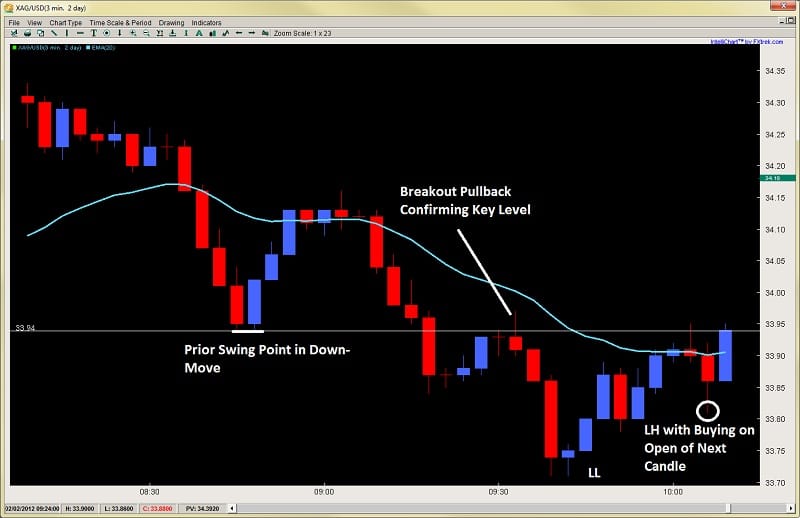
On the next chart below, shortly after the bottom, I got my market structure change.  After bouncing off the low, the price actually bounced back into the prior range of the last pullback suggesting the buyers were starting to wrestle control from the sellers.  Looking at the major swing low at $33.94 in the downtrend, if you look at the last two bars in the chart, you can see there was a rejection to the downside, followed by buying on the open of the next candle which went up to this key $33.94 level.

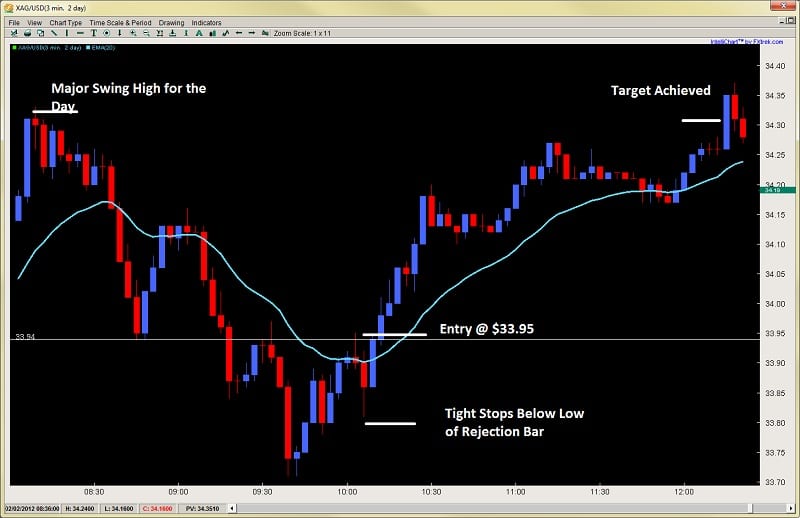
This rejection + the buying from the open was communicating to me the buyers were likely making their move.  When I see that, I am going to buy that.  I took a buy 1pip above this swing point at $33.95 with my stop below the low of the rejection candle prior, while targeting the SH for the day.  This gave me a $.35 target and a $.15 stop for 2.33:1 R:R which was fine with me.

intraday price action forex price action trading 2ndskiesforex

The market then climbed for the next 5 out of 6 candles suggesting the buyers had come in just before my move and I was riding the momentum of their buying.  After a small rejection, the market went sideways, so since the bulls were still in control and had not conceded it, I stayed in.

Shortly, after a little further buying and small pullback, the target was achieved taking out the Swing High for the day as you can see in the chart below.

2ndskiesforex intraday price action trading

This is exactly how I took each trade, found my entry, stop, and limits – all using pure price action analysis, combined with favorable R:R ratios.  This should give you an insight of how you can trade price action.  By learning to read the market structure, looking for changes and subtle clues, then taking the most favorable plays that present themselves.

I would like to add that even though I am trading on a smaller time frame, I am not necessarily looking to be significantly more active.  I am exploiting the same price action setups I see on the 1hr, 4hr and daily time frames.  In fact, my methodology is really the same – wherein I am looking for a couple really high quality setups with very favorable R:R’s.  These can be found every day, whether you are trading the 3min time frame, or the 1hr, 4hr and dailies.  Your ability to read price action and all the clues will help you to spot the best opportunities, where the big players are driving the market, and how to find high quality setups.

For those of you looking to trade price action, visit our Advanced Price Action Course where we teach rule-based systems for trading Price Action.

If you appreciate our price action commentary and insights, please make sure to click the ‘Like’ button at the top of the page.

One of the questions I get most often about reading price action has to do with breakouts.
How to spot them?
How to know when it is a false breakout?
How to get in after it’s already broken out?
Ok, i’m in one now, how do I know it’s for real?
It is the last question we are going to focus on – how to determine if the breakout you are in is for real.
Over a series of three articles, we are going to cover 3 key elements to a breakout, dissecting the anatomy of a breakout such as;
what they should look like
what you will want to see
and what are the key characteristics of them.
By learning to read these price action patterns or elements inside a breakout, you will get a more unique grasp of how to understand breakouts.  This can be done on any time frame as the price action pattern is the same.
From an Order Flow Perspective
Before we get into what a breakout bar should look like, let’s explain what is happening from an order flow perspective in a breakout.
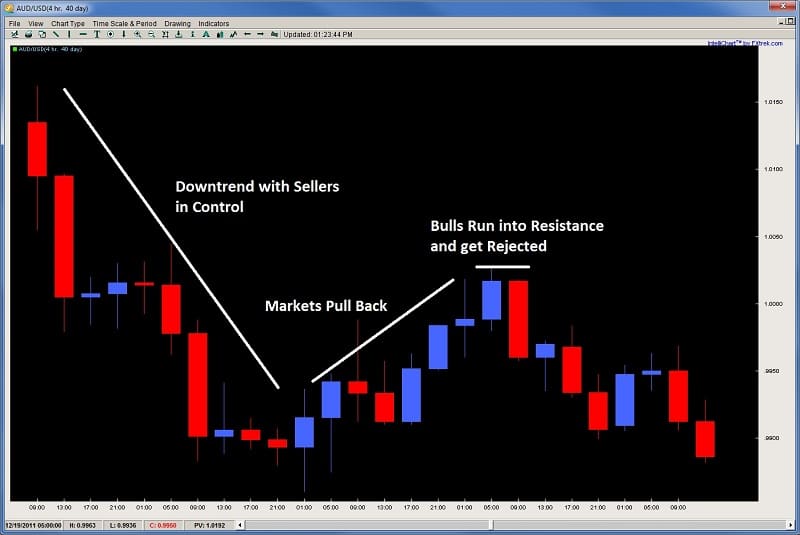
Using an upside breakout as an example, a resistance level has been established, with a minimum of one rejection, perhaps 2 and possibly more.  This rejection in price denotes sellers over-powered the buyers and wrestled control of the market.   The rejection could be slow, or it could be violent, but nevertheless, the bulls were in control, failed to break above a level, and the market pulled back.
price action trading - key price action elements to breakouts audusd rejection
Since they were successful in doing it before, there is a good chance previous or new sellers will be parked at the same rejection level to short the market again.  Naturally, their stops will be placed just above the key rejection level.  This is critical to know, because it is these stops when they get tripped which can help accelerate a breakout.
Why?
If there are players short at a key level, to exit they must buy back the pair which in turn, helps the bullish breakout get more steam.  Keep this in mind for later while we start to discuss the first key element of a breakout.
Key Element #1 – The Breakout Bar
When witnessing a breakout, the first bar (or breakout bar) should be given the most scrutiny.  This bar should be anything but timid in nature.  Keep in mind, when a breakout is forming, there is a fight between the bulls and the bears which creates a tension.  Sellers have placed a lot of money believing the market will reverse, while the bulls believe it will clear the key resistance above.
Thus, when the bulls are trying to break a key level, if the price action and bar approaching the key level is timid in nature, say with a small body, perhaps a wick on both sides, this will only give the sellers confidence they (the bulls) do not have enough dollars, buyers, or both, to break the key level.  The sellers will sense this weakness and push back with a vigor if they really want to defend that level.
So the breakout bar should be strong in nature, signifying;
a) the buyers are putting a lot of force (either dollars, number of buyers, or both) into the breakout
and
b) they were able to clear out the sellers by tripping their stops
What does a strong breakout bar look like?
It should minimally be large in nature, meaning it has a large body (larger than usual).  This large body demonstrates strong buying power and participation from the bulls.  The stronger the force in a breakout, the more momentum it will likely have as it tries to make new ground.  A large body shows commitment and force on the buyers part.
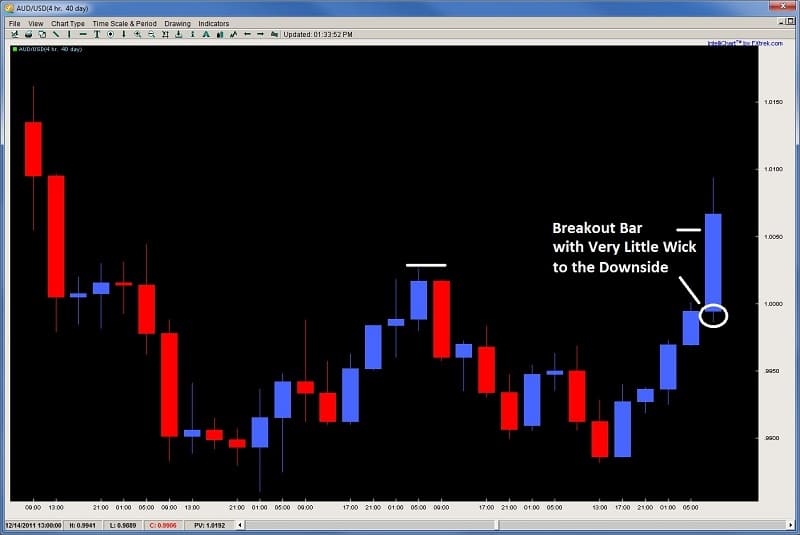
Another important element of a good breakout bar is it has little or no wick to the downside.
Why?
A bar that opens and has few or no pips to the downside, communicates to us the buyers were present and strong in the market from the open of the candle.  They wasted no time buying from the open giving the sellers no time to enter.  Their strong buying from the open suggests commitment to drive prices up and establish control from the beginning.  Thus, look for little or no wick to the downside on the breakout bar such as in the example below.
price action trading - key price action elements to breakouts audusd breakout bar
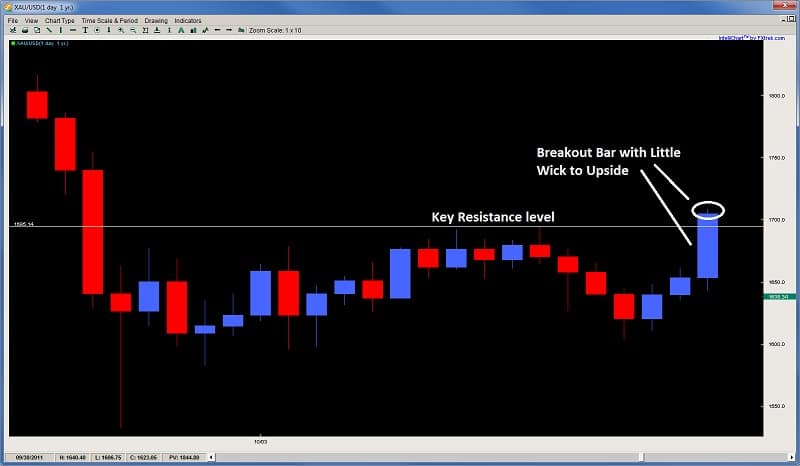
Thirdly (and consequently), the breakout bar ideally has little or no wick to the upside as well.  The presence of a little wick suggests the buyers maintained control going into the close, thus not taking profits, and likely communicating they think there is more upside to be had, thus staying in the market. This will also deter sellers from entering as they are reading the strong close from the bulls, thus, they will be hesitant and likely wait for a better price action trigger.  Take a look at the example below.
price action trading - key price action elements to breakouts audusd breakout bar upside wick
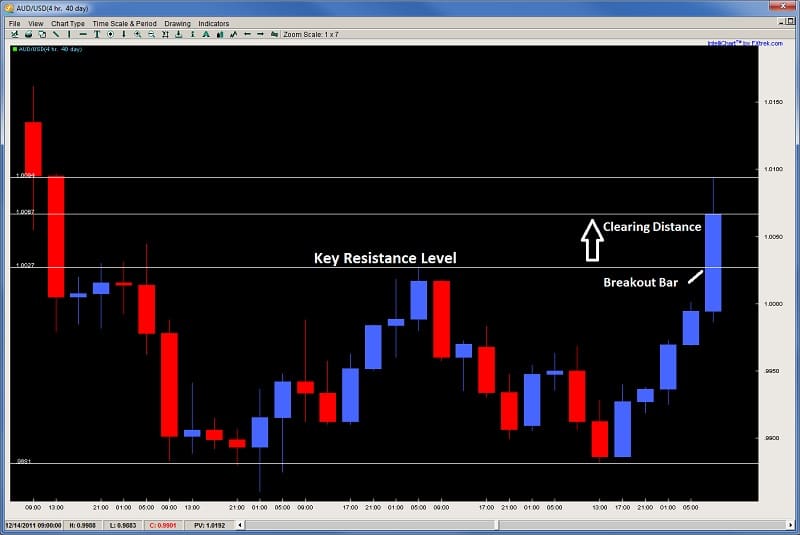
Lastly, a good breakout bar will have clearing distance.  This is the distance the bulls have cleared from the previous resistance level which was containing the upside.  If they only clear the resistance level by a small amount, its possible they did not trip any stops, thus failing to add steam to their breakout play.  This could also suggest to the sellers the bulls do not have a strong punch, so the bears may see a weakness, and thus enter the market.
However, if the breakout clears the resistance level by a good distance, then stops were almost certainly tripped, thus adding to the upside break.  This will also communicate to the bulls they have taken out all the barriers and thus can push for higher ground with less orders from the bear side.
To be specific, the clearing distance is the distance in pips from the high of the resistance level broken (or low in a downward break), to the close of the breakout bar.  The high of the breakout bar is useful as it tells us how far the bulls were able to push (and clear) from the resistance level in the breakout bar.  However, if it pushes really high, but gets rejected strongly and barely closes above the lows, this would communicate to us sellers did not accept the value of the pair that high above, and rejected it strongly, taking control from the bulls (who were in control during the breakout).  So the key is how far does it close above the high of the previous resistance level.  This is known as the clearing distance and is demonstrated in the chart below.
price action trading - key price action elements to breakouts audusd breakout bar clearing distance
In Closing
We have just covered 4 critical characteristics to what a strong breakout bar would look like.  They are;
1) Large Body
2) Small Wick to Downside (for upside breakout, while a small wick to upside for downside breakout)
3) Strong Close
4) Clearing Distance
These four things communicate to us from an order flow and price action perspective why they will likely lead to a strong breakout.
This is part one of a three-part series on reading price action and how to identify key elements to a breakout.  Stay tuned as next week we will cover the second aspect of a strong breakout and how this communicates the breakout will likely continue.
Please remember to leave your comments below and to ‘Like’ and ‘Tweet’ to share the article. 
Also make sure to check out our most recent article on Awareness, Negative Habits, and Concentration in Trading.
 

Here is a new video on trading intraday price action trading.  In this video, I am demonstrating how to read forex price action on an intraday basis for short term price action trading. For those of you wanting to learn advanced price action, make sure to check out my price action course where you learn rule-based systems to trade the forex market using high-probability setups backed by quantitative price action data using simple to learn price action strategies.

This lesson is focused on one of the least discussed topics in trading – price action. In this forex price action training video we teach you how to identify a critical component of price action – Impulsive vs. Corrective moves.