Chris Capre’s Top Trades For 2018
NOTE: Check out Chris Capre’s Verified Forex Trading Results for 2017
As 2017 comes to a close (an interesting one thus far), I wanted to share my top 12 currency trade ideas for 2018. In sharing these forex trading Ideas, I’ll be talking about the price action context, key levels, trend bias, and where I think these forex pairs, stocks, CFD’s, commodities, and or global markets will hit next year.
FYI: They are not in any order of value or strength. Just what I’m seeing as the top currency trade ideas for 2018.
1) Bitcoin
As I’ve talked about in my video on crypto-currency trading, I think most people are overlooking key aspects of Bitcoin. In my view, it’s disruptive on a global scale, and will likely be adopted more in 2018 than it was in 2017.
I personally bought bitcoin around $3,000, Ethereum around 200, and Litecoin near 42. I even tweeted about this ahead of time.
Where are they now?
Bitcoin +320%
Ethereum +210%
Litecoin +200%
You’re welcome…
Now while I think all of them are due for a pullback (which they average about 1x every quarter between 25-40%), I’m looking at buying more bitcoin for a long term play. Let’s get into the price action context and where I see it going.
Bitcoin Price Action Analysis
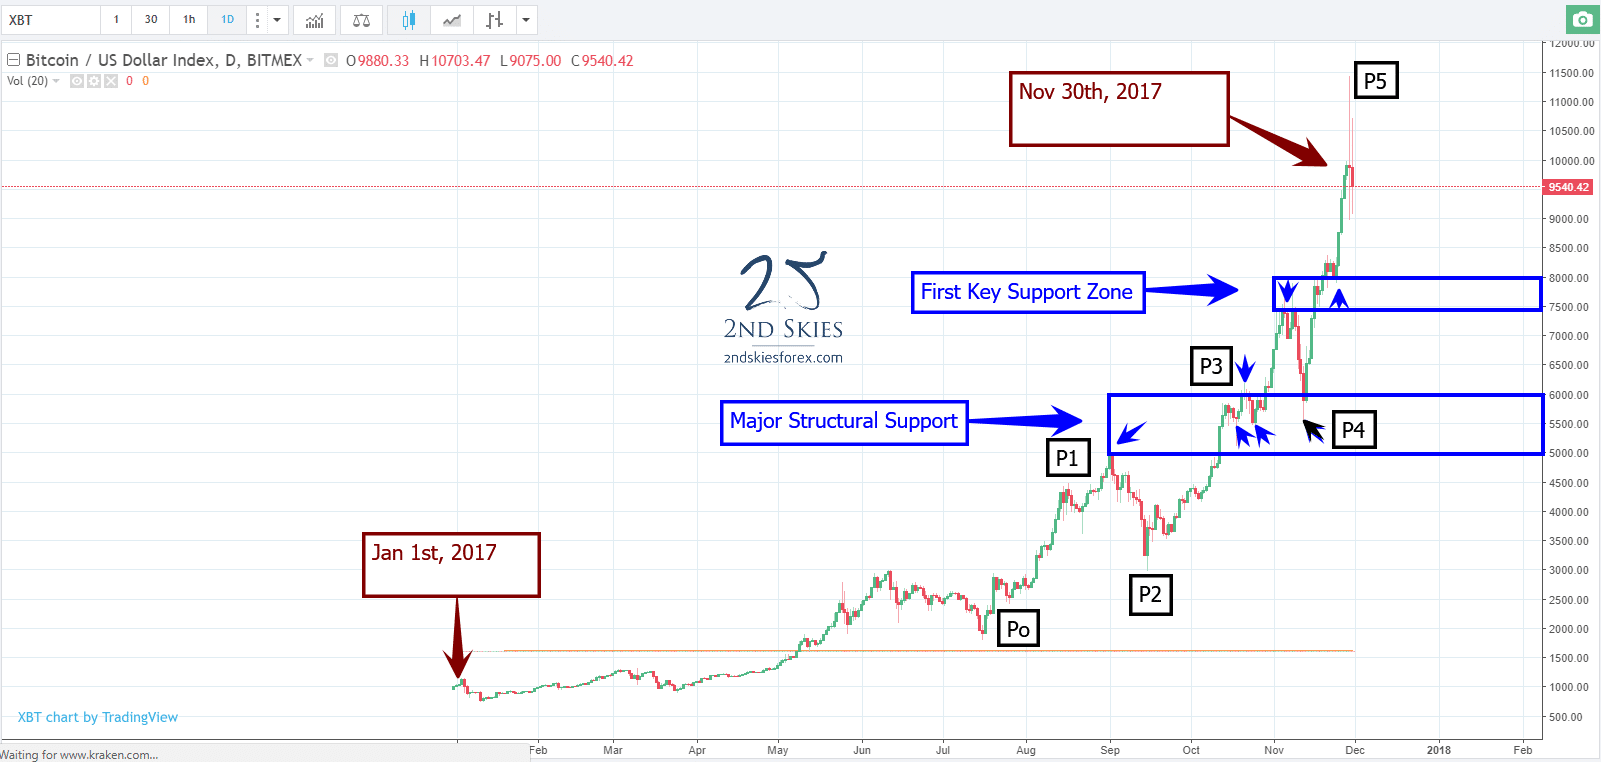
Looking at the chart below, you can see where the crypto currency started, and where it is now. In my view, price action like this looks almost parabolic, and getting ‘frothy’. Do I think the price action is exhaustion? I’m not 100% there yet, but we’re getting close IMO.

In parabolic, or exhaustion price action moves, each successive leg climbs faster, higher or both and will have a steeper angle on each impulsive leg up. This has to do with an acceleration of order flow as more players from institutional to retail move in.
If you look at the moves from P0 to P1 (1800-4900), that is $3100 from July 16th – Sep 1 (46 days). The next leg P2-P3 went from $3000 – $7600 (+$3600) in about 50 days. The last run went from $5500 – $11400 (or +$5900) in just 17 days. So all 3 impulsive legs up getting bigger in price moves each time. That is looking ‘frothy’ to me.
Hence I’m looking to buy on a pullback either at the first key support zone, or the major structural support. Also, a 40% pullback in price would bitcoin just under $7000, while a 30% pullback towards $8000.
Where do I think bitcoin is going next year? Assuming it doesn’t have a major crash (like it has 3x in the past of 50+% or more), IMO bitcoin will hit $20K before the end of 2018. If we get that major crash, it could be years before it makes new highs.
To Summarize:
ST Price action context: neutral to slightly bearish with current volatility
MT Price action context: bullish
LT Price action context: bullish
2) USDCAD
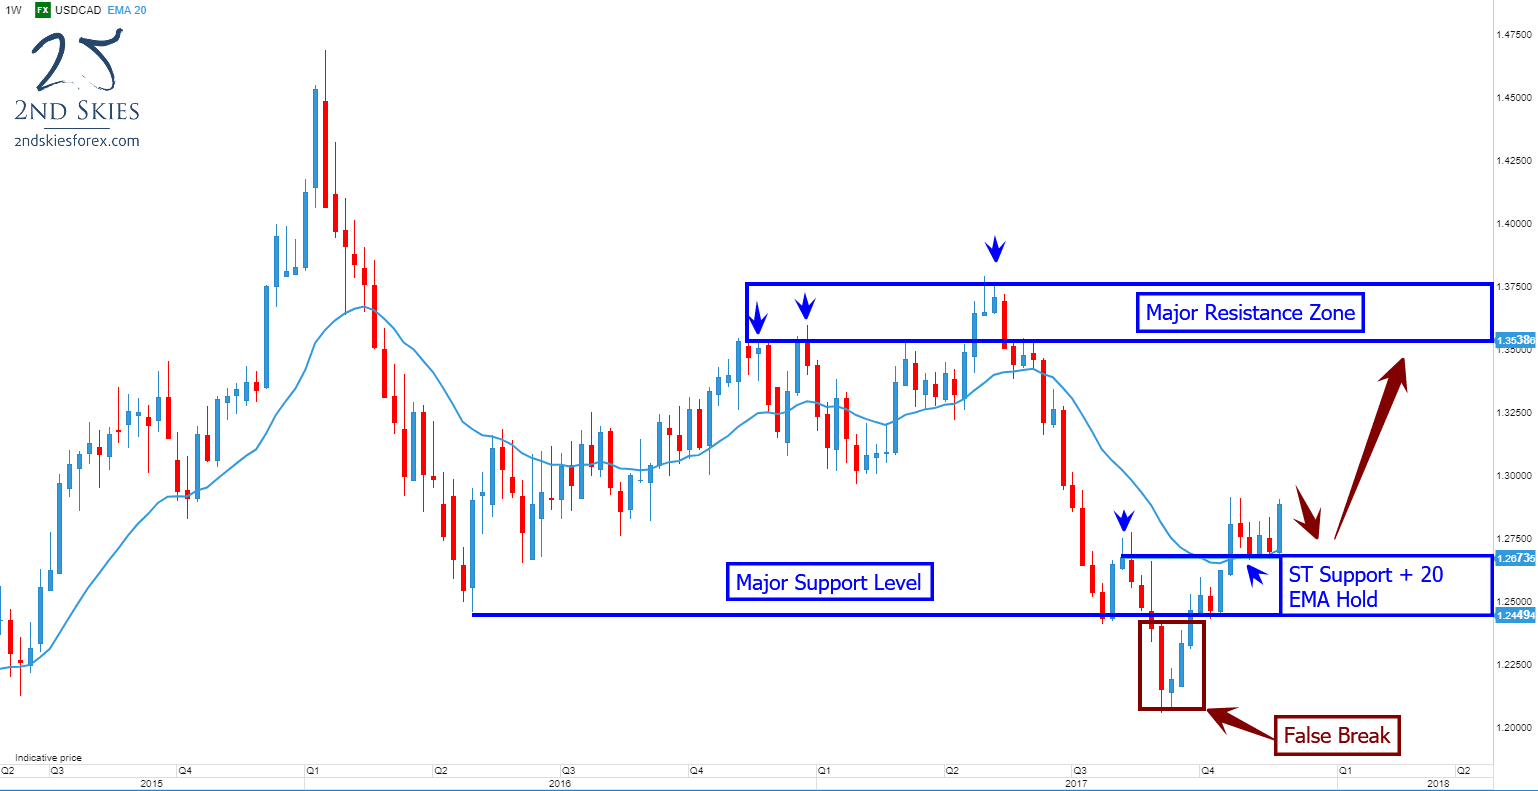
Jumping straight into the price action context for the CAD, the most important thing in my mind is the false break that happened late in Q3.

After breaking a multi-year support level around 1.2449, instead of finding new sellers and continued interest from current shorts, the pair broker sharply back above the key level, forming a false break setup.
After spending 3 weeks holding the key level, the pair has surged and is now holding for over a month above the weekly 20 EMA. All of these signs point to IMO more bullish prices for the pair.
1.2673 and 1.2449 become ST support in the current context while the next key resistance zone for bulls is between 1.35 and 1.3750.
To Summarize:
ST Price action context: bullish
MT Price action context: bullish
LT Price action context: neutral
Alibaba (BABA)
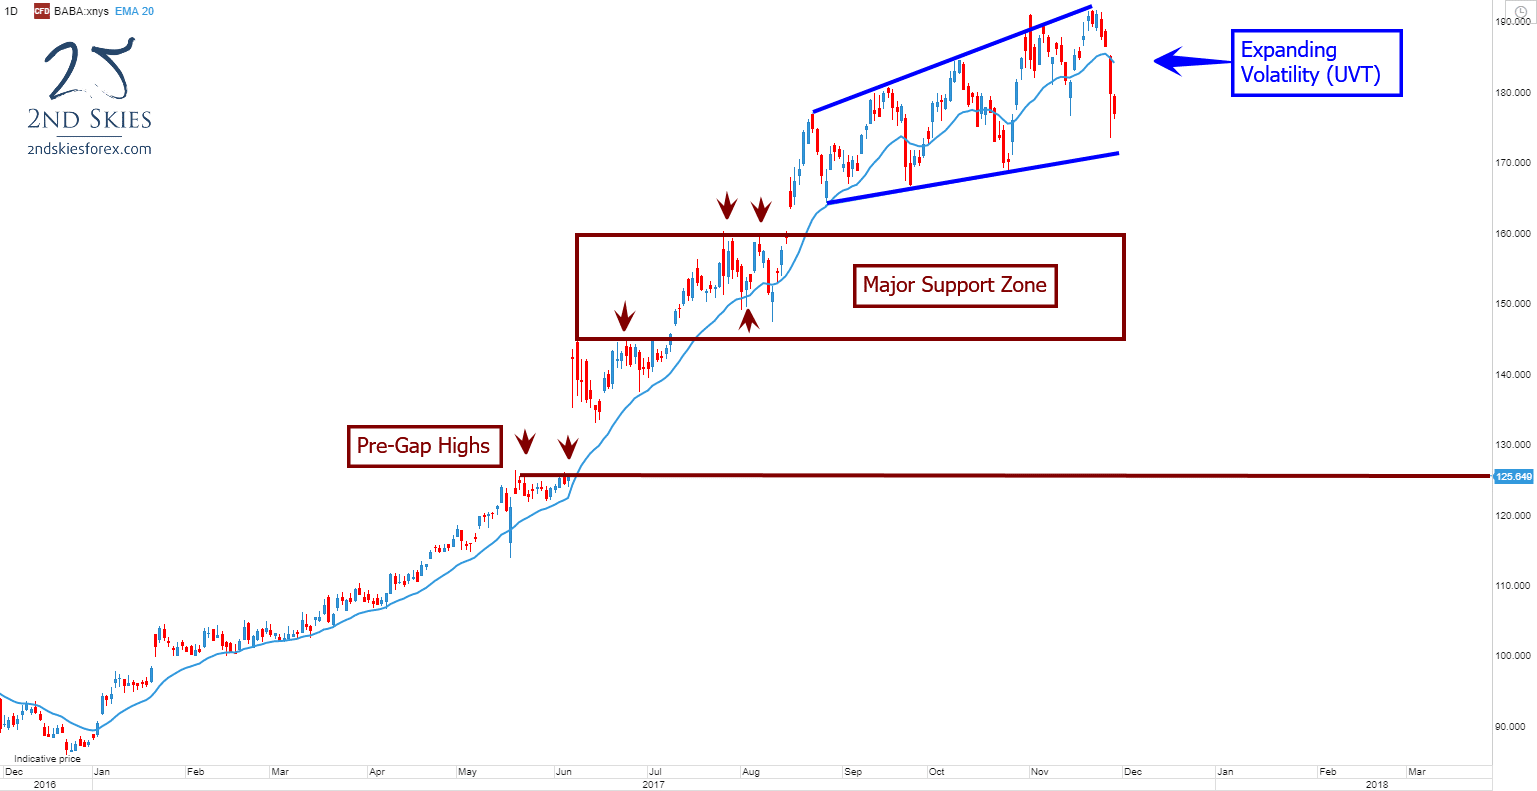
One of the most successful companies to come out of China recently, Alibaba (owned by Jack Ma) has had an amazing 2017. Starting at about $90, the stock is set to end November around $175, or a ~95% gain on the year.

When I look at the current trend and price action, I see a clear bull trend with expanding volatility. Course members will recognize the UVT and what that means in terms of the order flow behind the market.
The expanding volatility (or UVT) doesn’t signify a trend change, so I’m remaining bullish on the stock for 2018.
The first major support zone comes in just under $160 and goes to about $145 where you can see a PBO setup.
The next support IMO is the pre-gap highs at $125.
Assuming we don’t get a major market crash (similar to 07-09), I’m expecting Alibaba to hit $300 next year, and a ‘most optimistic’ case with a $400 price target.
Simply put, this doesn’t look like the price action context or chart of a stock that is reversing or ending it’s bull trend.
To Summarize:
ST Price action context: neutral/volatile
MT Price action context: bullish
LT Price action context: bullish
Want to see my other top trades for 2018?
Then check out my Advanced Price Action Course where my members got a full video breakdown of my other top trade ideas for 2018.
In that video, I discuss the price action context, key levels, trend bias, potential entry points and price targets.
Course members also get access to my member market commentary (2-3x per week), access to the private member trade setups forum, trader quizzes, private member webinars and a free skype follow up session with me, so quite a lot.
I hope you enjoyed these trade ideas and hope to see you in the members area soon.

Hi Chris! What does the “IMO” abbreviation mean? I am new to the study of trading and price action. And also “ST”, “MT”, and “LT” in the following example: thanks in advance! Your insights are always helpful 🙂
ST Price action context: bullish
MT Price action context: bullish
LT Price action context: neutral
IMO = in my opinion
LT = long term
MT = medium term
ST = short term
Thank you 🙂
Np, glad I could help